GPM和TRMM卫星日降水数据在黄河源区的适用性分析
The GPM and TRMM satellite-based precipitation products applied in the source regions of the Yellow River
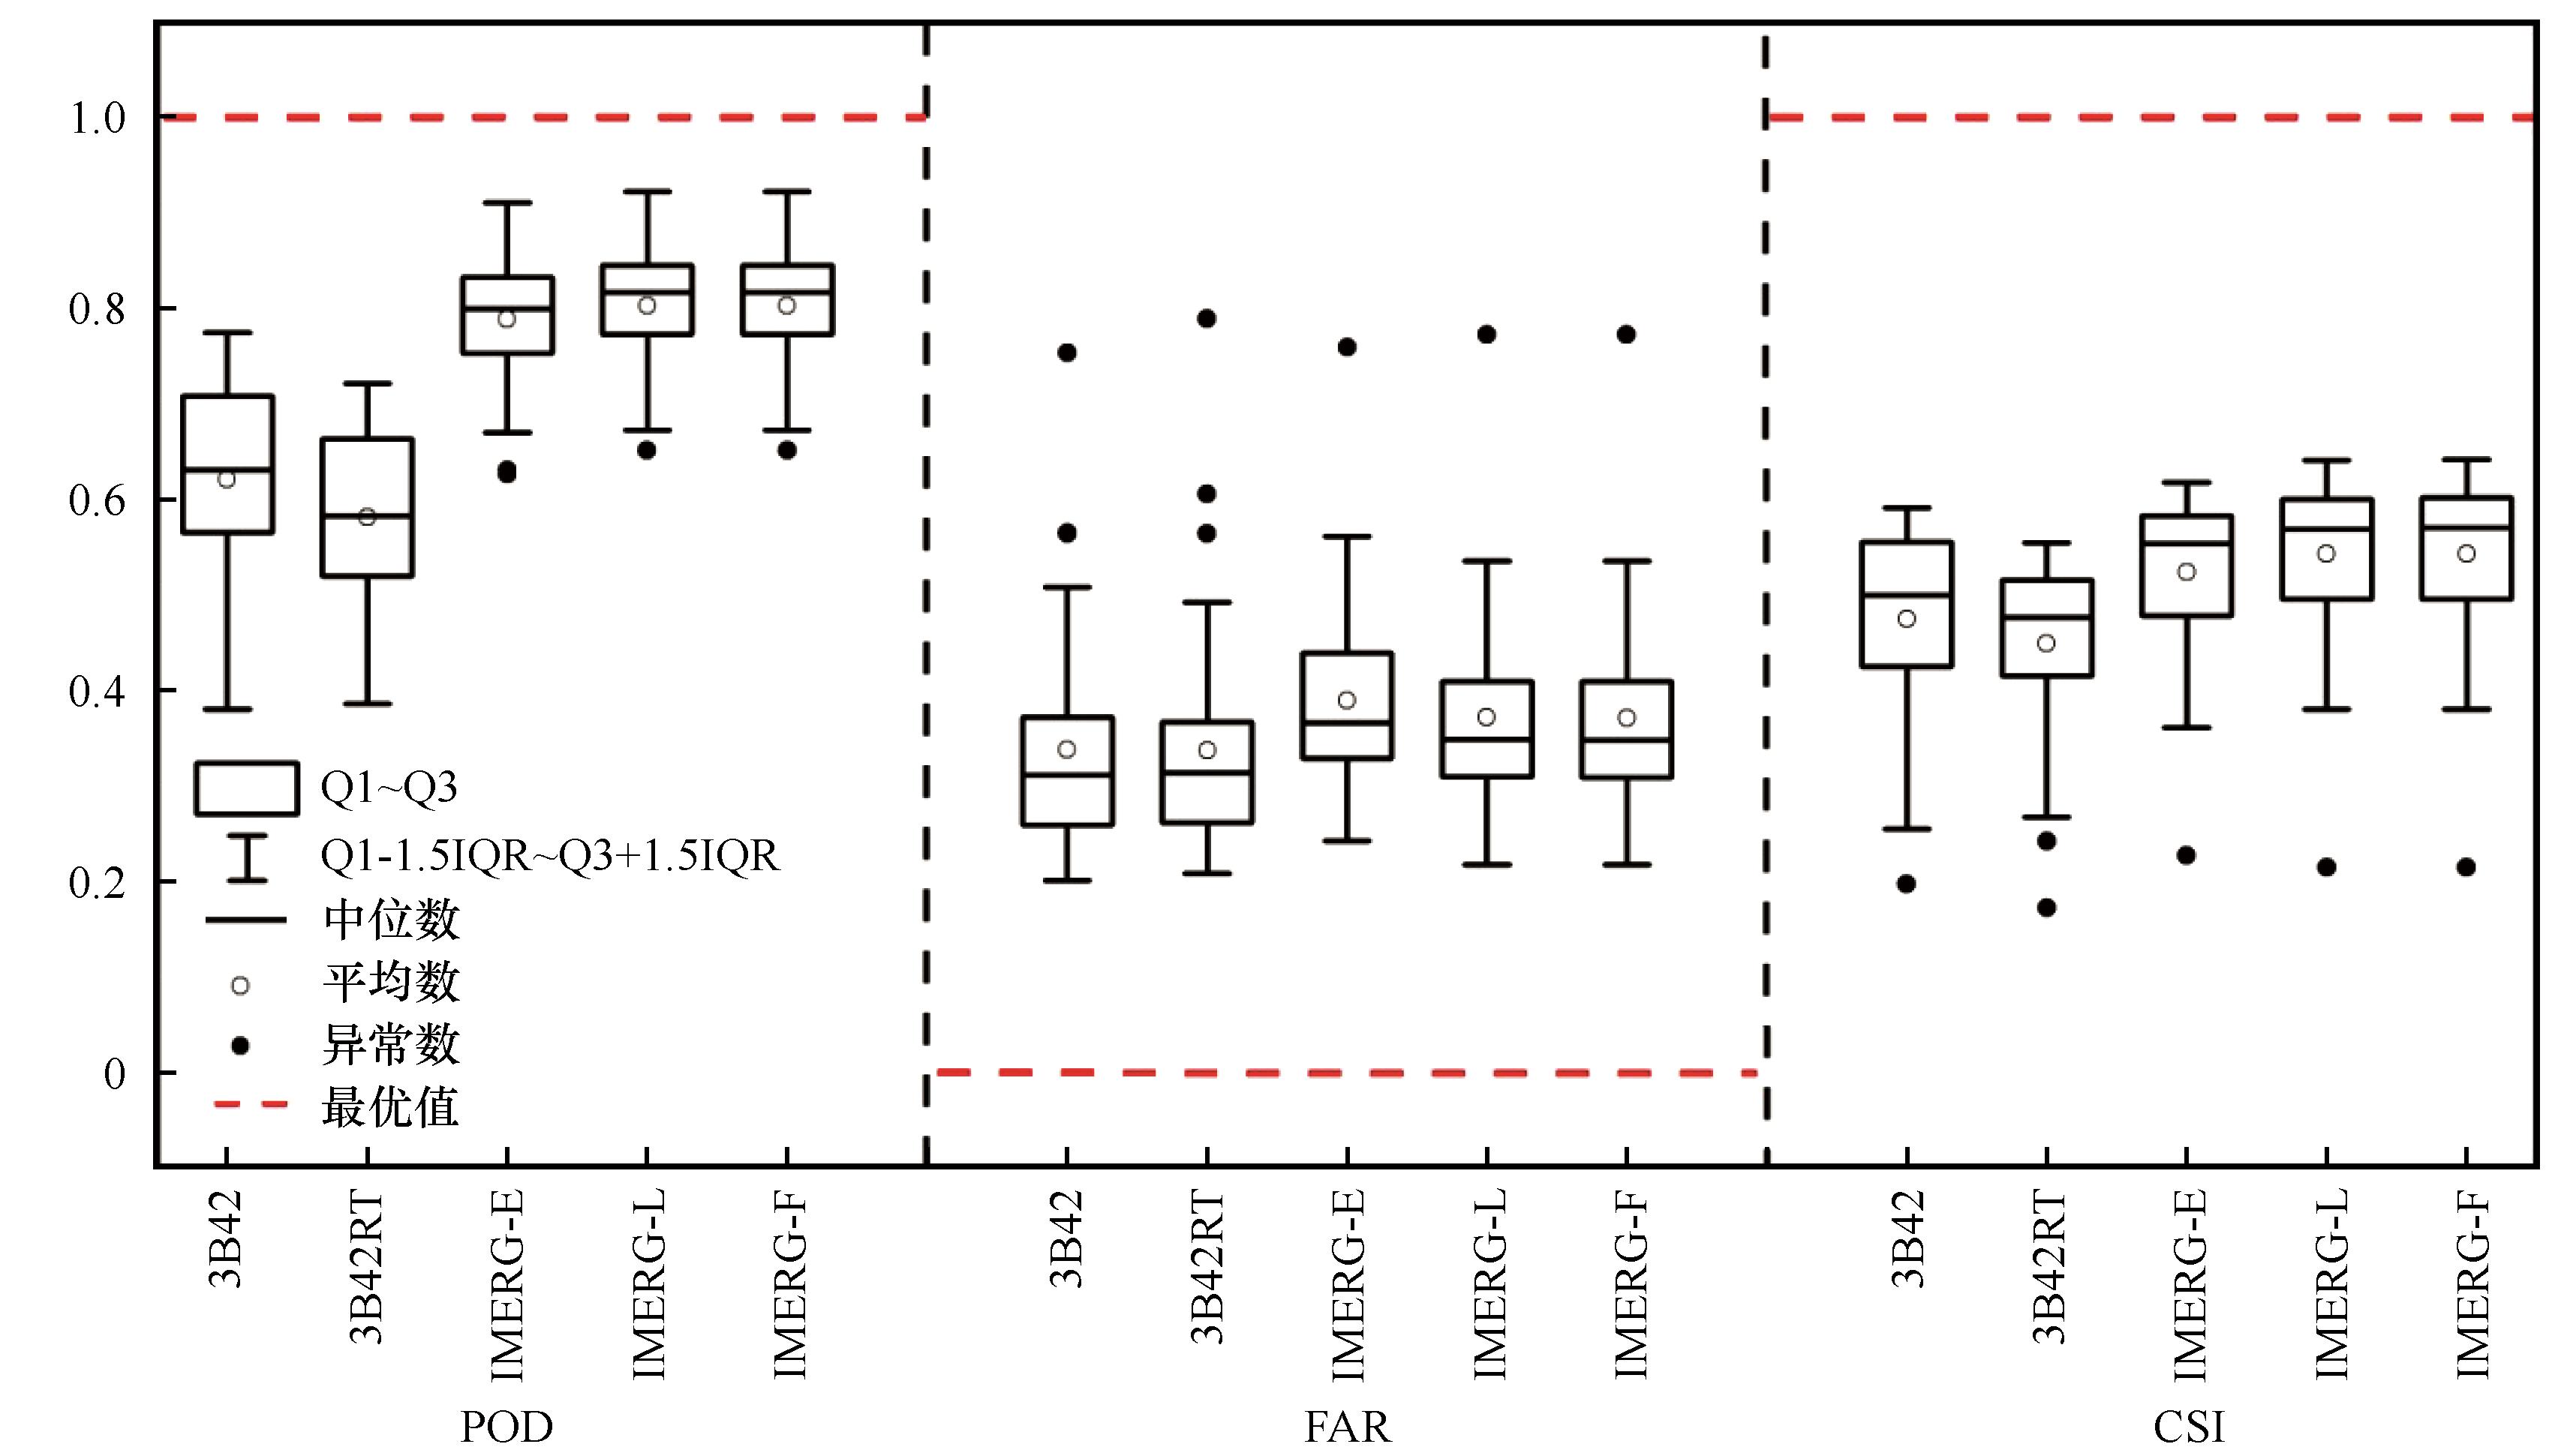
从下到上的五条横线分别代表数据的下限、下四分位数、中位数、上四分位数和上限。空心圆表示数据平均值,实心圆表示极端值,虚线表示所选参数的最优值
The five lines from bottom to top indicate minimum value,25thpercentile,50th percentile,75th percentile and maximum value,respectively. Empty circles represent mean values,filledcircles represent extreme values and dotted lines represent perfect values of parameters selected