下边界条件对多年冻土温度场变化数值模拟的影响
Influence of lower boundary conditions on the numerical simulation of permafrost temperature field changes
下边界条件对多年冻土温度场变化数值模拟的影响 |
| 孙哲, 赵林, 胡国杰, 乔永平, 杜二计, 邹德富, 谢昌卫 |
|
Influence of lower boundary conditions on the numerical simulation of permafrost temperature field changes |
| Zhe SUN, Lin ZHAO, Guojie HU, Yongping QIAO, Erji DU, Defu ZOU, Changwei XIE |
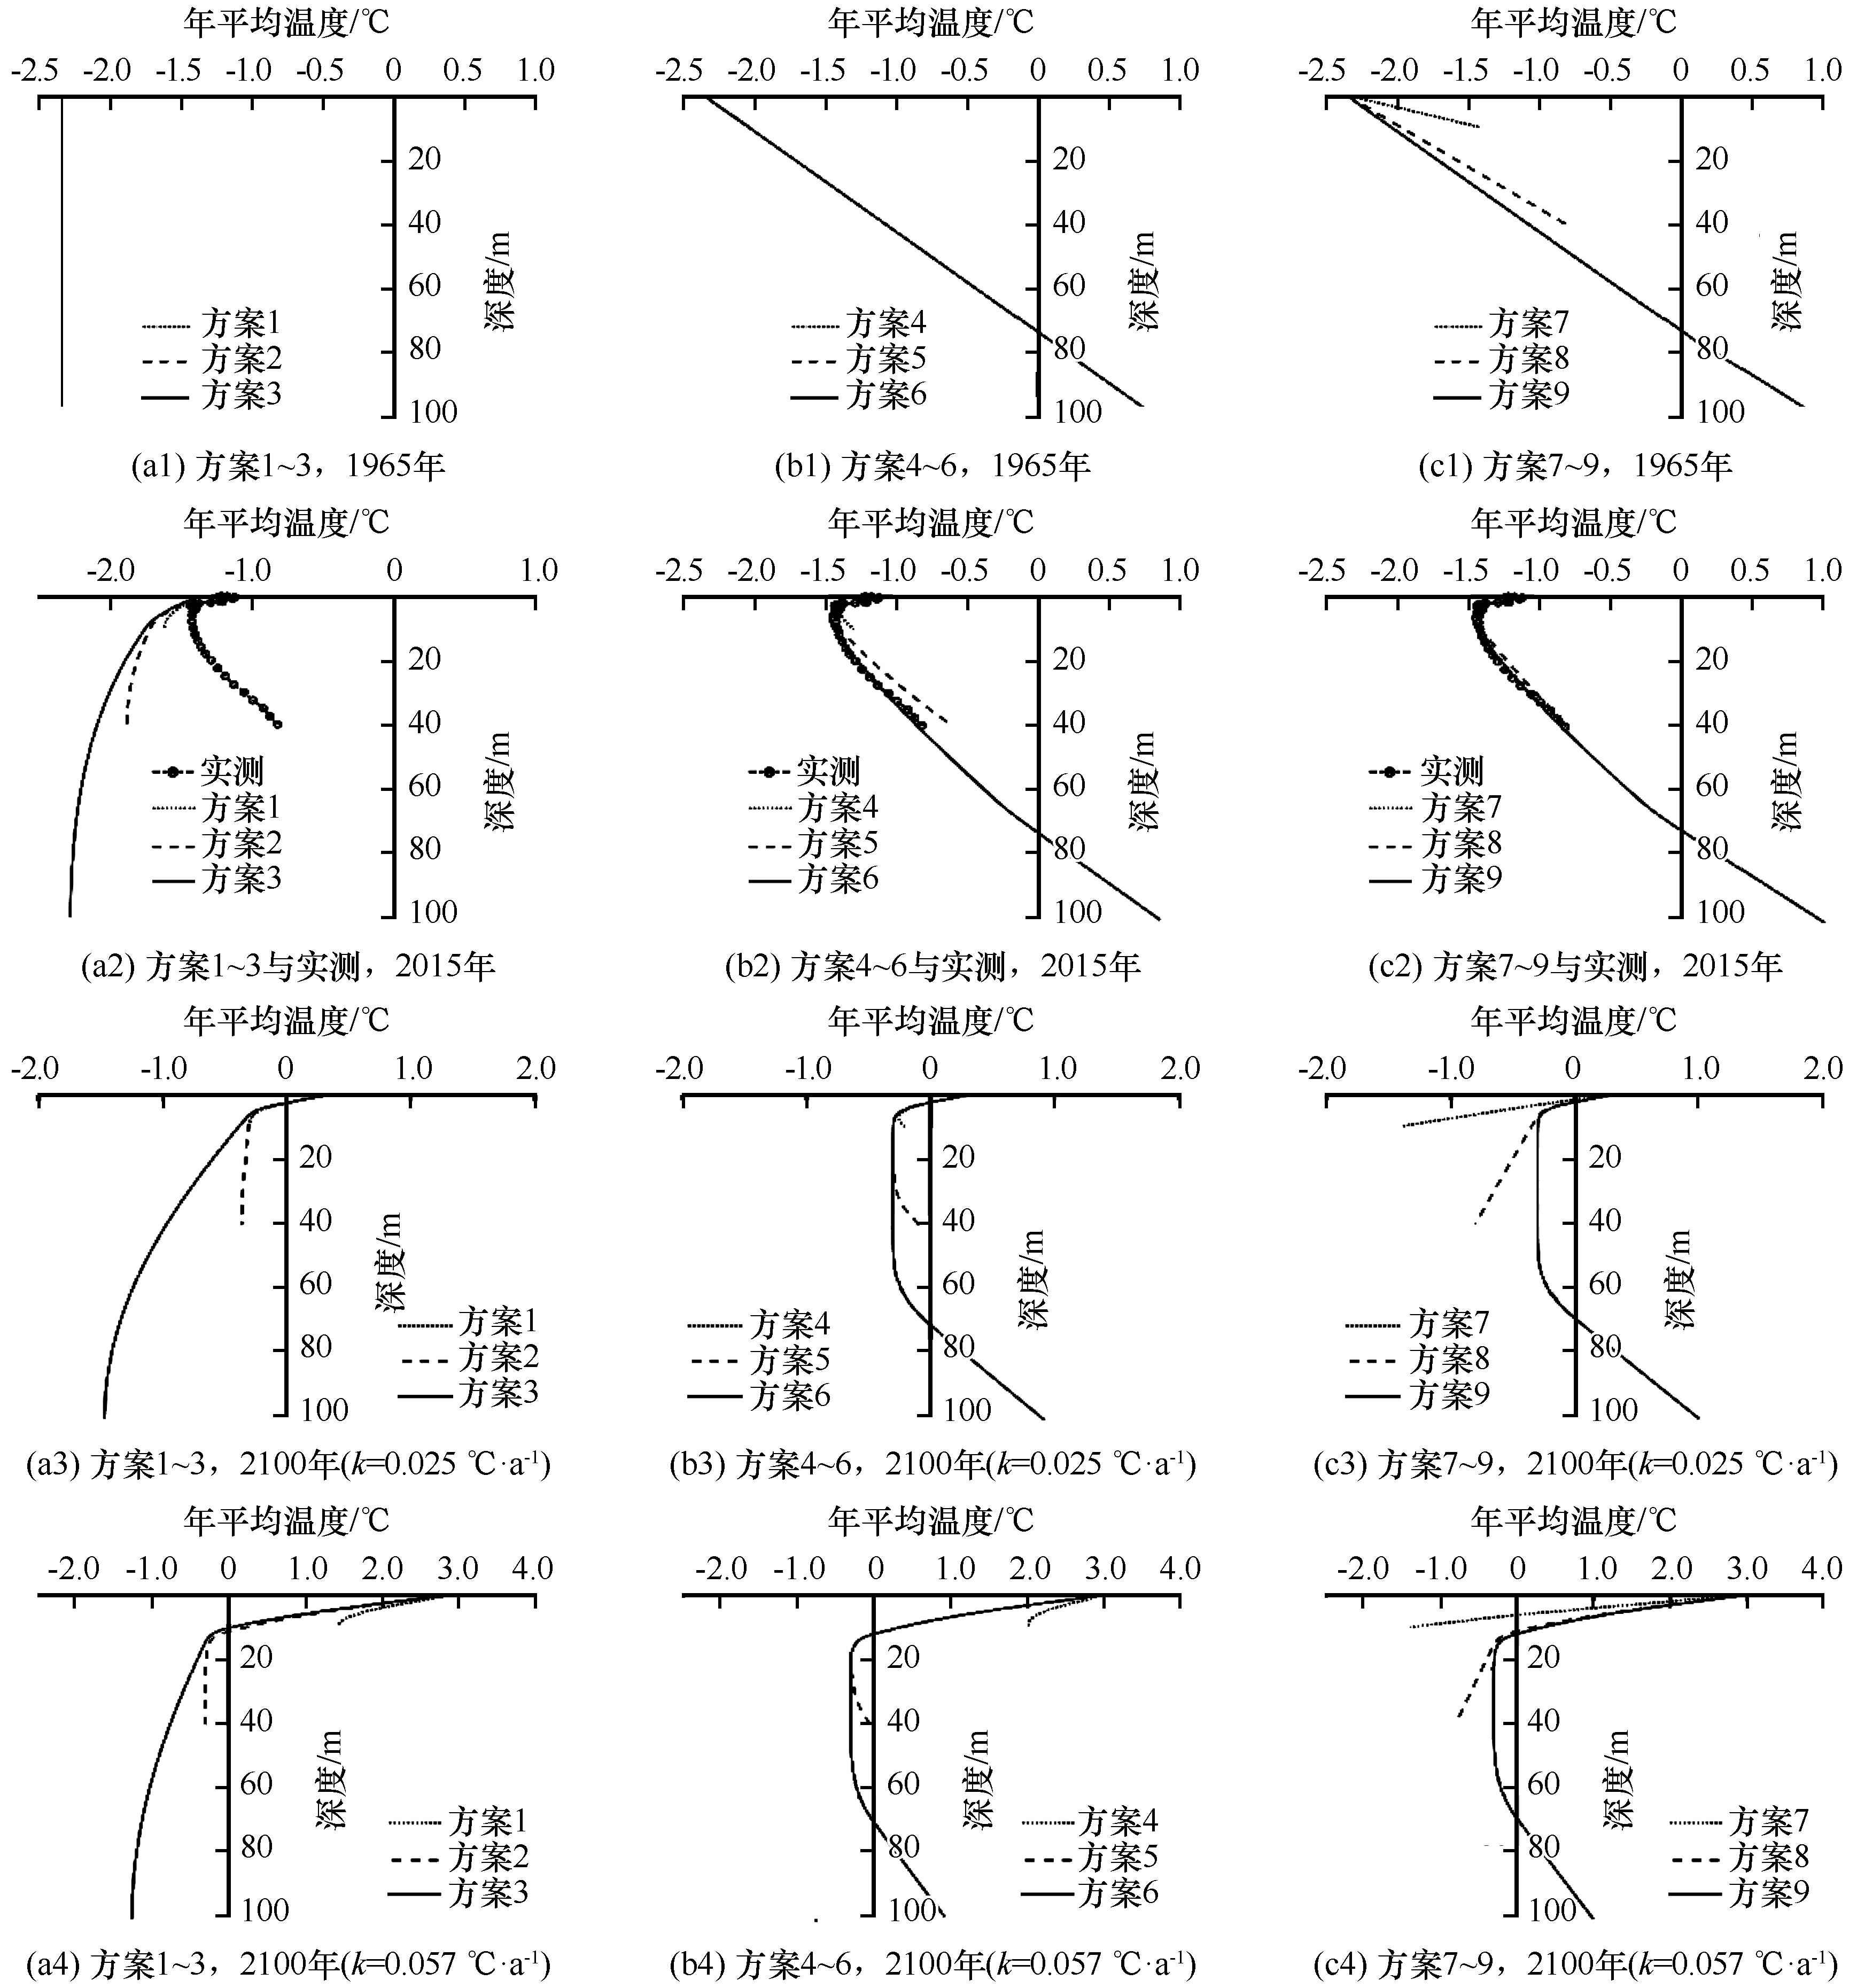
| 图4 各方案模拟的1965年(预热完成)的地温-深度曲线(a1, b1, c1),模拟和实测的2015年地温-深度曲线(a2, b2, c2),在k=0.025 ℃·a-1 (a3, b3, c3)和k=0.057 ℃·a-1 (a4, b4, c4)未来升温情景下模拟的2100年(末年)地温-深度曲线 |
| Fig.4 Comparison of simulated 1965 (initialization complete) temperature-depth curve(a1, b1, c1), simulated and measured 2015 temperature-depth (a2, b2, c2), and simulated 2100 (last year) temperature-depth curve as k=0.025 ℃·a-1 (a3, b3, c3) and k=0.057 ℃·a-1(a4, b4, c4) |
|
|