一种新的土壤冻融特征曲线模型
A new model to describe soil freezing-thawing characteristic curve
一种新的土壤冻融特征曲线模型 |
| 付子腾, 吴青柏, DYCK Miles, 何海龙 |
|
A new model to describe soil freezing-thawing characteristic curve |
| Ziteng FU, Qingbai WU, Miles DYCK, Hailong HE |
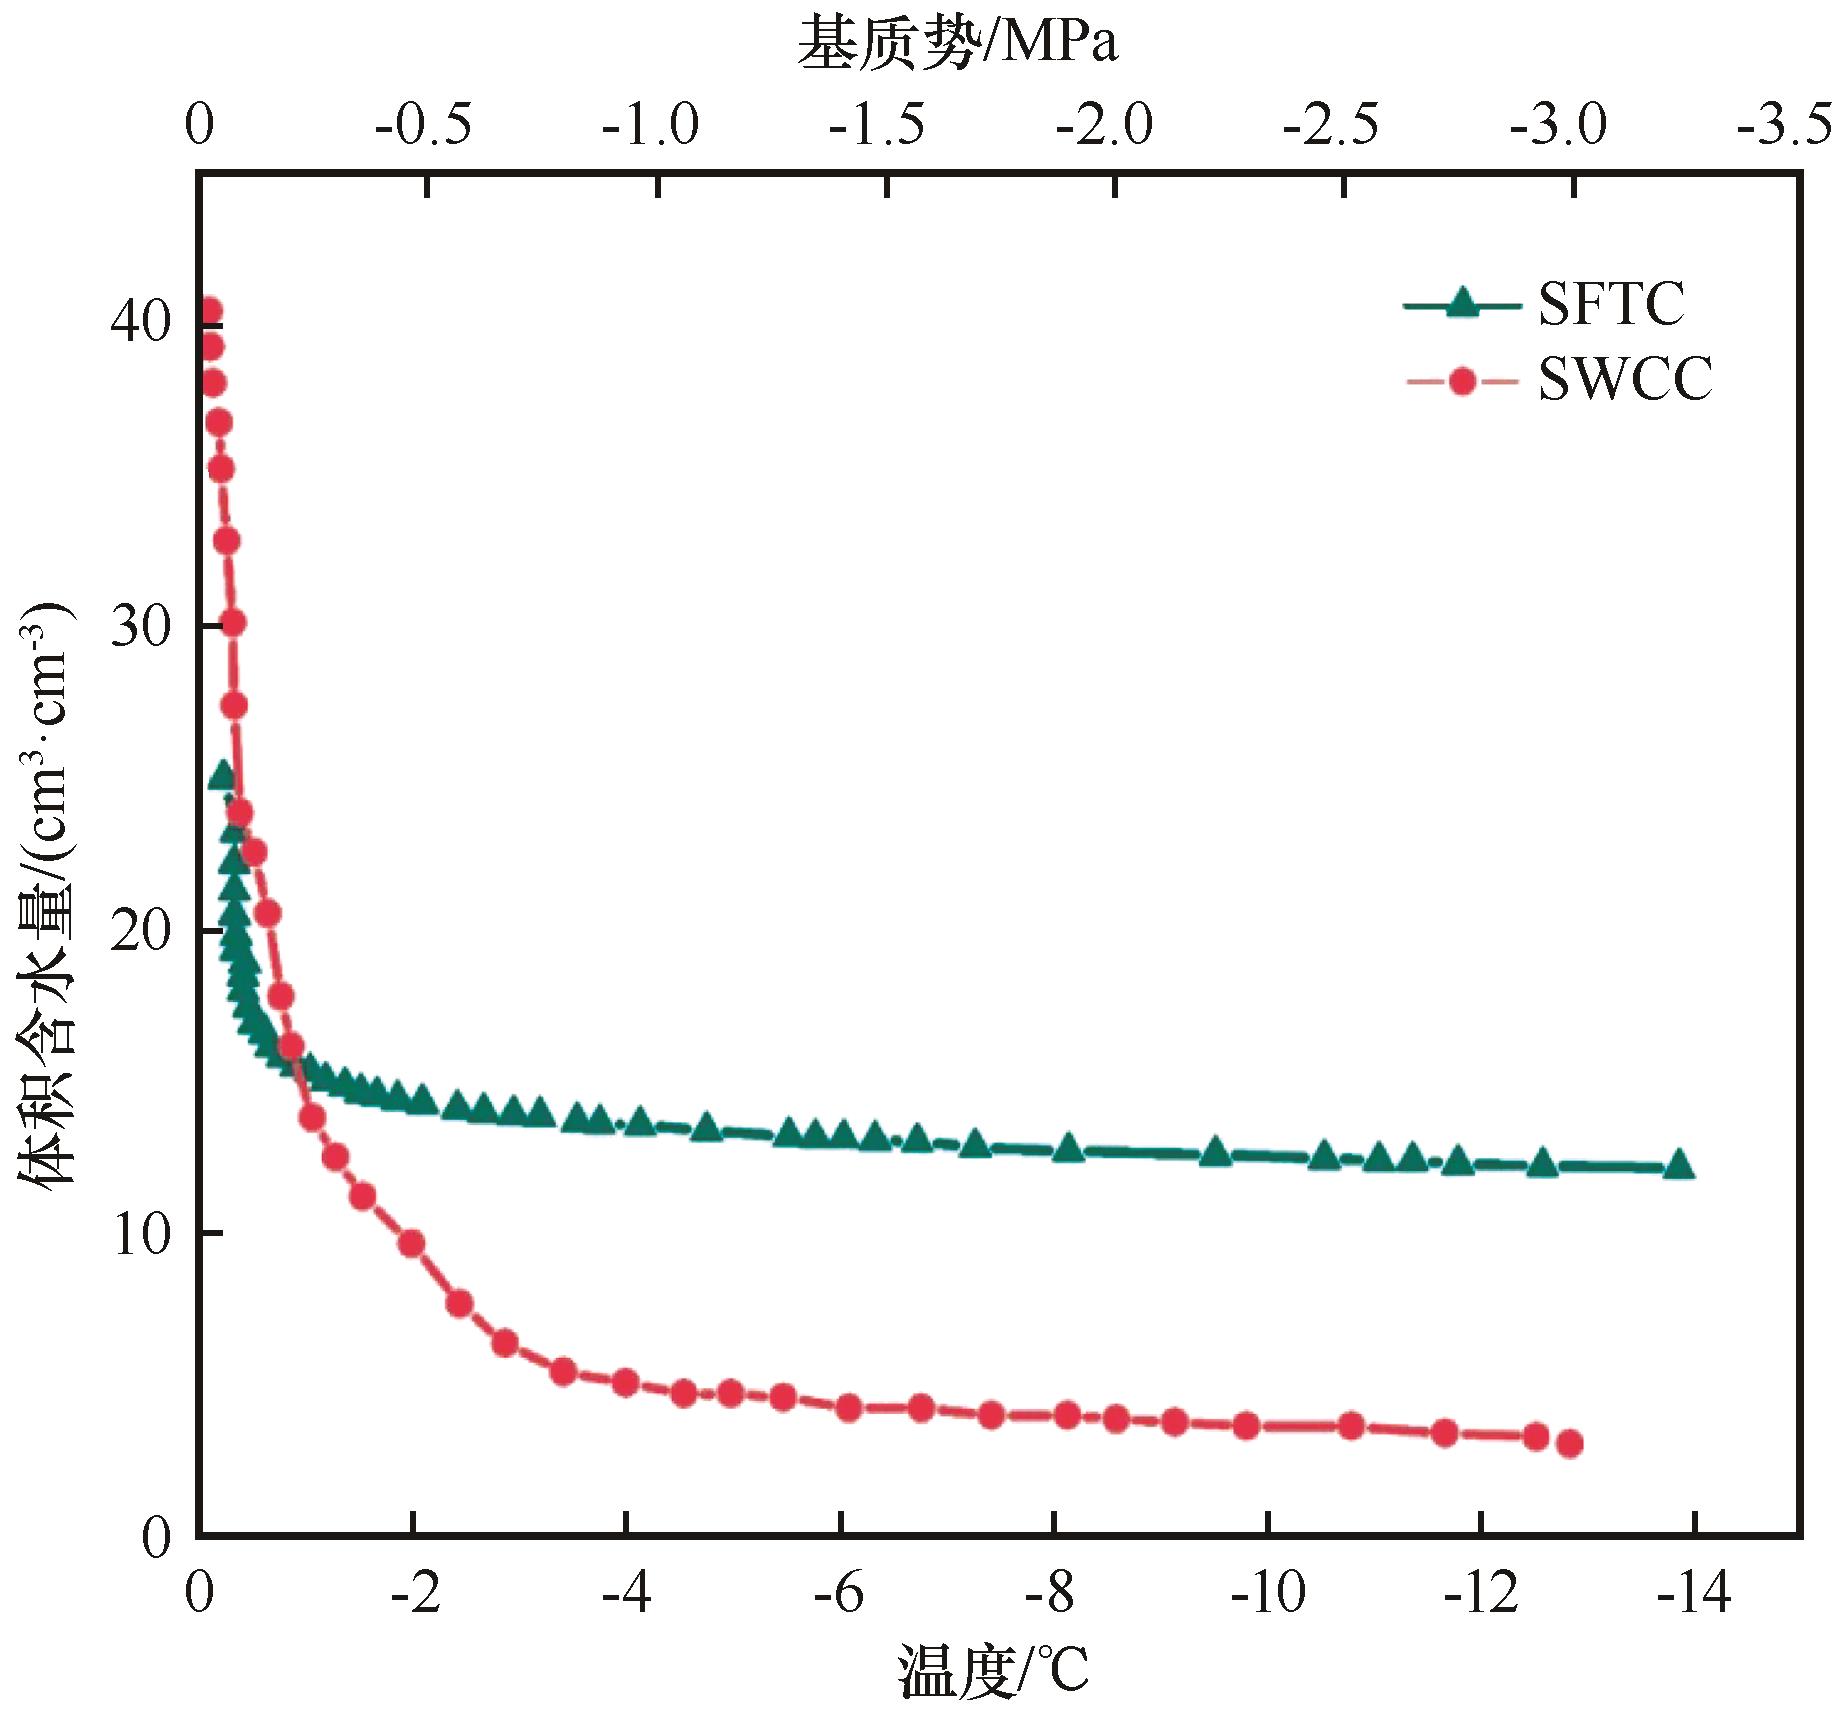
| 图1 SFTC和SWCC的比较,数据来自Wen等[ |
| Fig.1 Comparison of soil freezing-thawing characteristic curve (SFTC) and soil moisture characteristic curve (SWCC) with digitalized data from Wen et al[ |
|
|