), 张芬1(), 勾晓华1, 刘兰娅1, 夏敬清1, 吴秀平2
), Fen ZHANG1(), Xiaohua GOU1, Lanya LIU1, Jingqing XIA1, Xiuping WU2
), 张芬1(), 勾晓华1, 刘兰娅1, 夏敬清1, 吴秀平2
), Fen ZHANG1(), Xiaohua GOU1, Lanya LIU1, Jingqing XIA1, Xiuping WU2
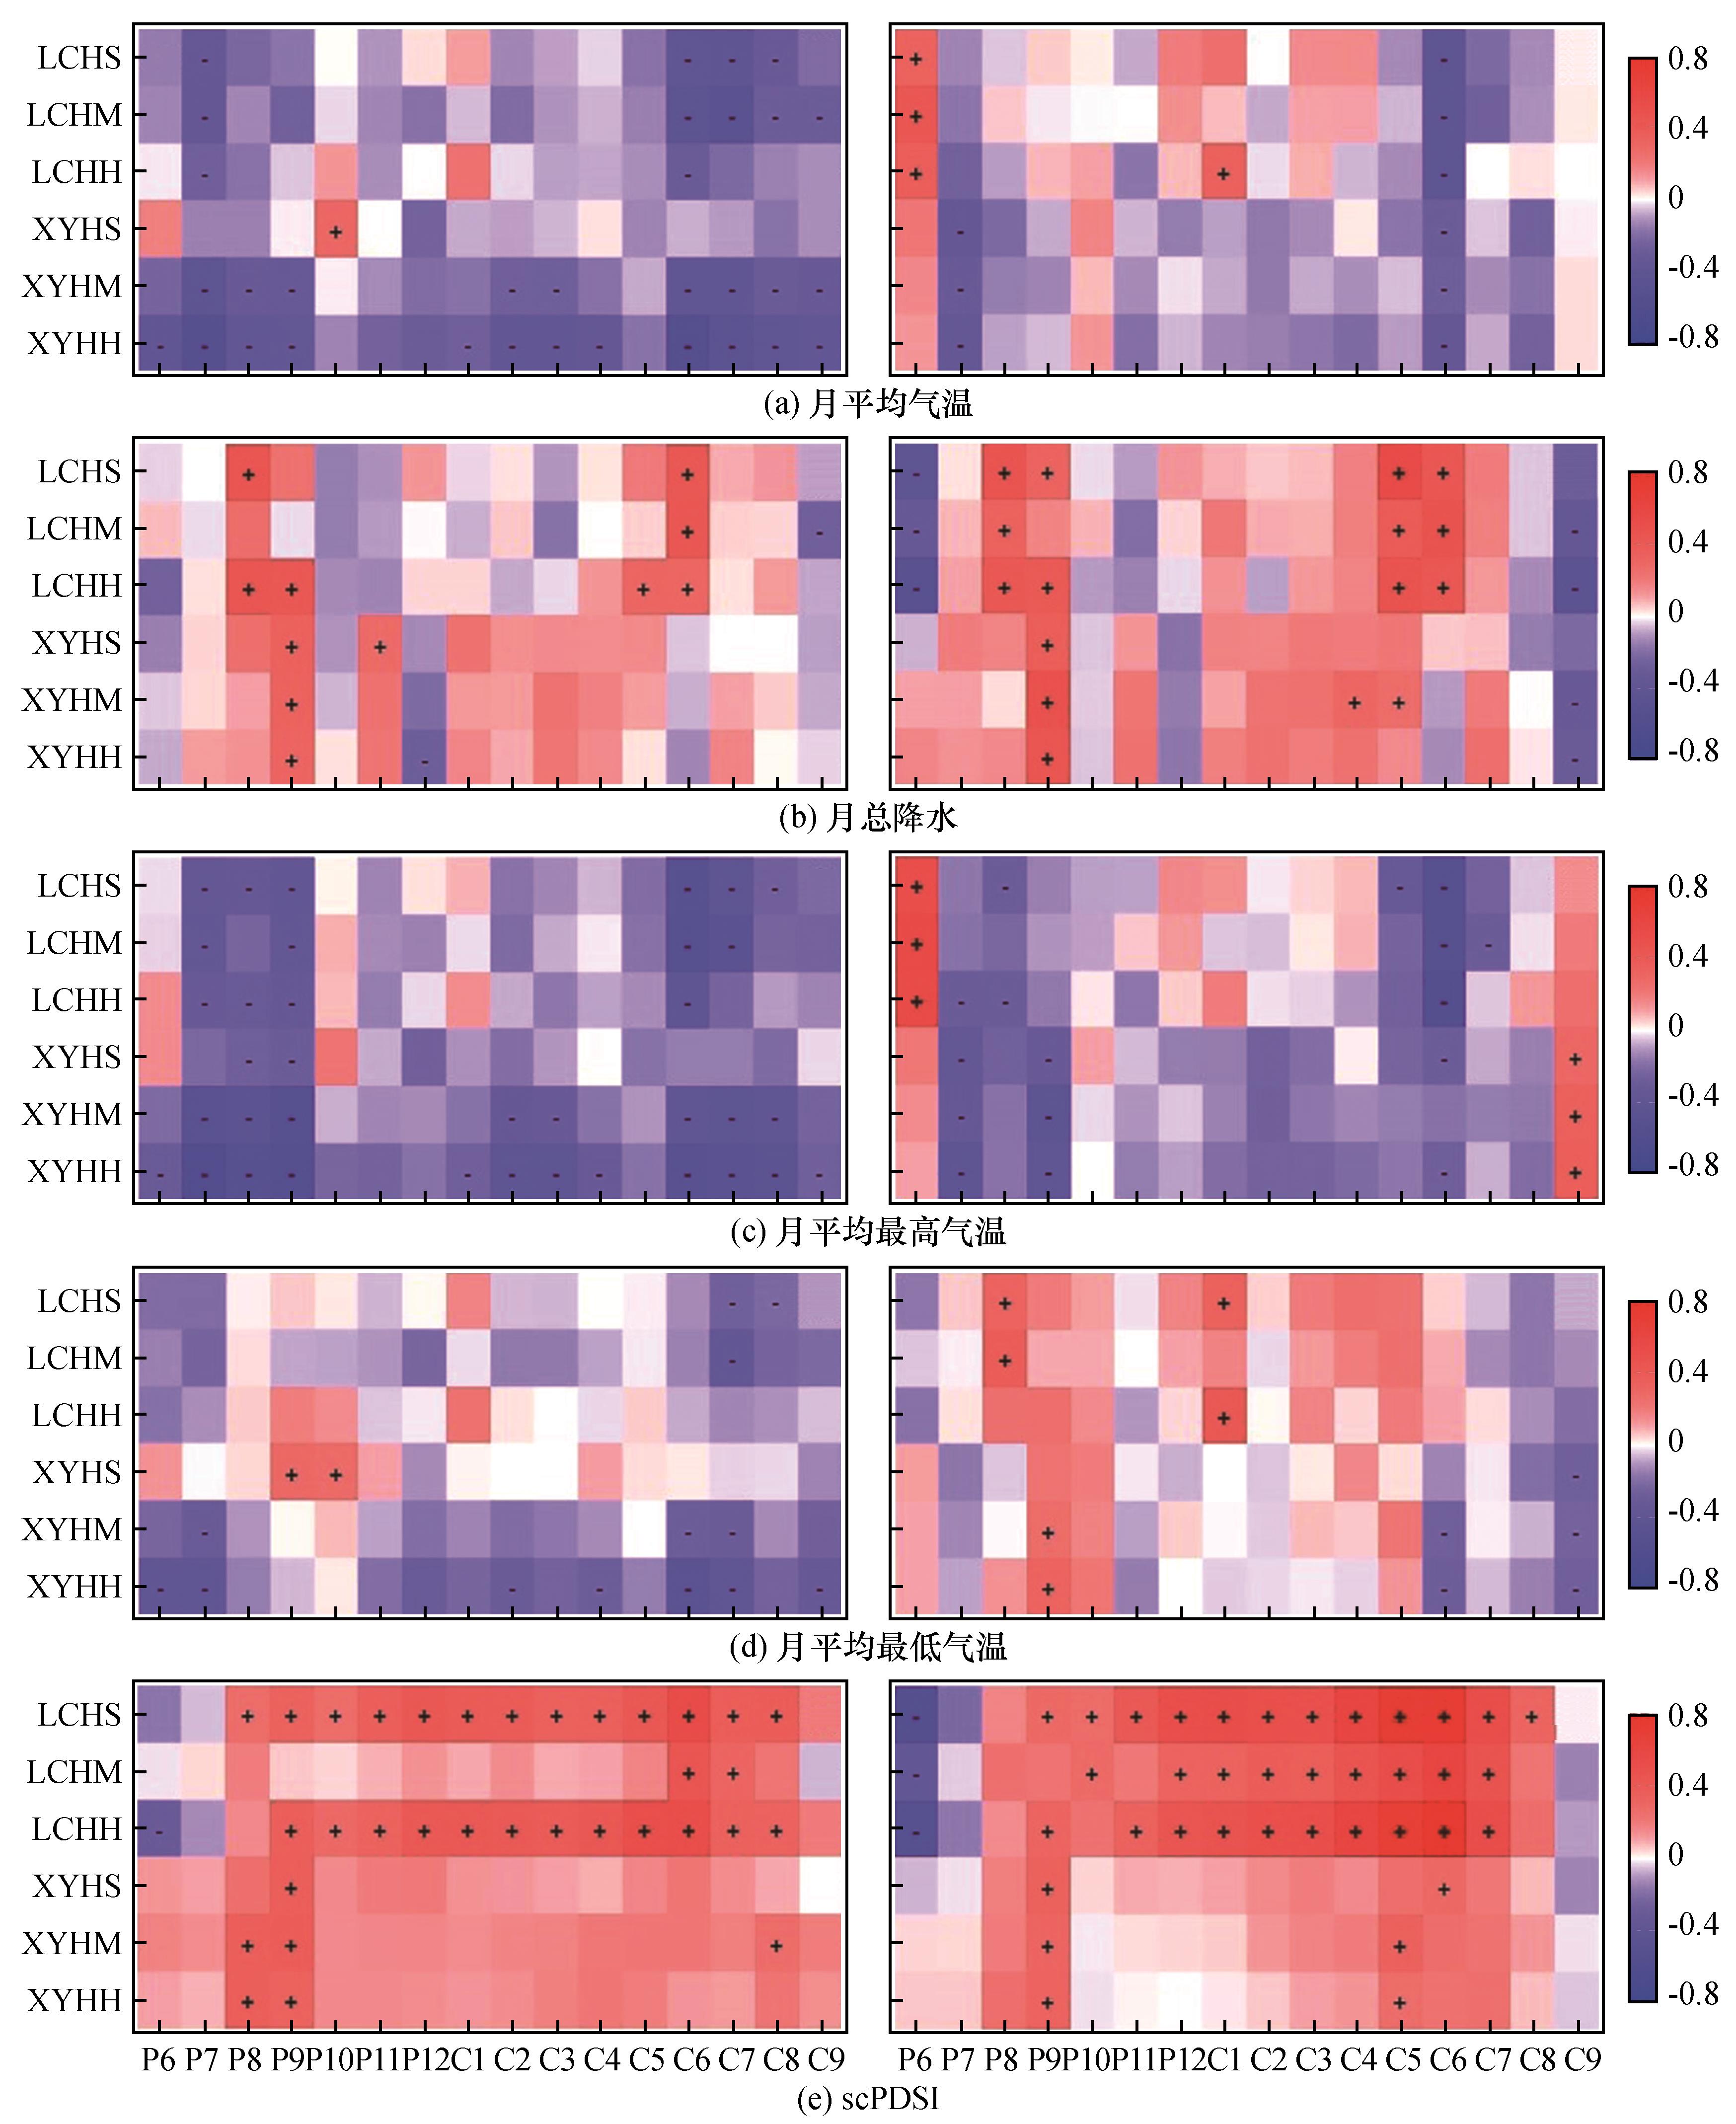
图5. STD年表与前一年6月至当年9月的月平均气温(a)、月总降水(b)、月平均最高气温(c)、月平均最低气温(d)和scPDSI(e)的相关分析(左)、一阶差相关分析(右),时间跨度为1959—2015年,P(Previous)表示前一年,C(Current)表示当年;右侧图例表示图中颜色所对应的相关系数值,红色越深表示正相关关系越强,蓝色越深表示负相关关系越强。“+”表示正相关超过95%的置信限,“-”表示负相关超过95%的置信限
Fig. 5. The correlation coefficients(left) and the first-order difference correlation coefficients(right)between the regional standard chronology and monthly mean temperature (a), monthly total precipitation (b), monthly meanmaximuntemperature (c), monthly mean minimum temperature (d) and scPDSI (e) from previous June to current September over the period1959—2015. P:previous year,C:current year. The different color represent the correlation value, the darker the red, the stronger the positive correlation, and the darker the blue, the stronger the negative correlation. The “+”(“-”)indicates that the positive(negative) correlation exceeds a 95% confidence limit