), 唐学远2, 张通3, 冷伟4, 艾松涛5, 刘成彦6, 王玉哲7, 刘岩1, 岳超1
), Xueyuan TANG2, Tong ZHANG3, Wei LENG4, Songtao AI5, Chengyan LIU6, Yuzhe WANG7, Yan LIU1, Chao YUE1
), 唐学远2, 张通3, 冷伟4, 艾松涛5, 刘成彦6, 王玉哲7, 刘岩1, 岳超1
), Xueyuan TANG2, Tong ZHANG3, Wei LENG4, Songtao AI5, Chengyan LIU6, Yuzhe WANG7, Yan LIU1, Chao YUE1
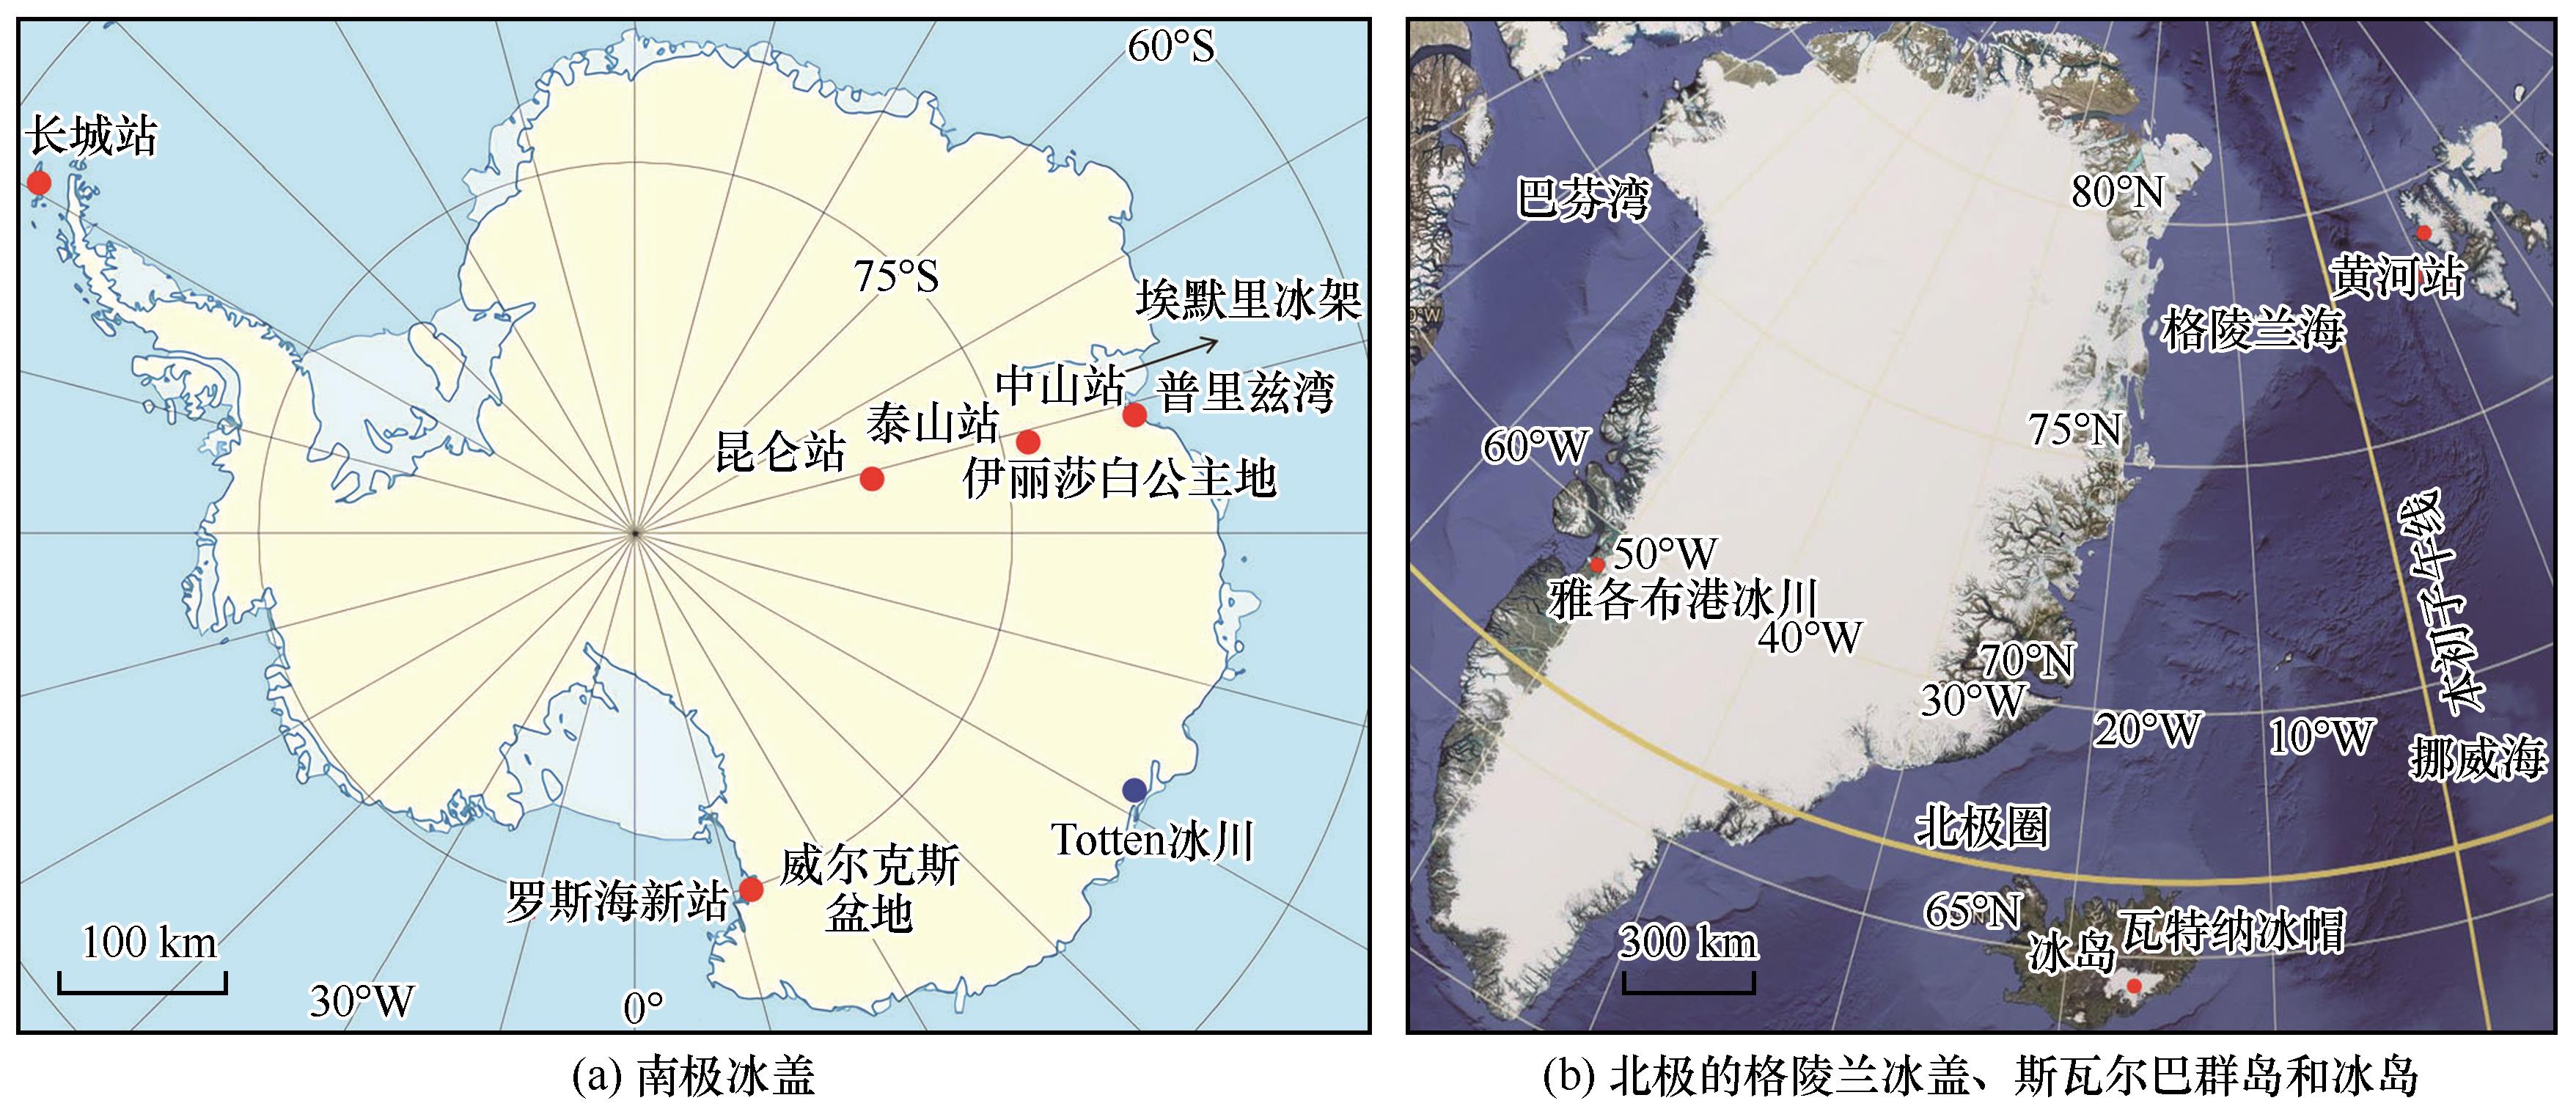
图1. 南极冰盖(a);北极的格陵兰冰盖、斯瓦尔巴群岛和冰岛(b)[在图中标注了我国建立的台站(长城站、中山站、昆仑站、泰山站、罗斯海新站、黄河站)以及本文提到的一些研究区域或冰川位置(威尔克斯盆地、伊丽莎白公主地、埃默里冰架、普利兹湾、Totten冰川、雅各布港冰川、瓦特纳冰帽)。Dome A与昆仑站非常近,Austre Lovénbreen冰川和Pedersenbreen冰川与黄河站距离非常近,不再标注]
Fig. 1. Antarctic Ice Sheet (a); Greenland Ice Sheet, Svalbard Islands and Iceland in the Arctic (b) [The stations established by China (Great Wall Station, Zhongshan Station, Kunlun Station, Taishan Station, Ross Sea New Station and Yellow River Station) and some study regions or glacier locations mentioned in this paper (Wilkes Basin, Princess Elizabeth Land, Amery ice shelf, Prydz Bay, Totten Glacier, Jakobshavn Glacier, Vatnaj?kull ice cap) are marked in the figure. Dome A, very close to Kunlun Station, Austre Lovénbreen Glacier and Pedersenbreen Glacier almost next to Yellow River Station, are not marked]