2000—2020年格陵兰冰盖夏季表面温度变化及其对物质平衡的影响
方振祥1,2( ), 王宁练1,2,3(), 李想1,2, 张玉杰1,2, 邰雪楠1,2
), 王宁练1,2,3(), 李想1,2, 张玉杰1,2, 邰雪楠1,2
Summer surface temperature change of Greenland Ice Sheet from 2000 to 2020 and its effect on mass balance
Zhenxiang FANG1,2(), Ninglian WANG1,2,3(), Xiang LI1,2, Yujie ZHANG1,2, Xuenan TAI1,2
), Ninglian WANG1,2,3(), Xiang LI1,2, Yujie ZHANG1,2, Xuenan TAI1,2
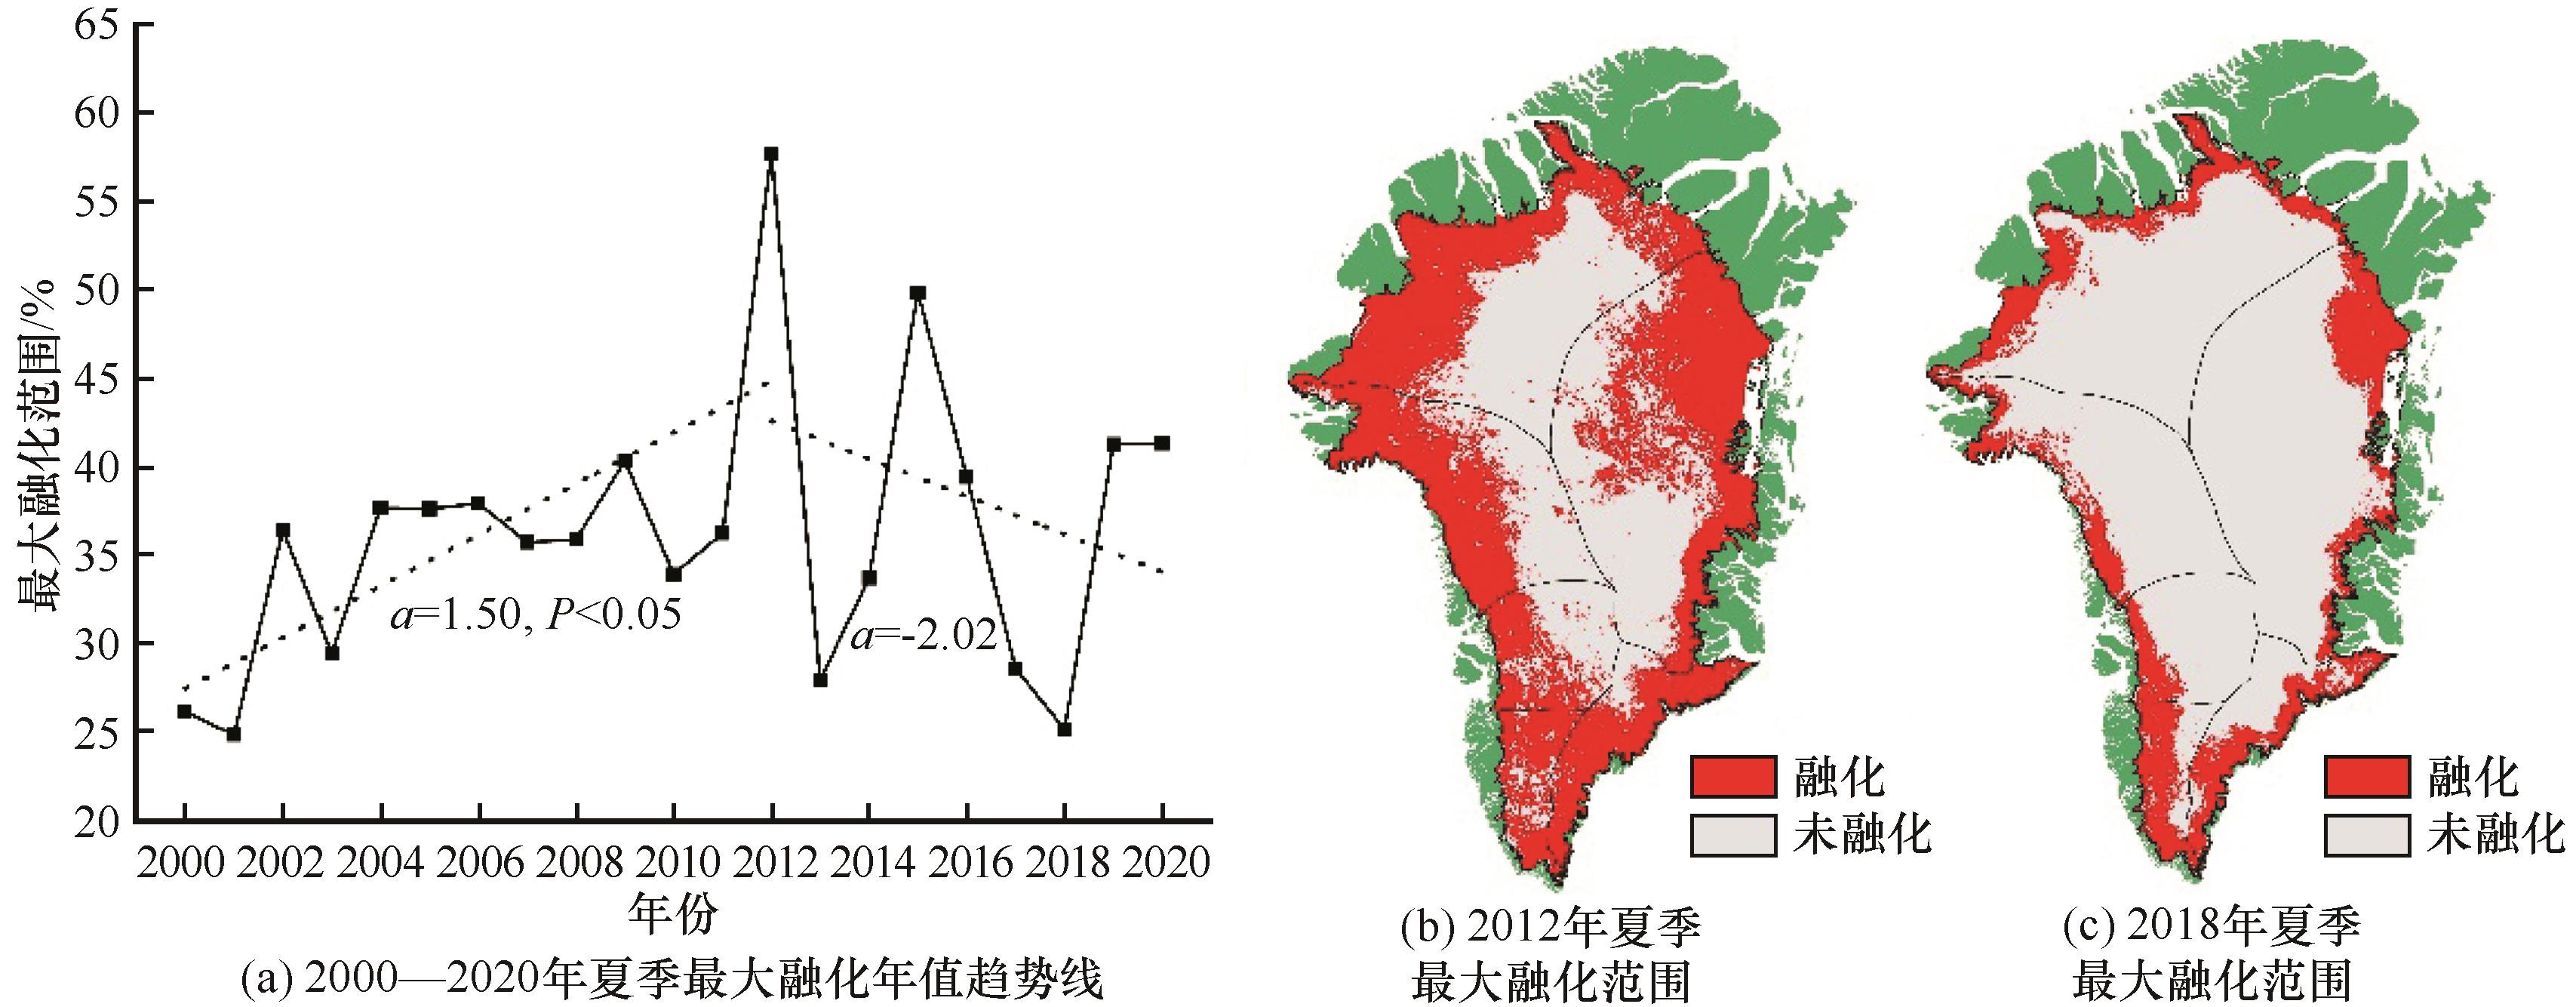
图6. 根据MODIS温度数据绘制得到:2000—2020年夏季最大融化年值趋势线(a);2012年夏季最大融化范围(b);2018年夏季最大融化范围(c)
Fig. 6. trend line of summer maximum annual melting from 2000 to 2020(a), maximum melting range in 2012 summer (b), and maximum melting range in 2018 summer (c), are plotted based on MODIS temperature data