基于Landsat-8影像的2018—2021年音苏盖提冰川表面流速监测
王凯( ), 孙永玲(), 孙世金, 刘晓
), 孙永玲(), 孙世金, 刘晓
Surface velocity monitoring of Skamri Glacier from 2018 to 2021 based on Landsat-8 images
Kai WANG(), Yongling SUN(), Shijin SUN, Xiao LIU
), Yongling SUN(), Shijin SUN, Xiao LIU
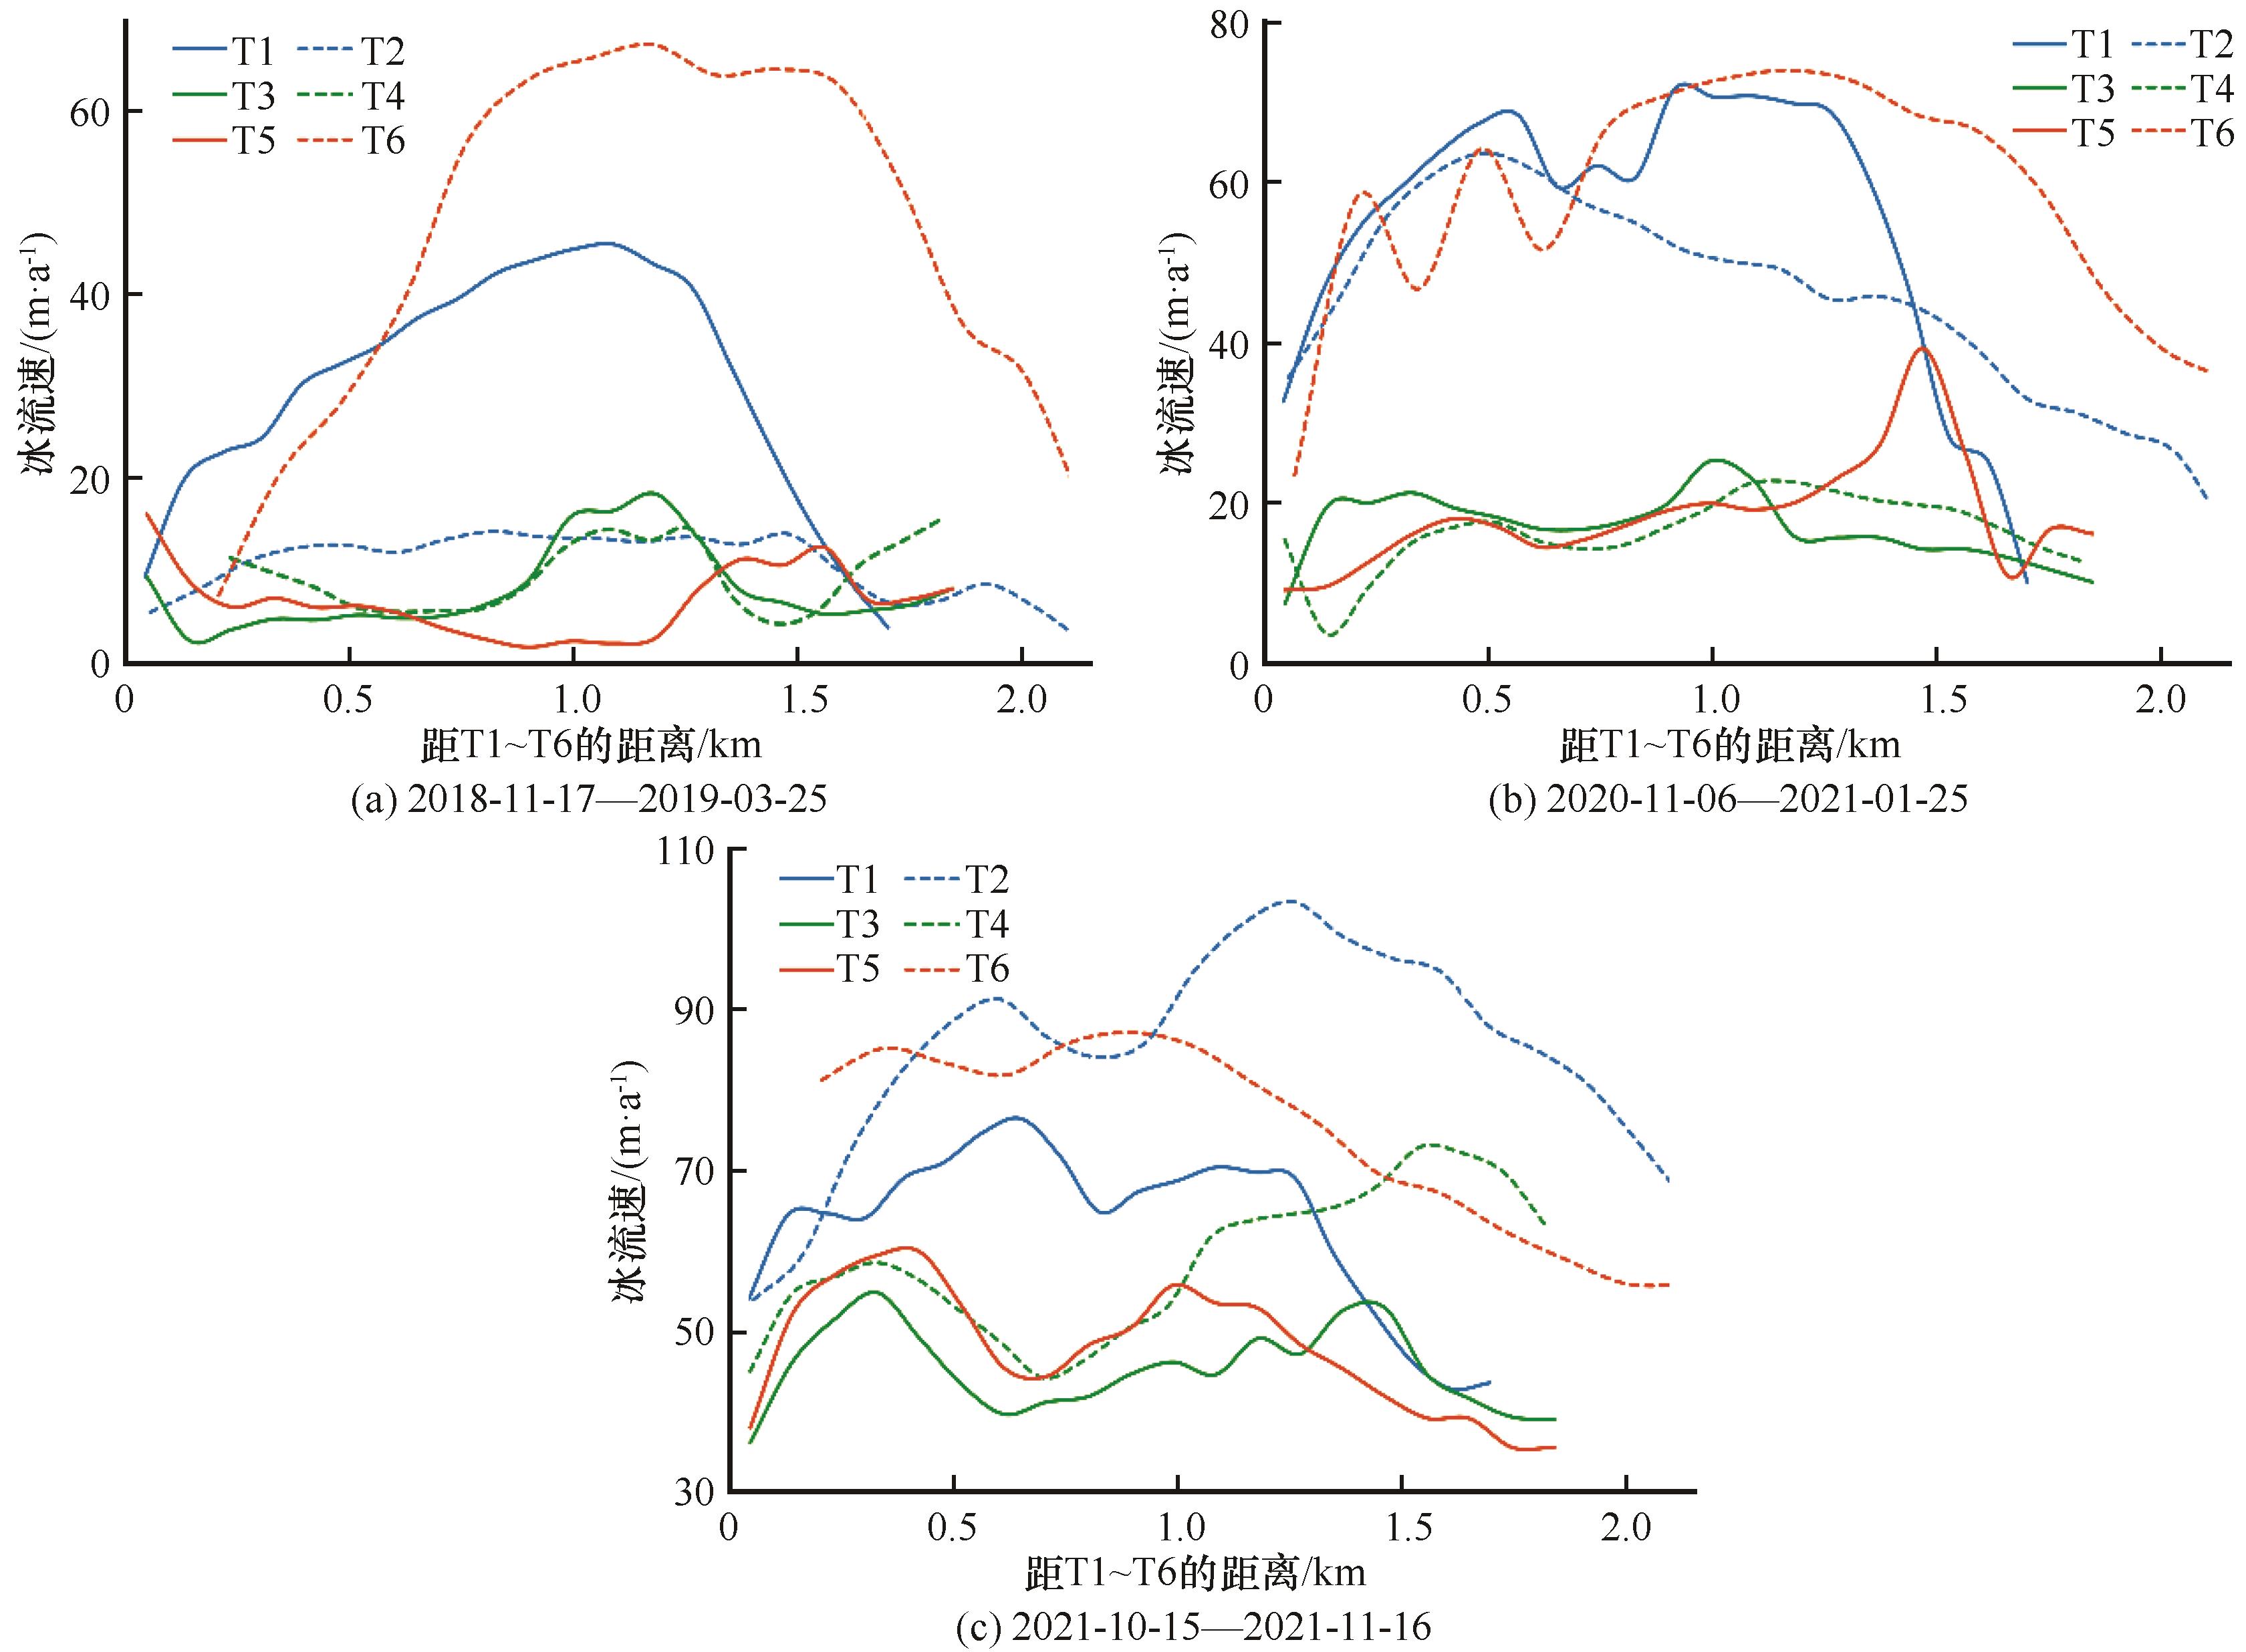
图9. 音苏盖提冰川主冰川横剖面线图,流速为2018年11月—2019年3月(a)、2020年11月—2021年11月(b)、2021年10月—2021年11月(c),T1、T2、T3、T4、T5和T6横剖面线位置见图1
Fig. 9. The cross-sectional diagram of Skamri main glacier shows the annual average velocity from November 2018 to March 2019 (a), from November 2020 to November 2021 (b), and from October 2021 to November 2021 (c). The positions of T1, T2, T3, T4, T5 and T6 cross-sectional lines are shown in Fig. 1