1979—2020年天山地区积雪量估算及其特征分析
朱淑珍1,2,3( ), 黄法融1,2,4,5, 冯挺1,2,3, 赵鑫6, 李兰海1,2,3,4,5()
), 黄法融1,2,4,5, 冯挺1,2,3, 赵鑫6, 李兰海1,2,3,4,5()
Estimation of snow mass and its distribution characteristics from 1979 to 2020 in Tianshan Mountains, China
Shuzhen ZHU1,2,3(), Farong HUANG1,2,4,5, Ting FENG1,2,3, Xin ZHAO6, Lanhai LI1,2,3,4,5()
), Farong HUANG1,2,4,5, Ting FENG1,2,3, Xin ZHAO6, Lanhai LI1,2,3,4,5()
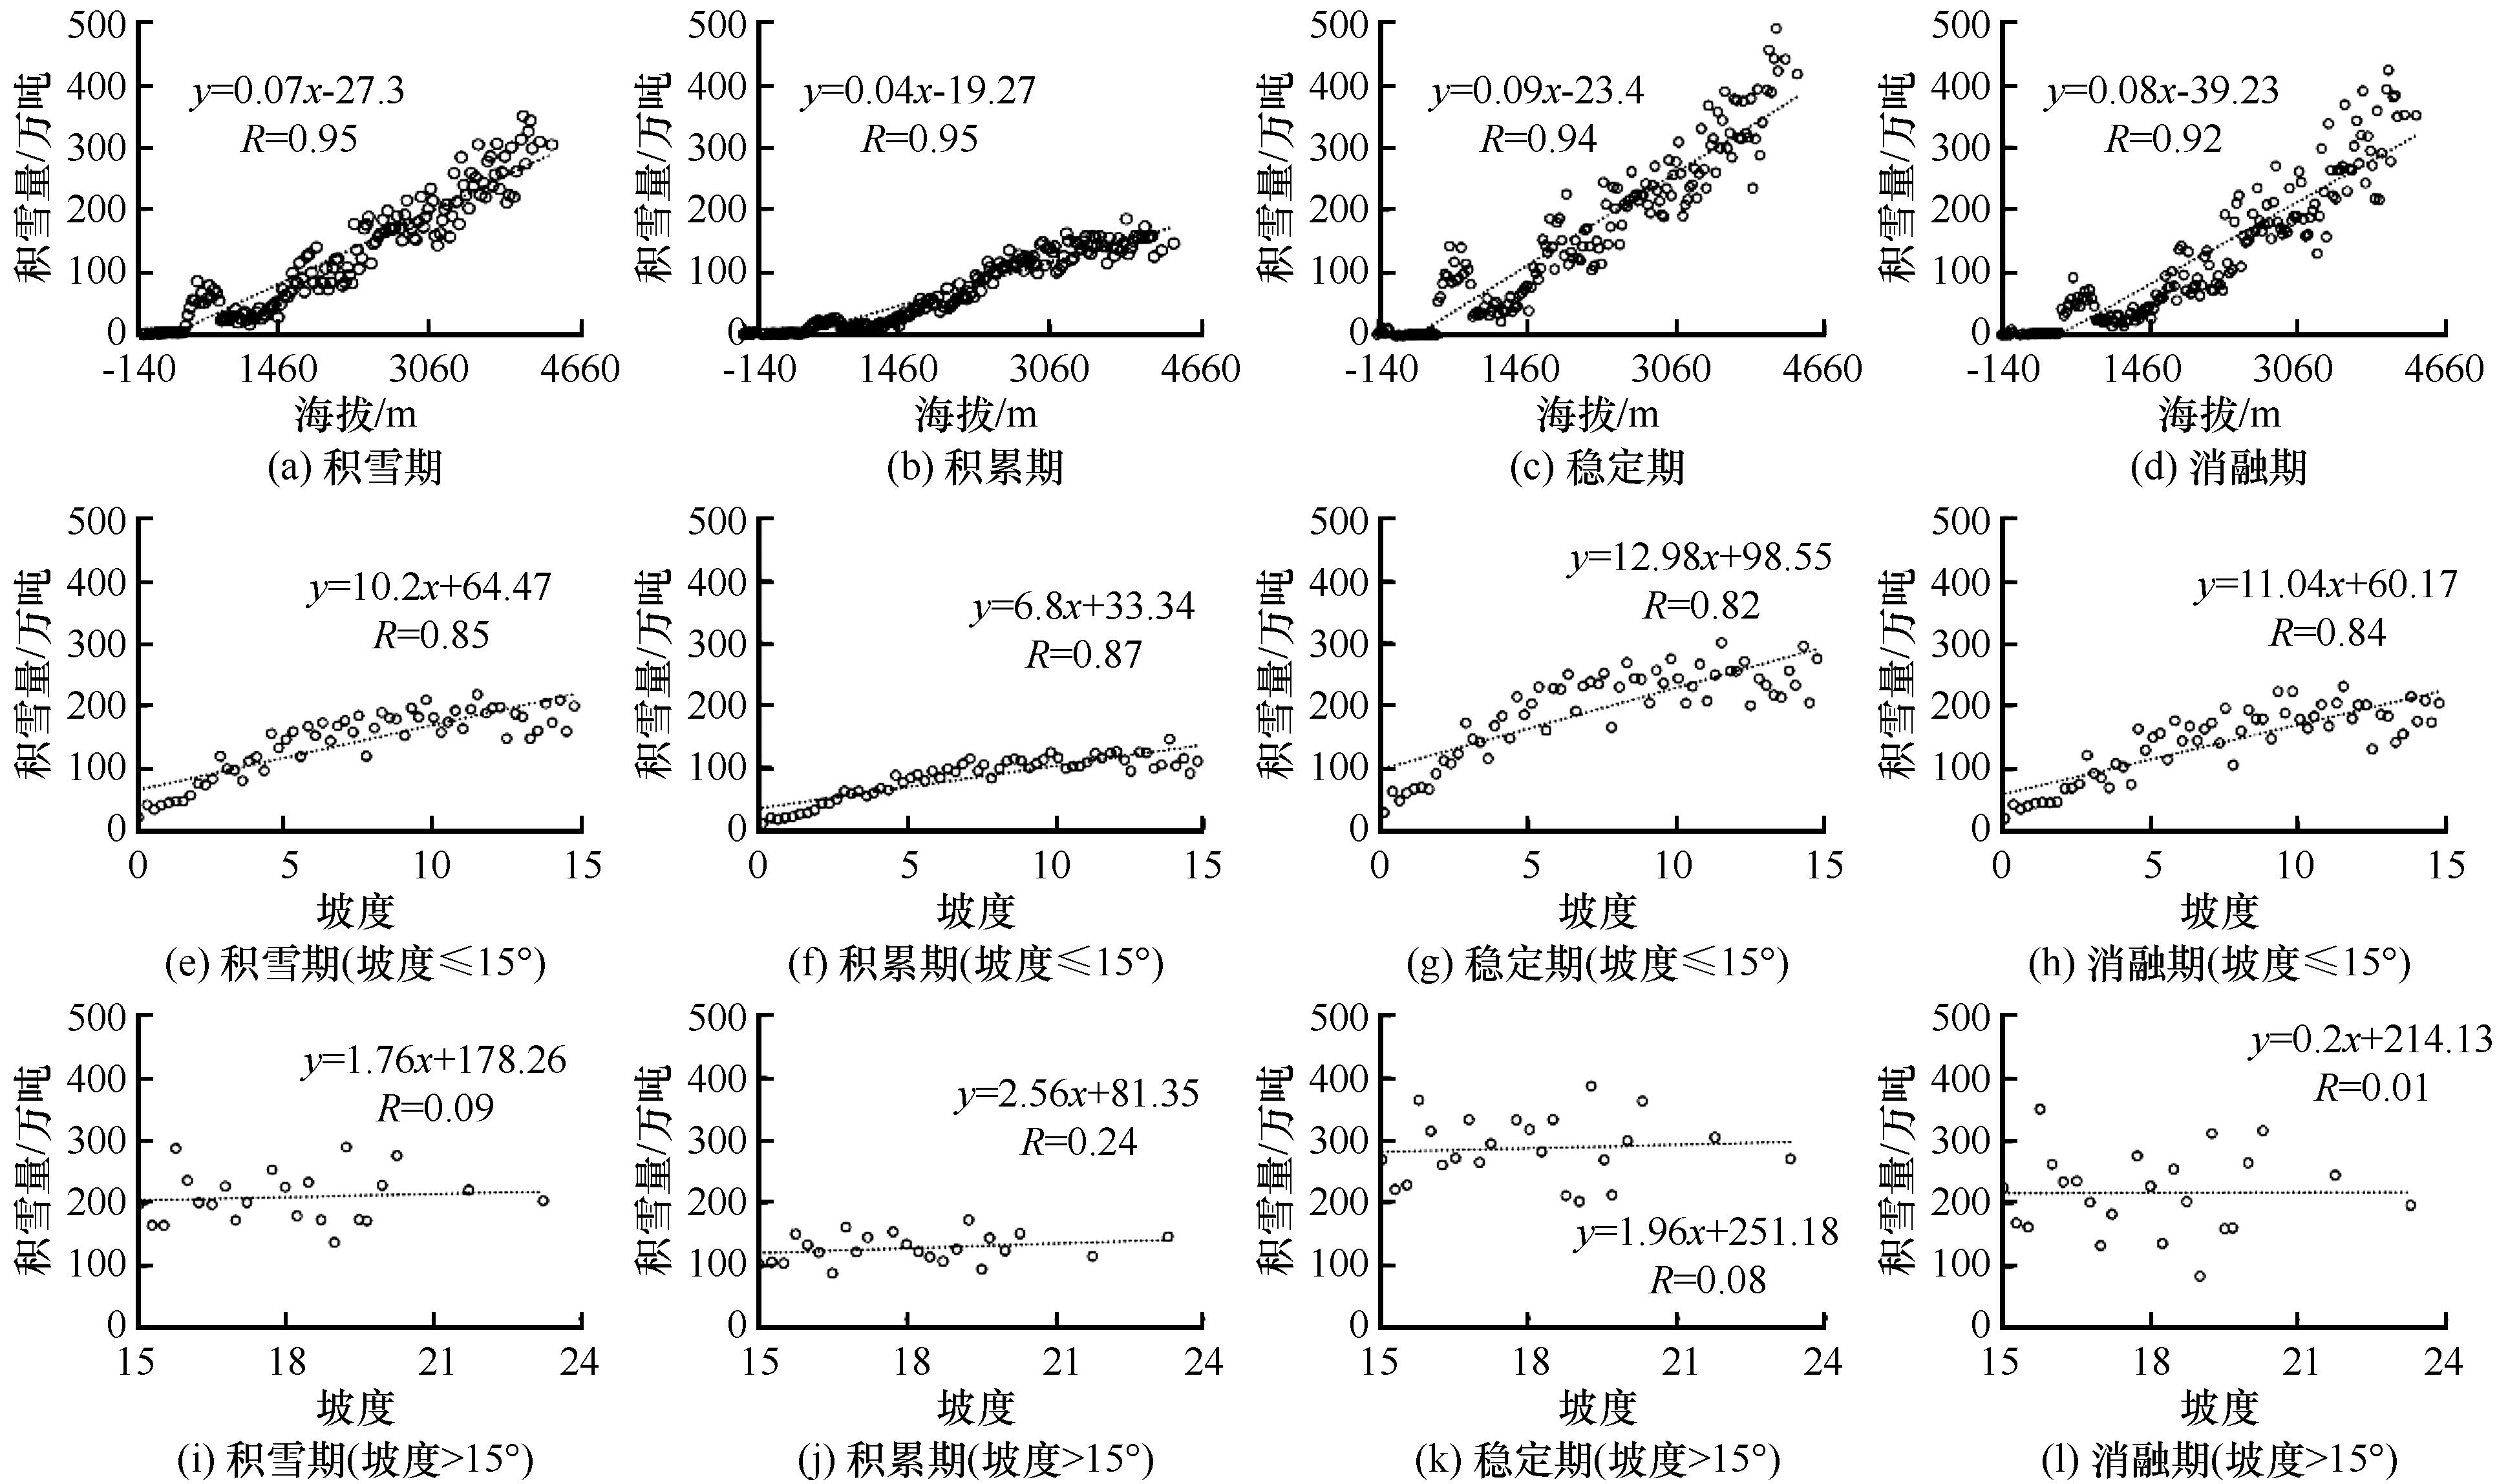
图12. 区域积雪量与海拔、坡度相关性
Fig. 12. Correlation analysis of snow mass amount with altitude and slope