基于10Be暴露年代的北美洲晚第四纪冰川演化序列研究
|
|
刘亮, 翟羿杰, 张威, 初智豪
|
Late Quaternary glaciations in North America based on 10Be exposure ages
|
|
Liang LIU, Yijie ZHAI, Wei ZHANG, Zhihao CHU
|
|
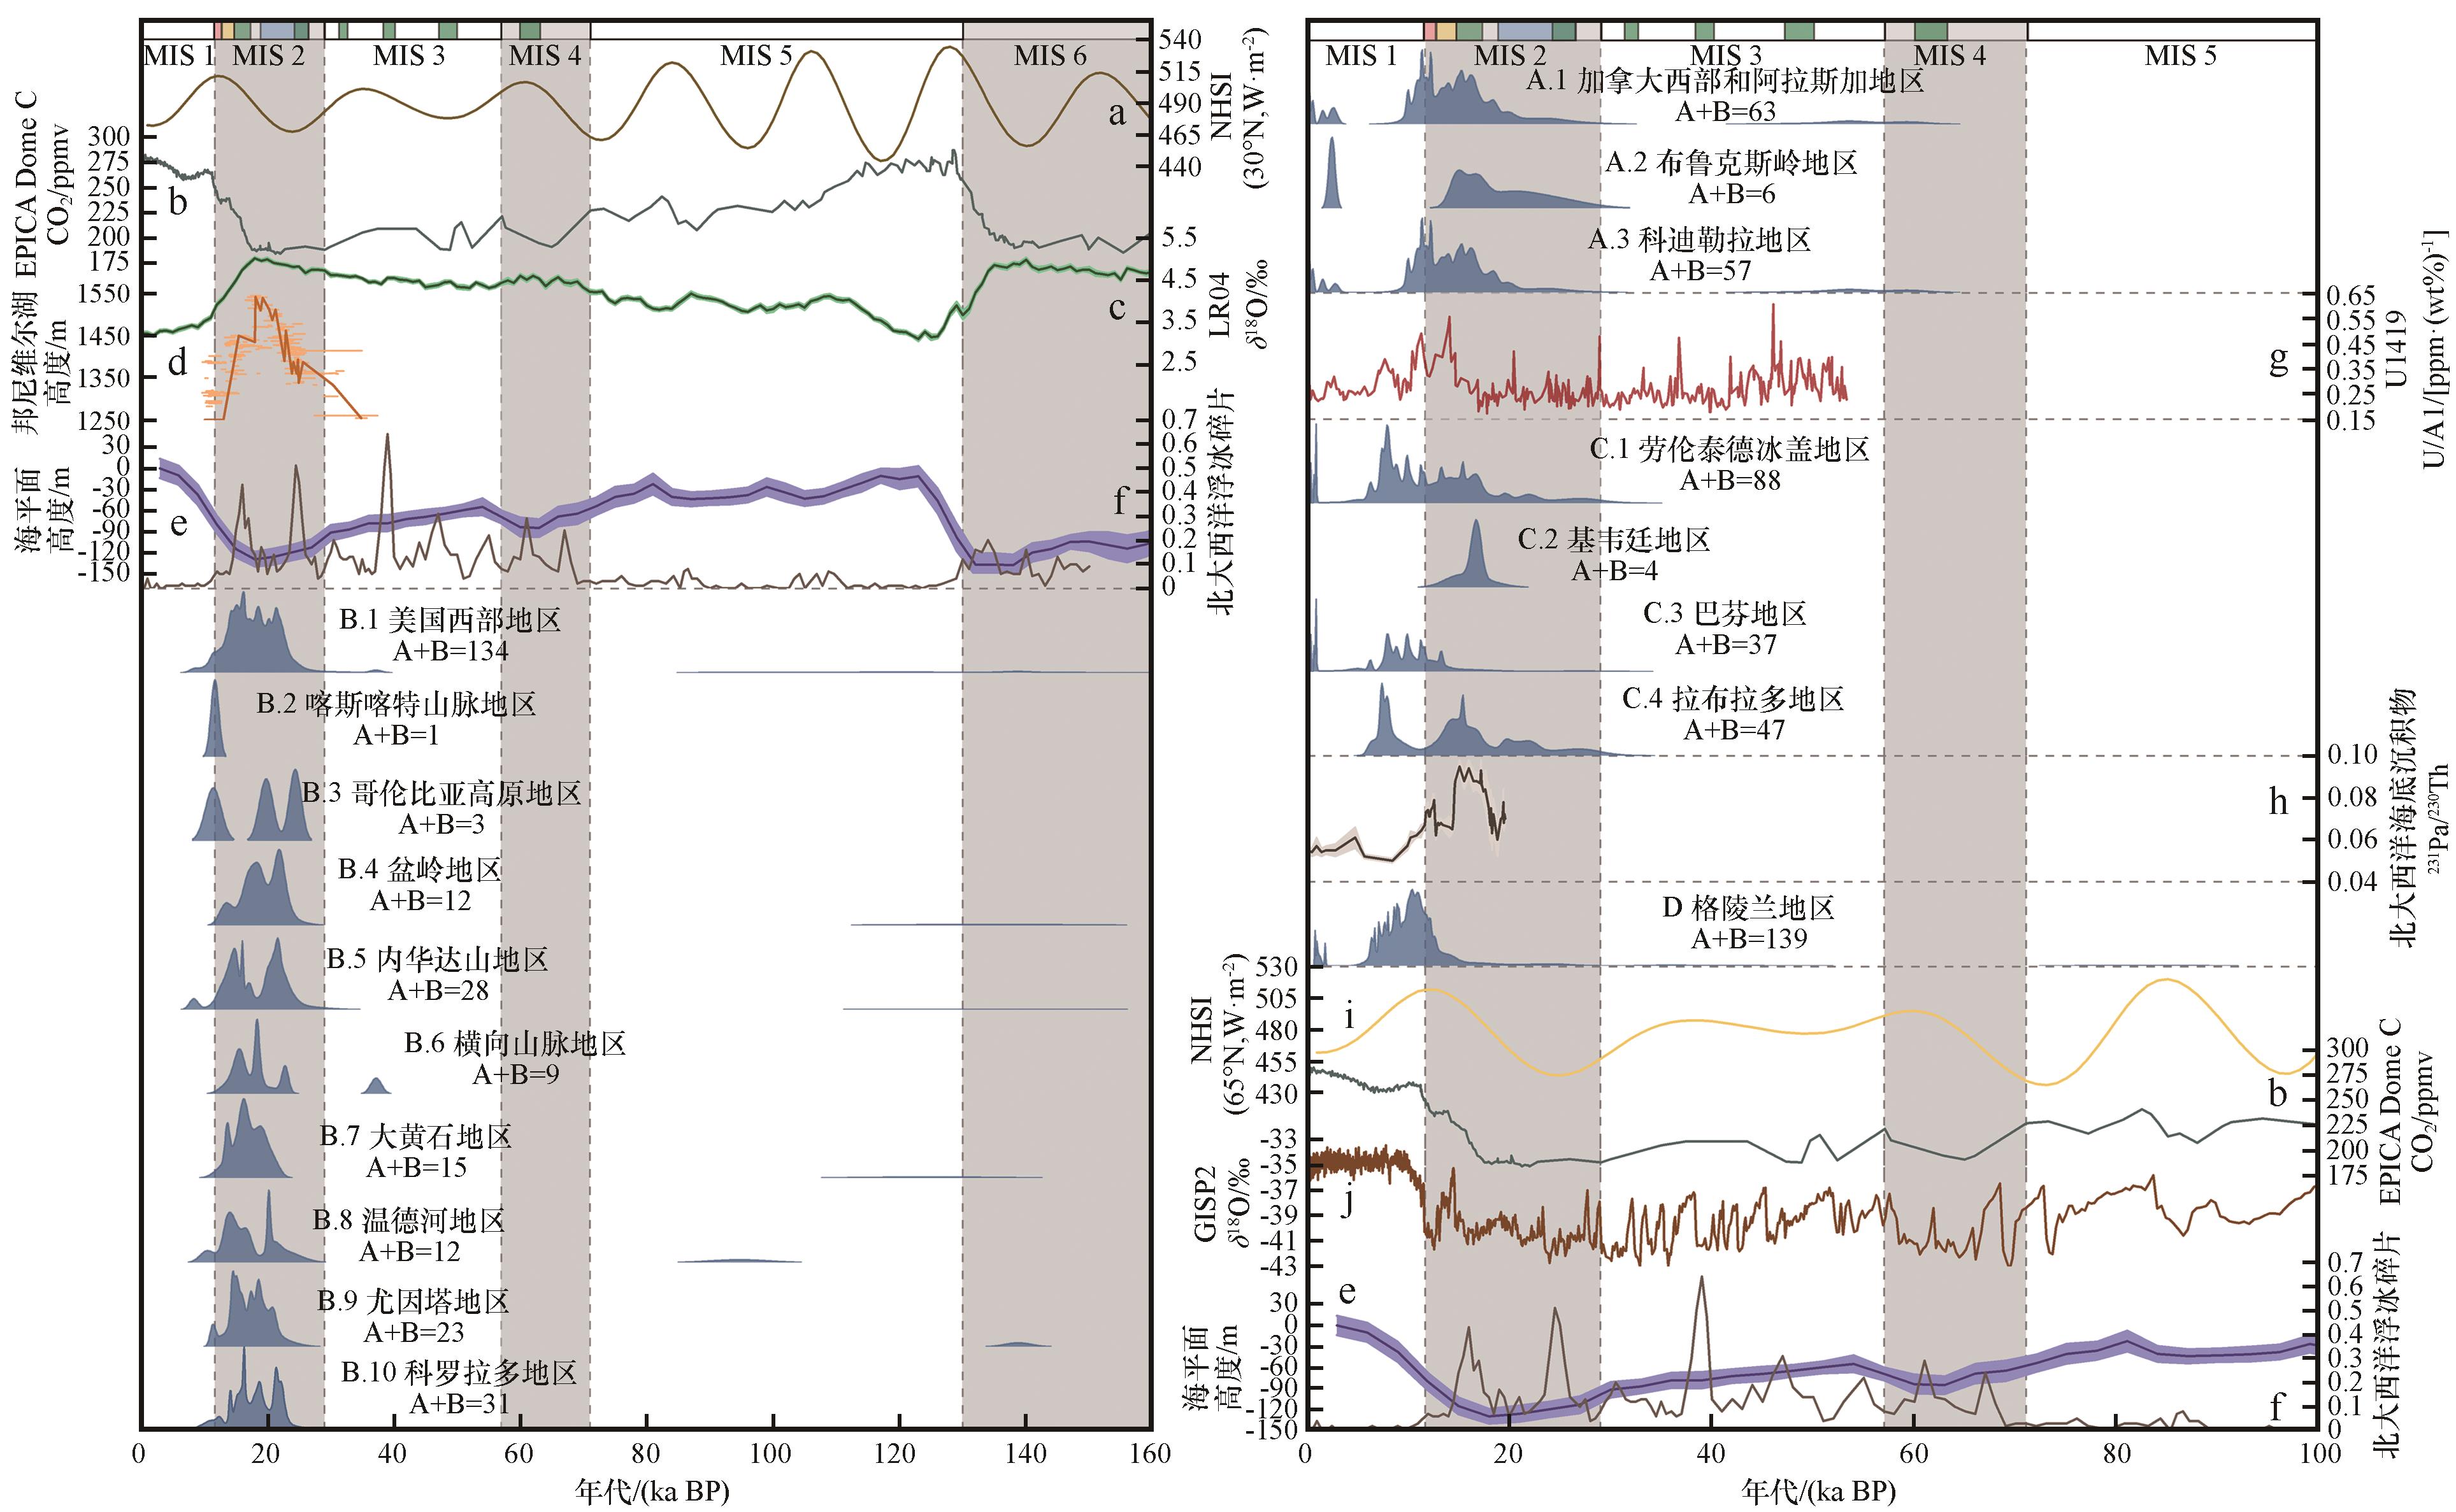
图2 北美洲分区A+B暴露年代概率密度图
注:左图包括美国西部数据,冰期序列横跨MIS 6~1, 右图包括加拿大西部和阿拉斯加、劳伦泰德冰盖地区、格陵兰数据, 冰期序列横跨MIS 5~1, 左右两图合起来是一张图, 只是右图的时间序列比左图短; 在图的上部, 粉红色条块代表YD事件 (11.7~12.9 ka, 划分参考了文献[79]), 黄色条块代表B-A事件(12.9~14.6 ka, 划分参考了文献[79]), 绿色条块代表HS事件(HS1: 14.6~17.5 ka, 划分参考了文献[80-81]), 蓝色条块代表LGM时期 (19.0~26.5 ka, 划分参考了文献[71]), 深海氧同位素阶段划分参考了文献[2]; 古气候替代记录包含: a. 30°N的夏季日照辐射[82], b. EPICA Dome C 冰芯[83], c. LR04海洋底栖有孔虫中的δ18O[2], d. 邦尼维尔湖高度[53], e. 海平面高度[84], f. 北大西洋浮冰碎片[85], g. 阿拉斯加海底沉积物钻孔U1419[86], h. 北大西洋海底沉积物钻孔OCE326-GGC5[87], i. 65°N的夏季日照辐射[82], j. GISP2冰芯[88]
|
Fig. 2 Probability density plots of the class A and B 10Be exposure ages for each of the eighteen regions (The left figure includes data of western United States, and the glaciation sequence spans MIS 6~1, and the right figure includes data of western Canada and Alaska, the Laurentide Ice Sheet region and Greenland, and the glaciation sequence spans MIS 5~1, and the left and right figures are combined into one figure, but the time series of the right figure is shorter than that of the left figure; In the upper part of the figure, pink bars represent YD event (11.7~12.9 ka, the division refers to Reference [79]), yellow bars represent B-A event (12.9~14.6 ka, the division refers to Reference [79]), green bars represent HS events (HS1: 14.6~17.5 ka, the division refers to Reference [80-81]), blue bars represent the LGM (19.0~26.5 ka, the division refers to Reference [71]), and marine isotope stages division refers to Reference [2]; Paleoclimate proxy records contains: a. summer insolation at 30° N[82], b. EPICA Dome C ice core[83], c. LR04 series of marine δ18O in benthic foraminifers[2], d. Lake Bonneville altitudes[53], e. global sea level reconstruction[84], f. North Atlantic ice-rafted debris stack[85], g. Alaska deep-sea sediment core U1419[86], h. North Atlantic deep-sea sediment core OCE326-GGC5[87], i. summer insolation at 65° N[82], j. GISP2 ice core[88])
|
|
|
|
|