2014—2020年科其喀尔巴西冰川运动速度年际与季节变化特征分析
Interannual and seasonal variation of flow velocity in Koxkar Baxi Glacier from 2014 to 2020
2014—2020年科其喀尔巴西冰川运动速度年际与季节变化特征分析 |
| 赵晋彪, 张震, 许杨杨, 王荣军, 蒋宗立 |
|
Interannual and seasonal variation of flow velocity in Koxkar Baxi Glacier from 2014 to 2020 |
| Jinbiao ZHAO, Zhen ZHANG, Yangyang XU, Rongjun WANG, Zongli JIANG |
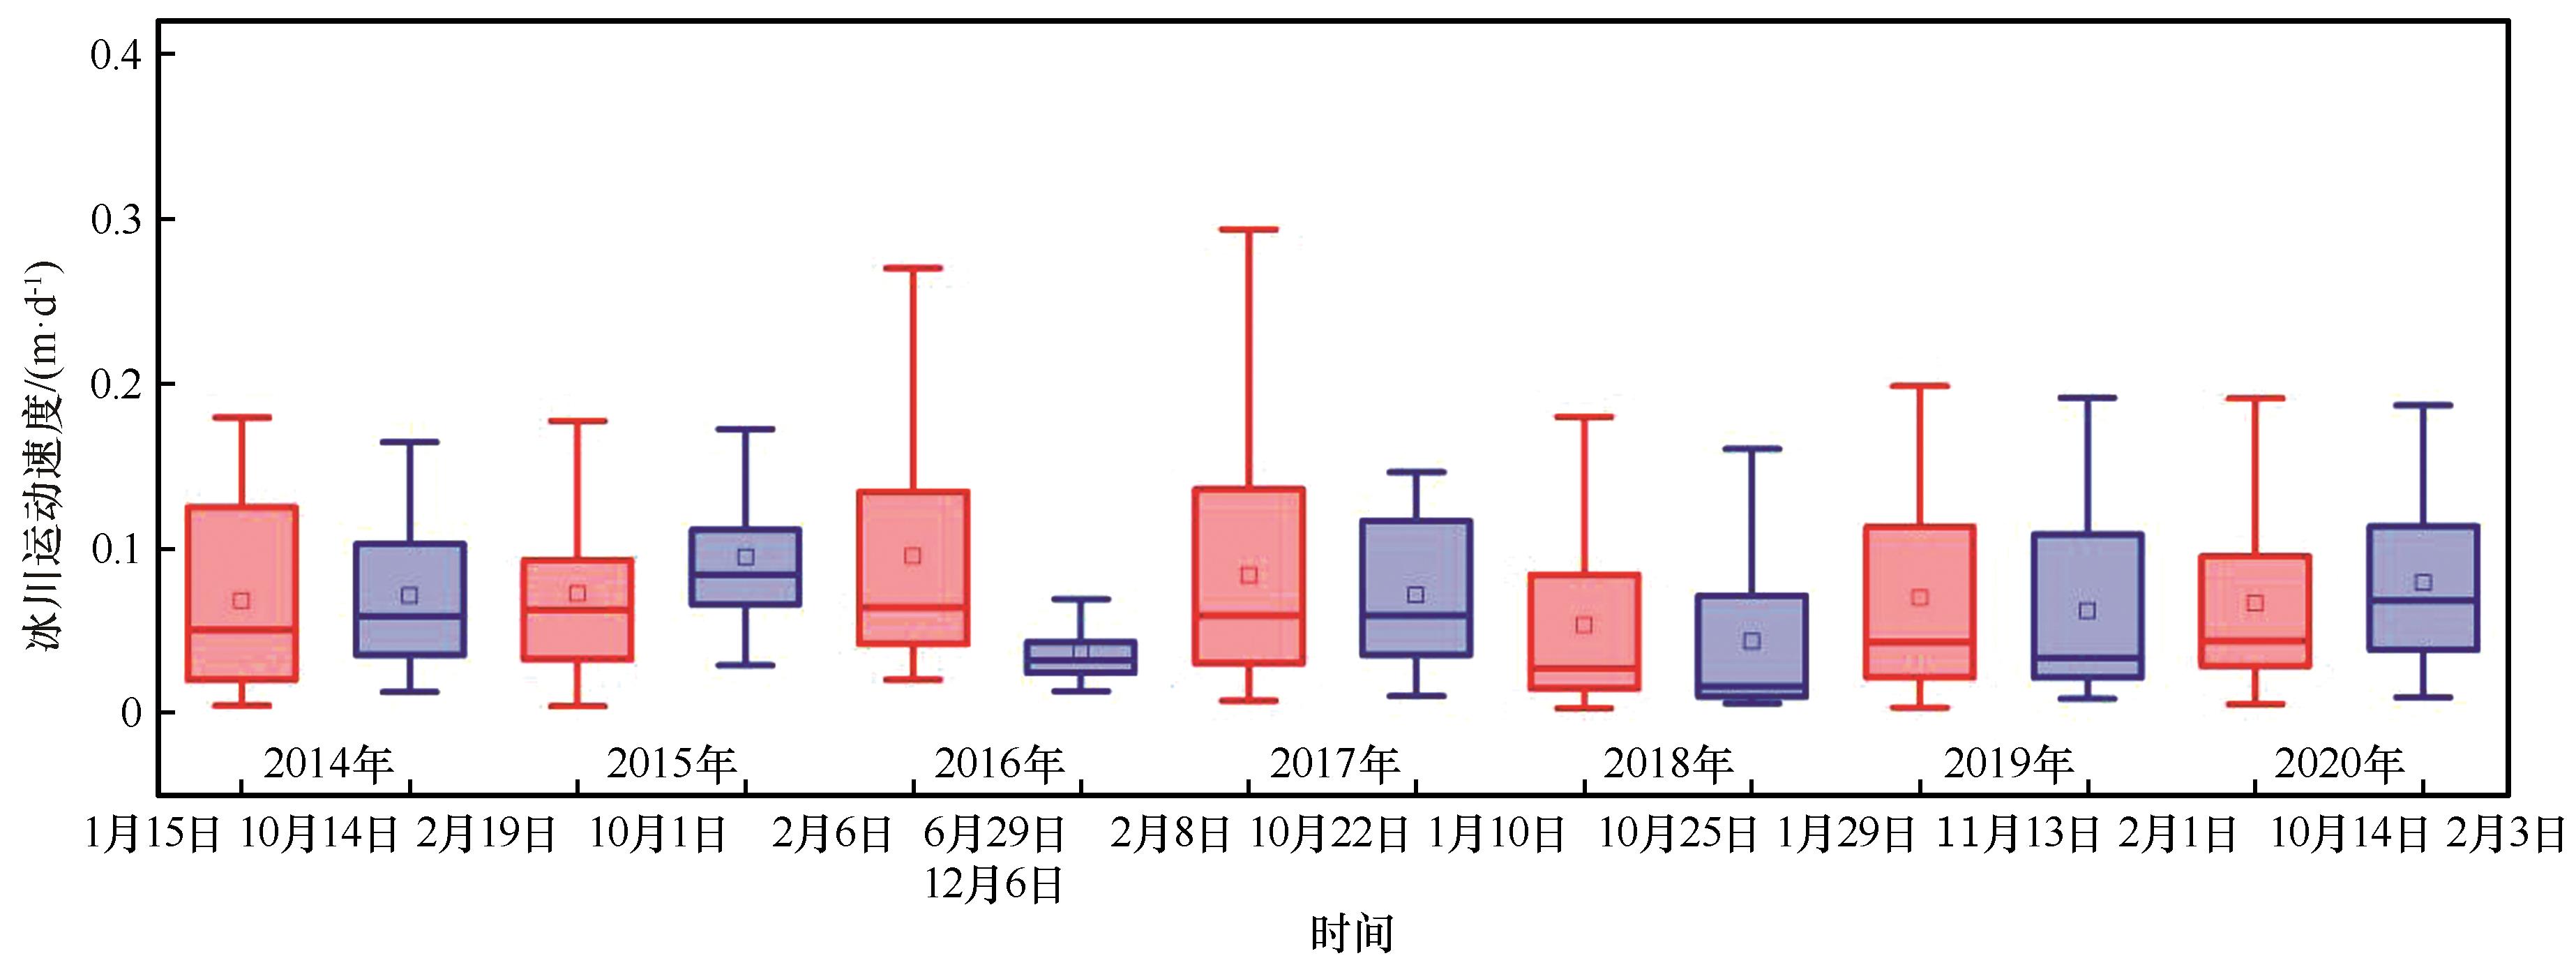
| 图5 沿中流线季节运动速度箱线图 |
| Fig. 5 Box diagram of seasonal velocity along the center line |
|
|