2000年前后我国寒潮活动特征的比较分析
Comparative analysis of the cold surge characteristics over China before and after 2000
2000年前后我国寒潮活动特征的比较分析 |
| 马力, 韦志刚, 李娴茹, 王欢, 郭仕侗 |
|
Comparative analysis of the cold surge characteristics over China before and after 2000 |
| Li MA, Zhigang WEI, Xianru LI, Huan WANG, Shitong GUO |
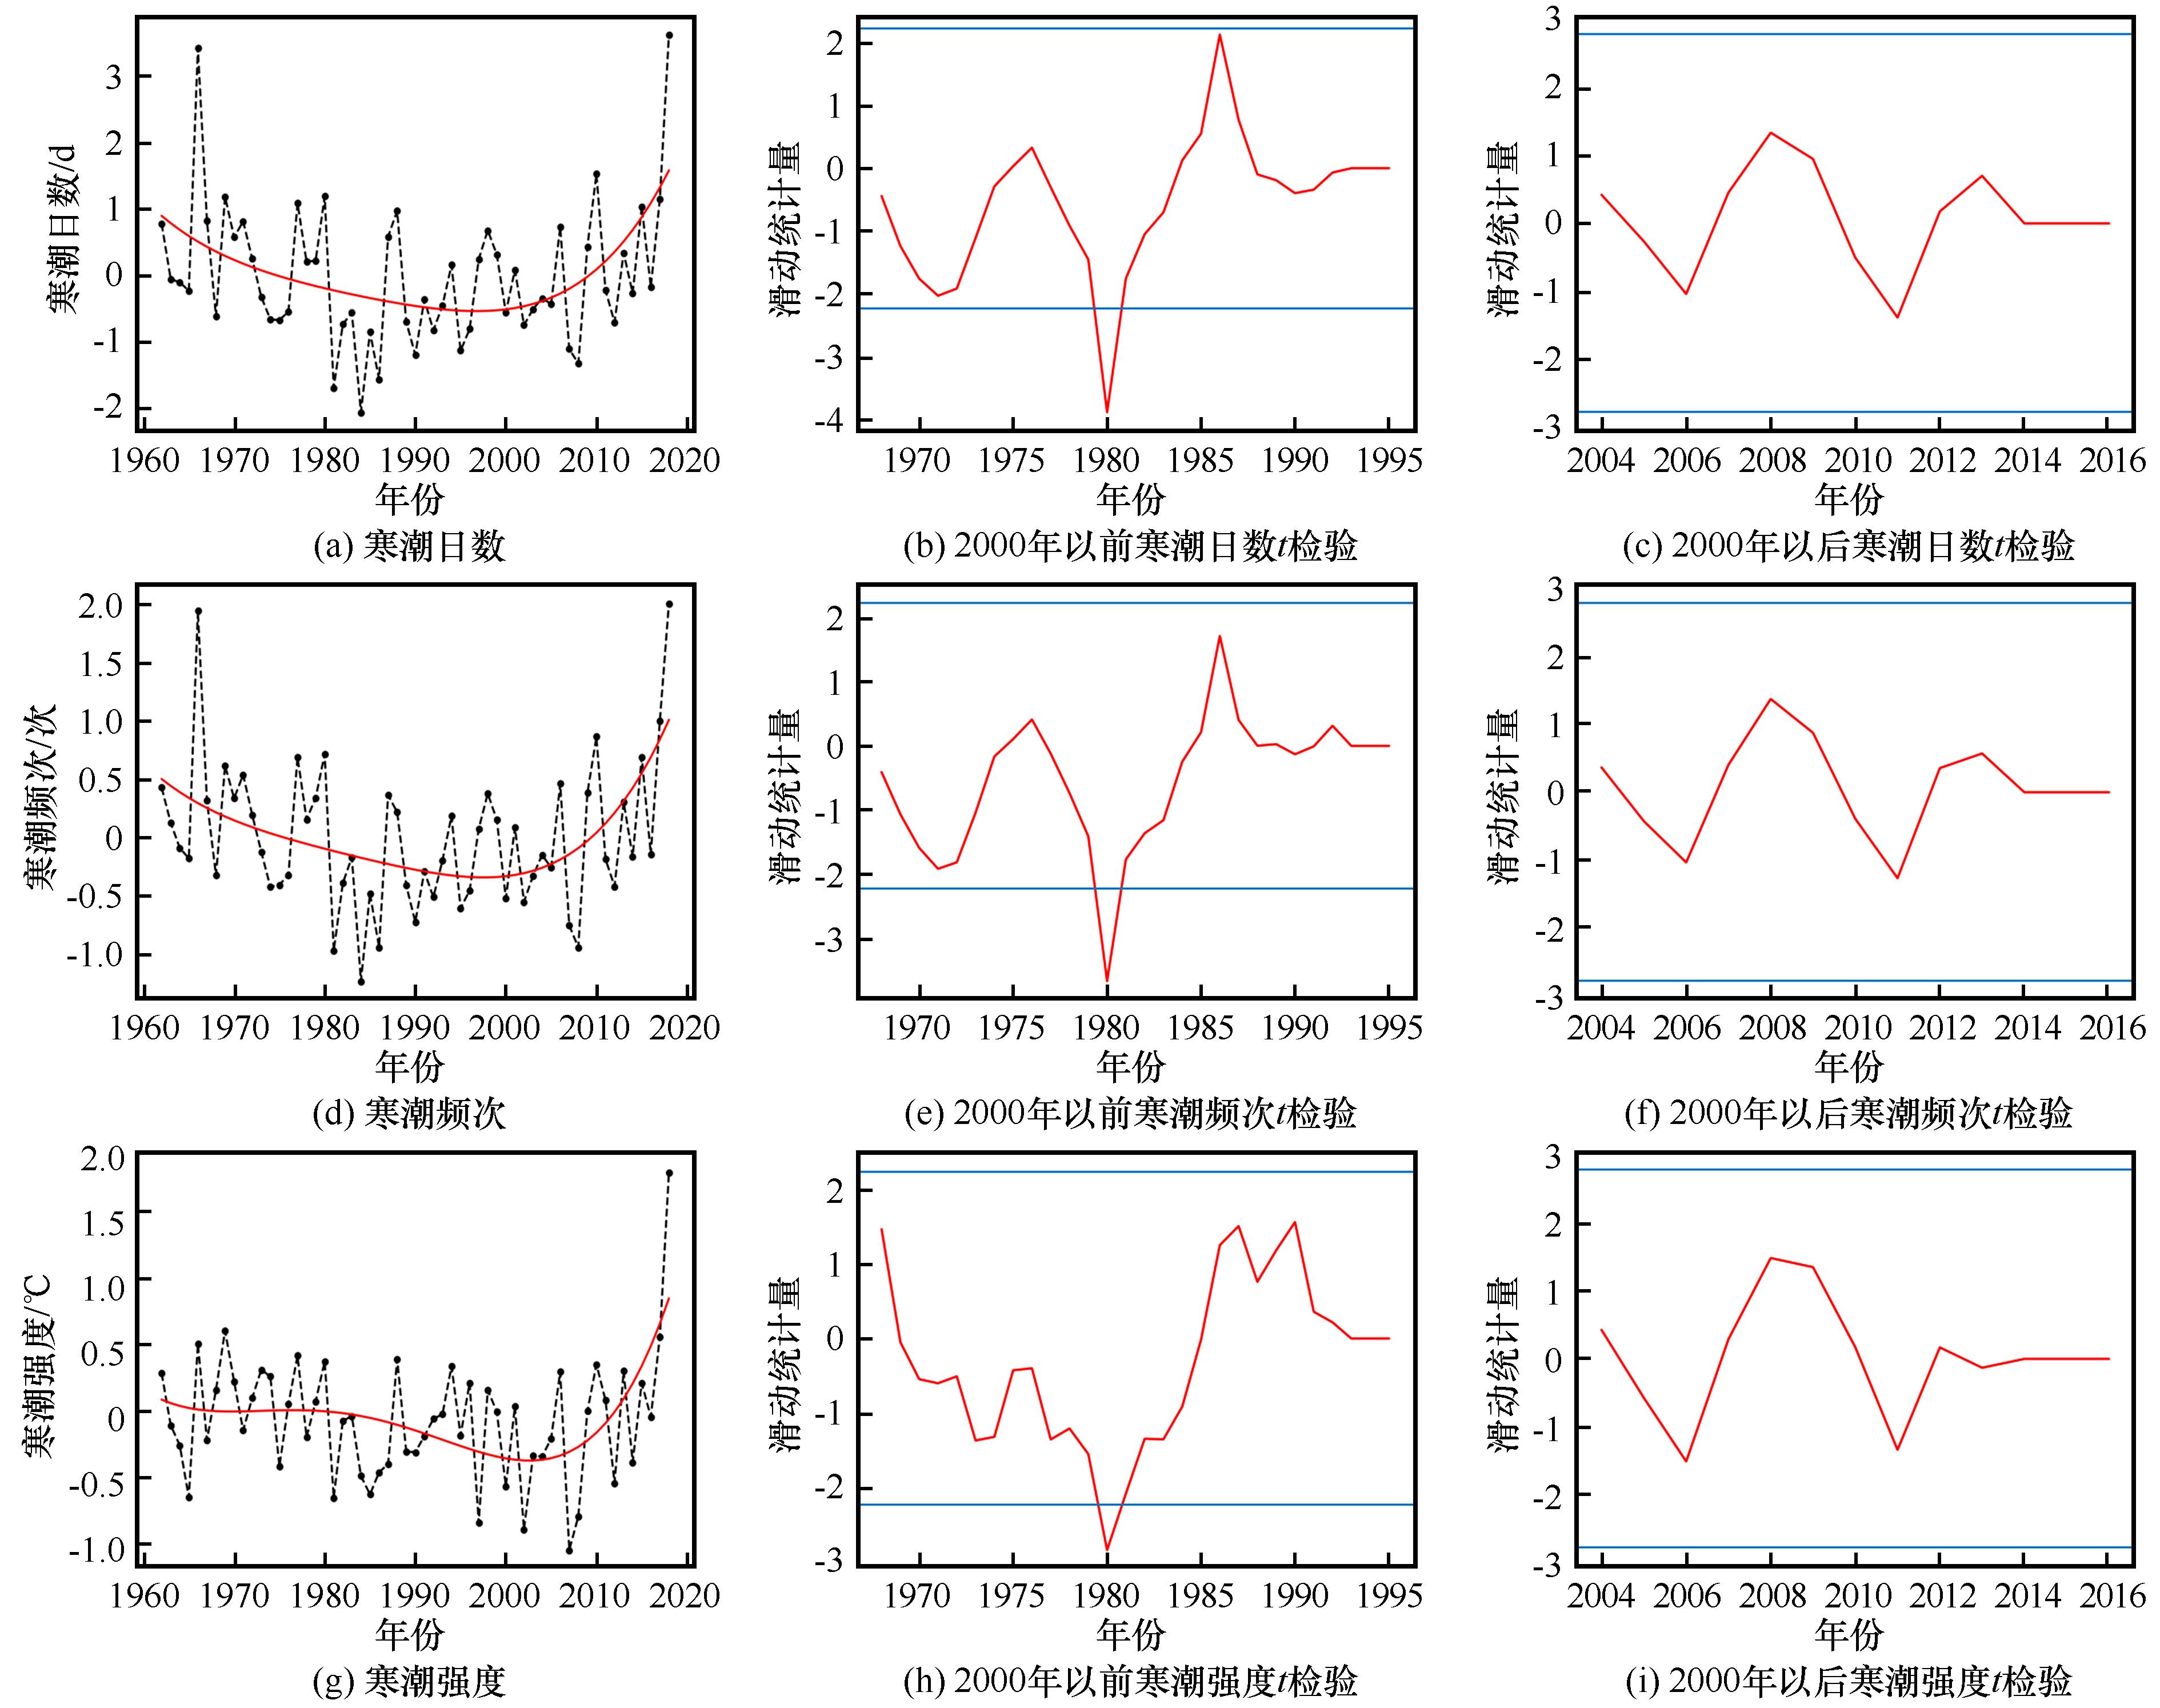
| 图1 最左列为1962—2018年中国寒潮日数(a)、寒潮频次(d)、寒潮强度(g)距平逐年变化(黑色)及4阶多项式拟合(红色)。中间列和最右列为2000年前后寒潮日数[(b),(c)]、寒潮频次[(e),(f)]、寒潮强度[(h),(i)]滑动t检验突变检测图,图中蓝色实线为显著性检验线(α=0.05) |
| Fig. 1 Annual variation (black solid line) and fourth-order polynomial fitting (red solid line) of number of CS (cold surge) day (a), CS frequency (d), CS intensity (g) during 1962—2018 in China (the left column). The middle column and the far right column are the moving t-test of abrupt changes of number of CS day [(b), (c)], CS frequency [(e), (f)], CS intensity [(h), (i)] before and after 2000. The blue solid line in the mutation plot is the significance test line (α=0.05) |
|
|