2000年前后我国寒潮活动特征的比较分析
Comparative analysis of the cold surge characteristics over China before and after 2000
2000年前后我国寒潮活动特征的比较分析 |
| 马力, 韦志刚, 李娴茹, 王欢, 郭仕侗 |
|
Comparative analysis of the cold surge characteristics over China before and after 2000 |
| Li MA, Zhigang WEI, Xianru LI, Huan WANG, Shitong GUO |
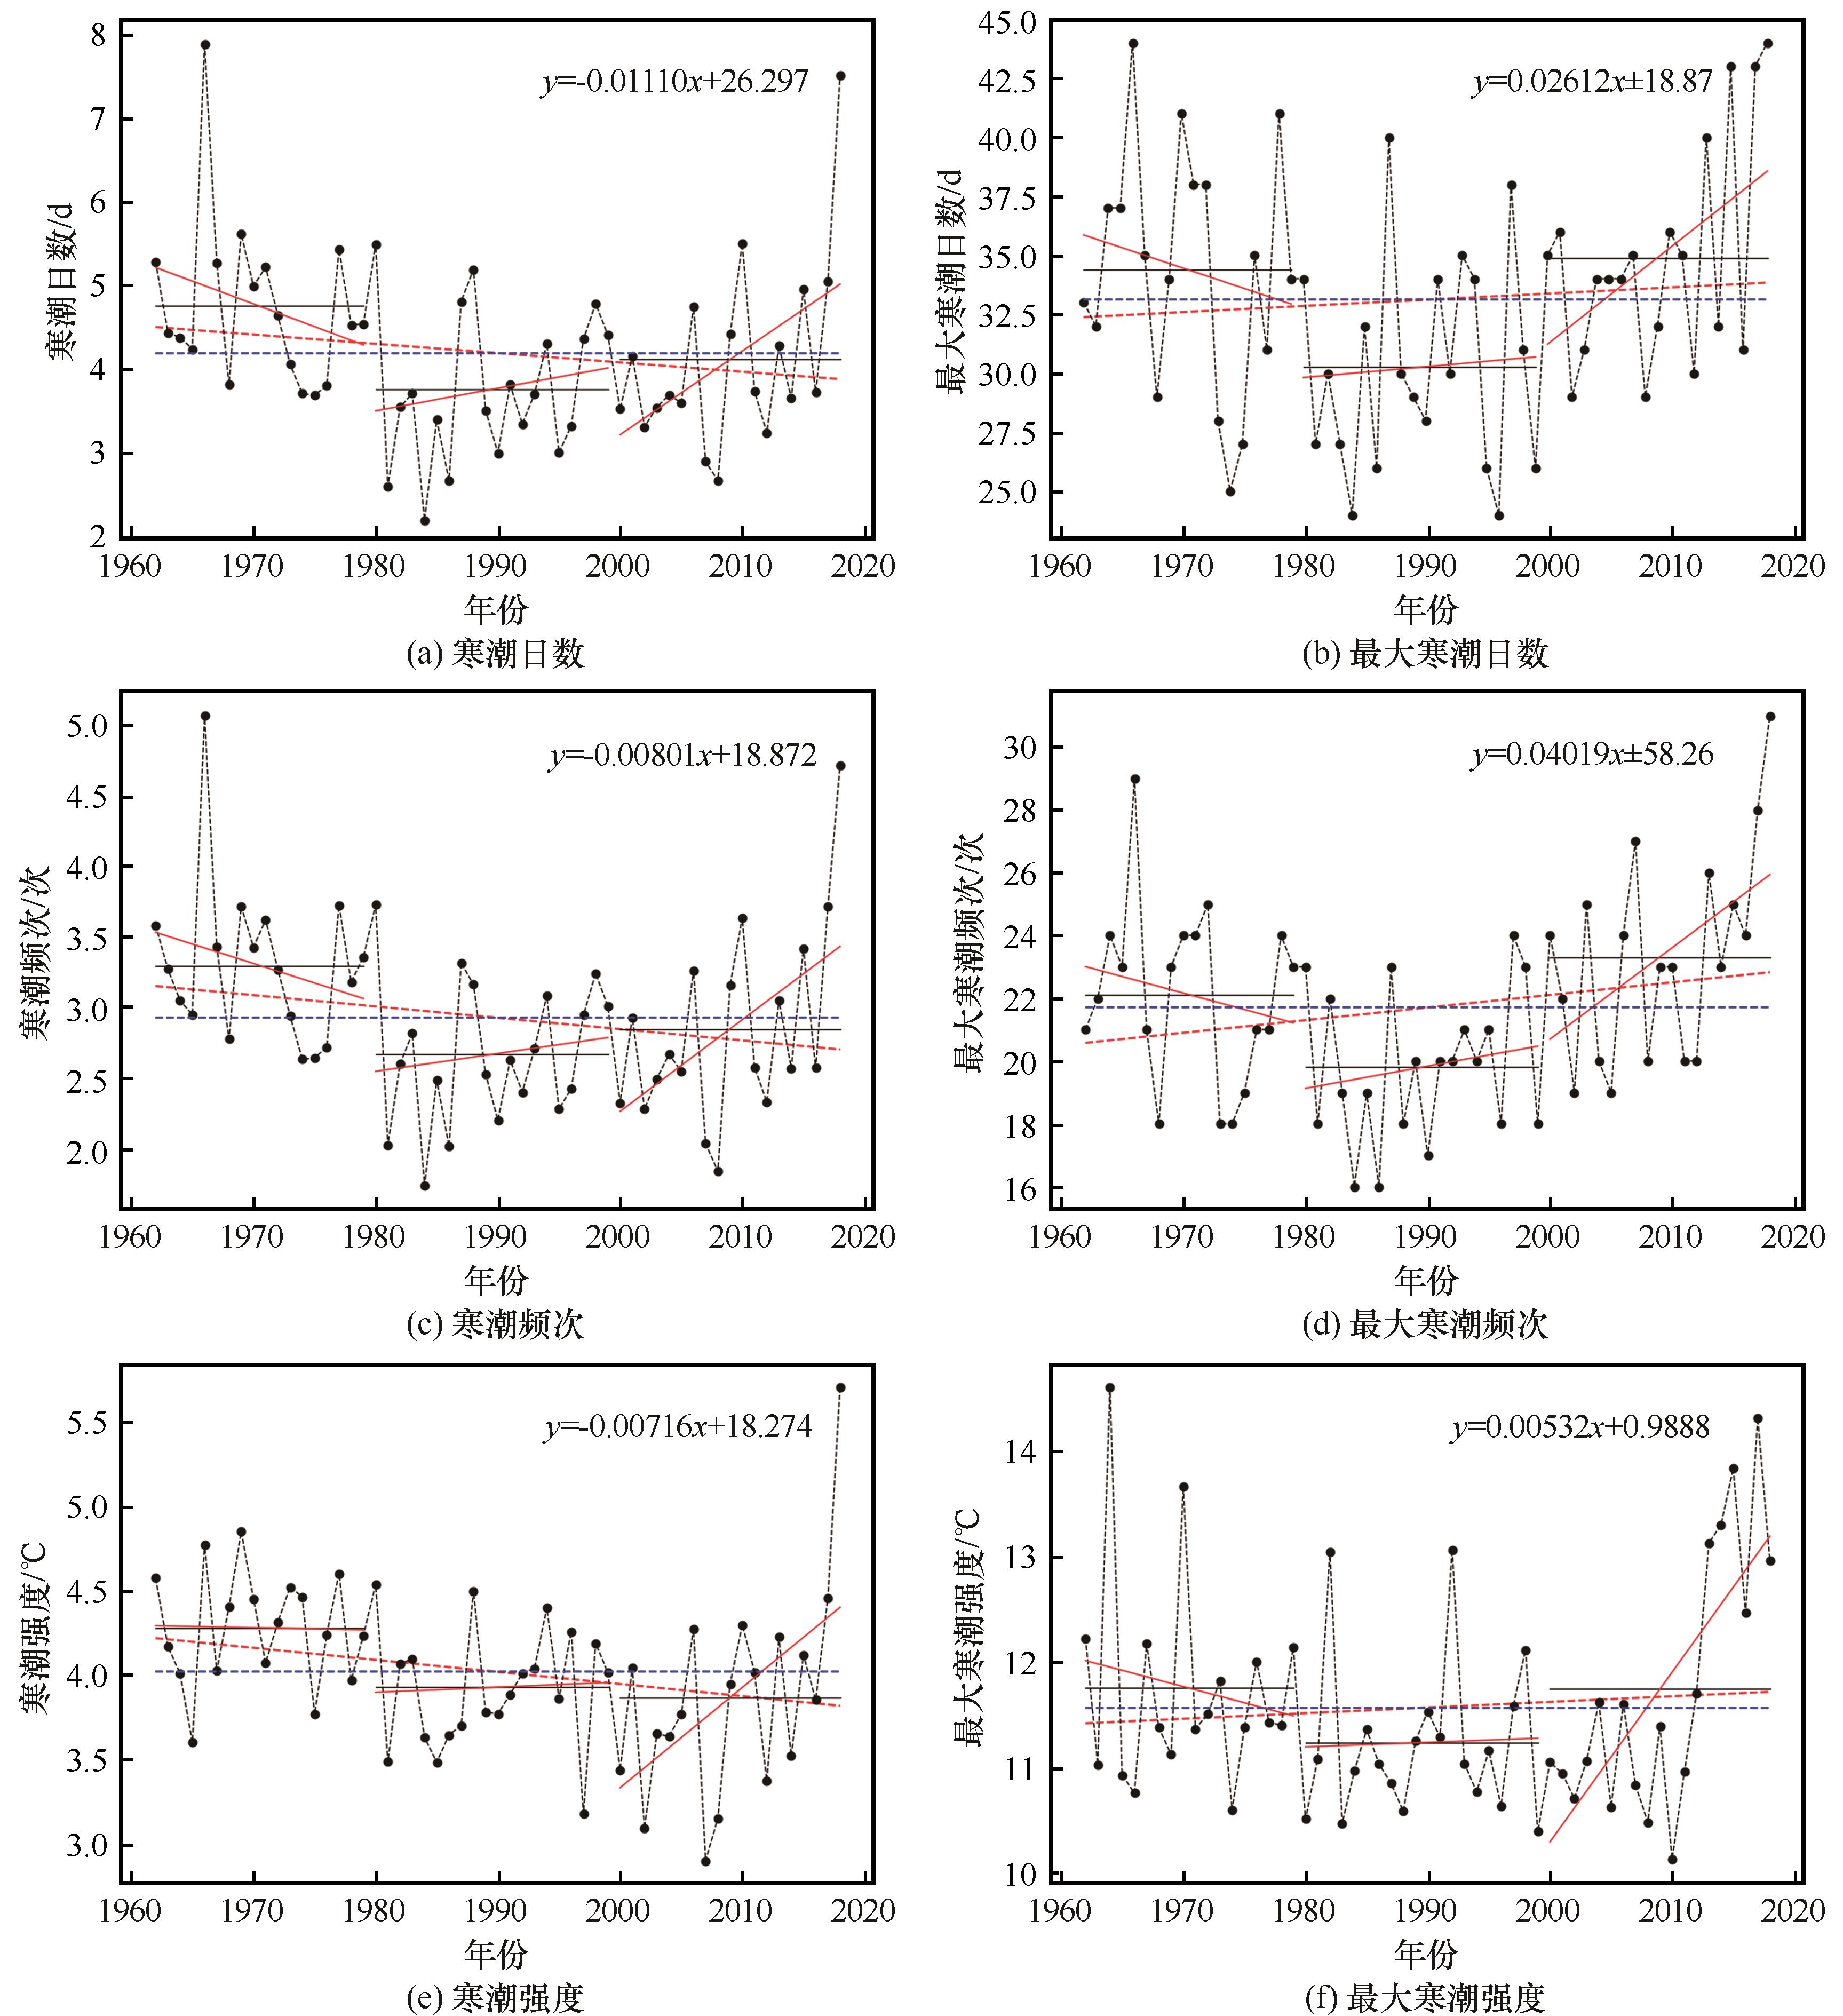
| 图2 1962—2018年中国寒潮日数(a)、最大寒潮日数(b)、寒潮频次(c)、最大寒潮频次(d)、寒潮强度(e)、最大寒潮强度(f)逐年变化及各时间段变化(图中红色虚线为多年变化趋势,红色实线为各阶段趋势,蓝色虚线为57年平均值,黑色实线为各阶段平均值) |
| Fig. 2 Annual variation and three time periods variation of number of CS day (a), maximum number of CS day (b), CS frequency (c), maximum CS frequency (d), CS intensity (e), maximum CS intensity (f) in China during 1962—2018 (The red dotted line is the multi-year trend, the red solid line is the trend of each time period, the blue dotted line is the average of 57 years, and the black solid line is the average of each time period) |
|
|