2000年前后我国寒潮活动特征的比较分析
Comparative analysis of the cold surge characteristics over China before and after 2000
2000年前后我国寒潮活动特征的比较分析 |
| 马力, 韦志刚, 李娴茹, 王欢, 郭仕侗 |
|
Comparative analysis of the cold surge characteristics over China before and after 2000 |
| Li MA, Zhigang WEI, Xianru LI, Huan WANG, Shitong GUO |
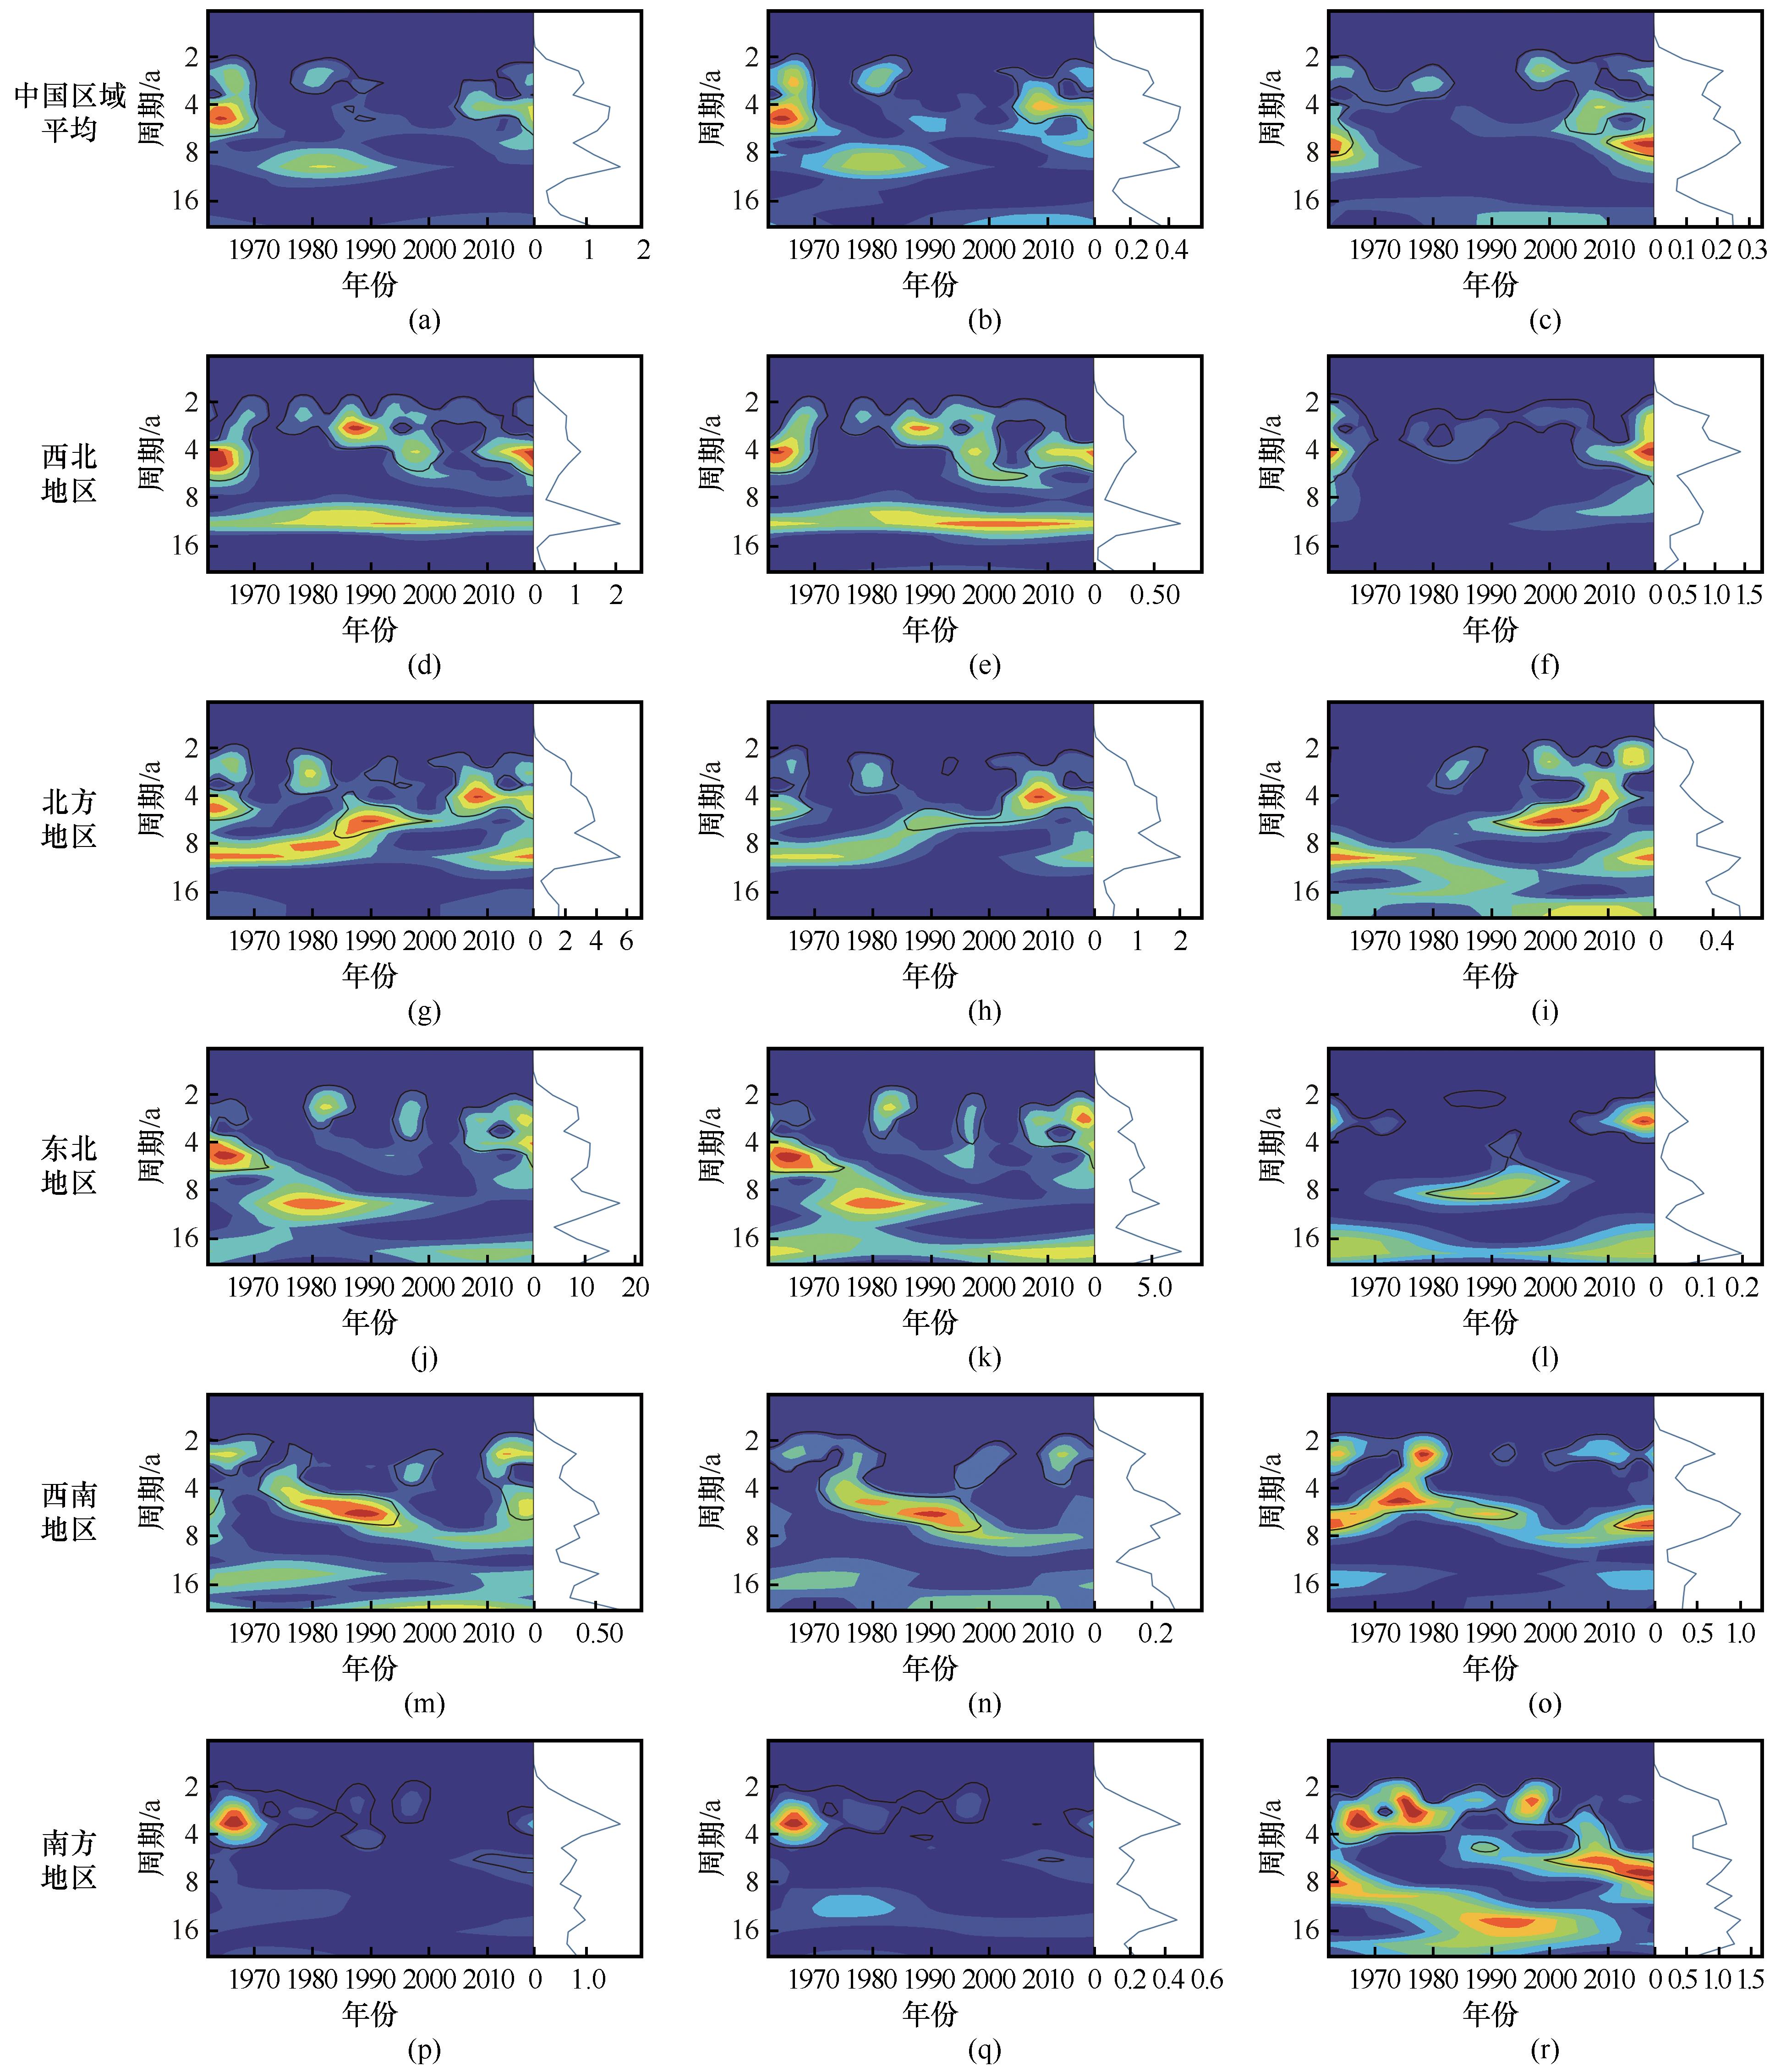
| 图9 1962—2018年中国区域平均及各地区平均寒潮日数[(a), (d), (g), (j), (m), (p)]、寒潮频次[(b), (e), (h), (k), (n), (q)]、寒潮强度[(c), (f), (i), (l), (o), (r)]的小波功率谱,黑色实线表示通过显著性检验(α=0.05) |
| Fig. 9 Annual wavelet power spectra and total wavelet power spectra of mean of number of CS day [(a), (d), (g), (j), (m), (p)], CS frequency [(b), (e), (h), (k), (n), (q)] and CS intensity [(c), (f), (i), (l), (o), (r)] in China and each region during 1962—2018, the solid black line indicate passed the significance test (α=0.05) |
|
|