青藏高原大气CH4源汇及其浓度时空变化特征研究进展
The source and sink of atmospheric methane and spatial-temporal variation of its concentration on the Qinghai-Tibet Plateau
青藏高原大气CH4源汇及其浓度时空变化特征研究进展 |
| 王逸凡, 高晶, 胡迈, 姚檀栋, 牛晓伟, 赵爱斌, 申子恒 |
|
The source and sink of atmospheric methane and spatial-temporal variation of its concentration on the Qinghai-Tibet Plateau |
| Yifan WANG, Jing GAO, Mai HU, Tandong YAO, Xiaowei NIU, Aibin ZHAO, Ziheng SHEN |
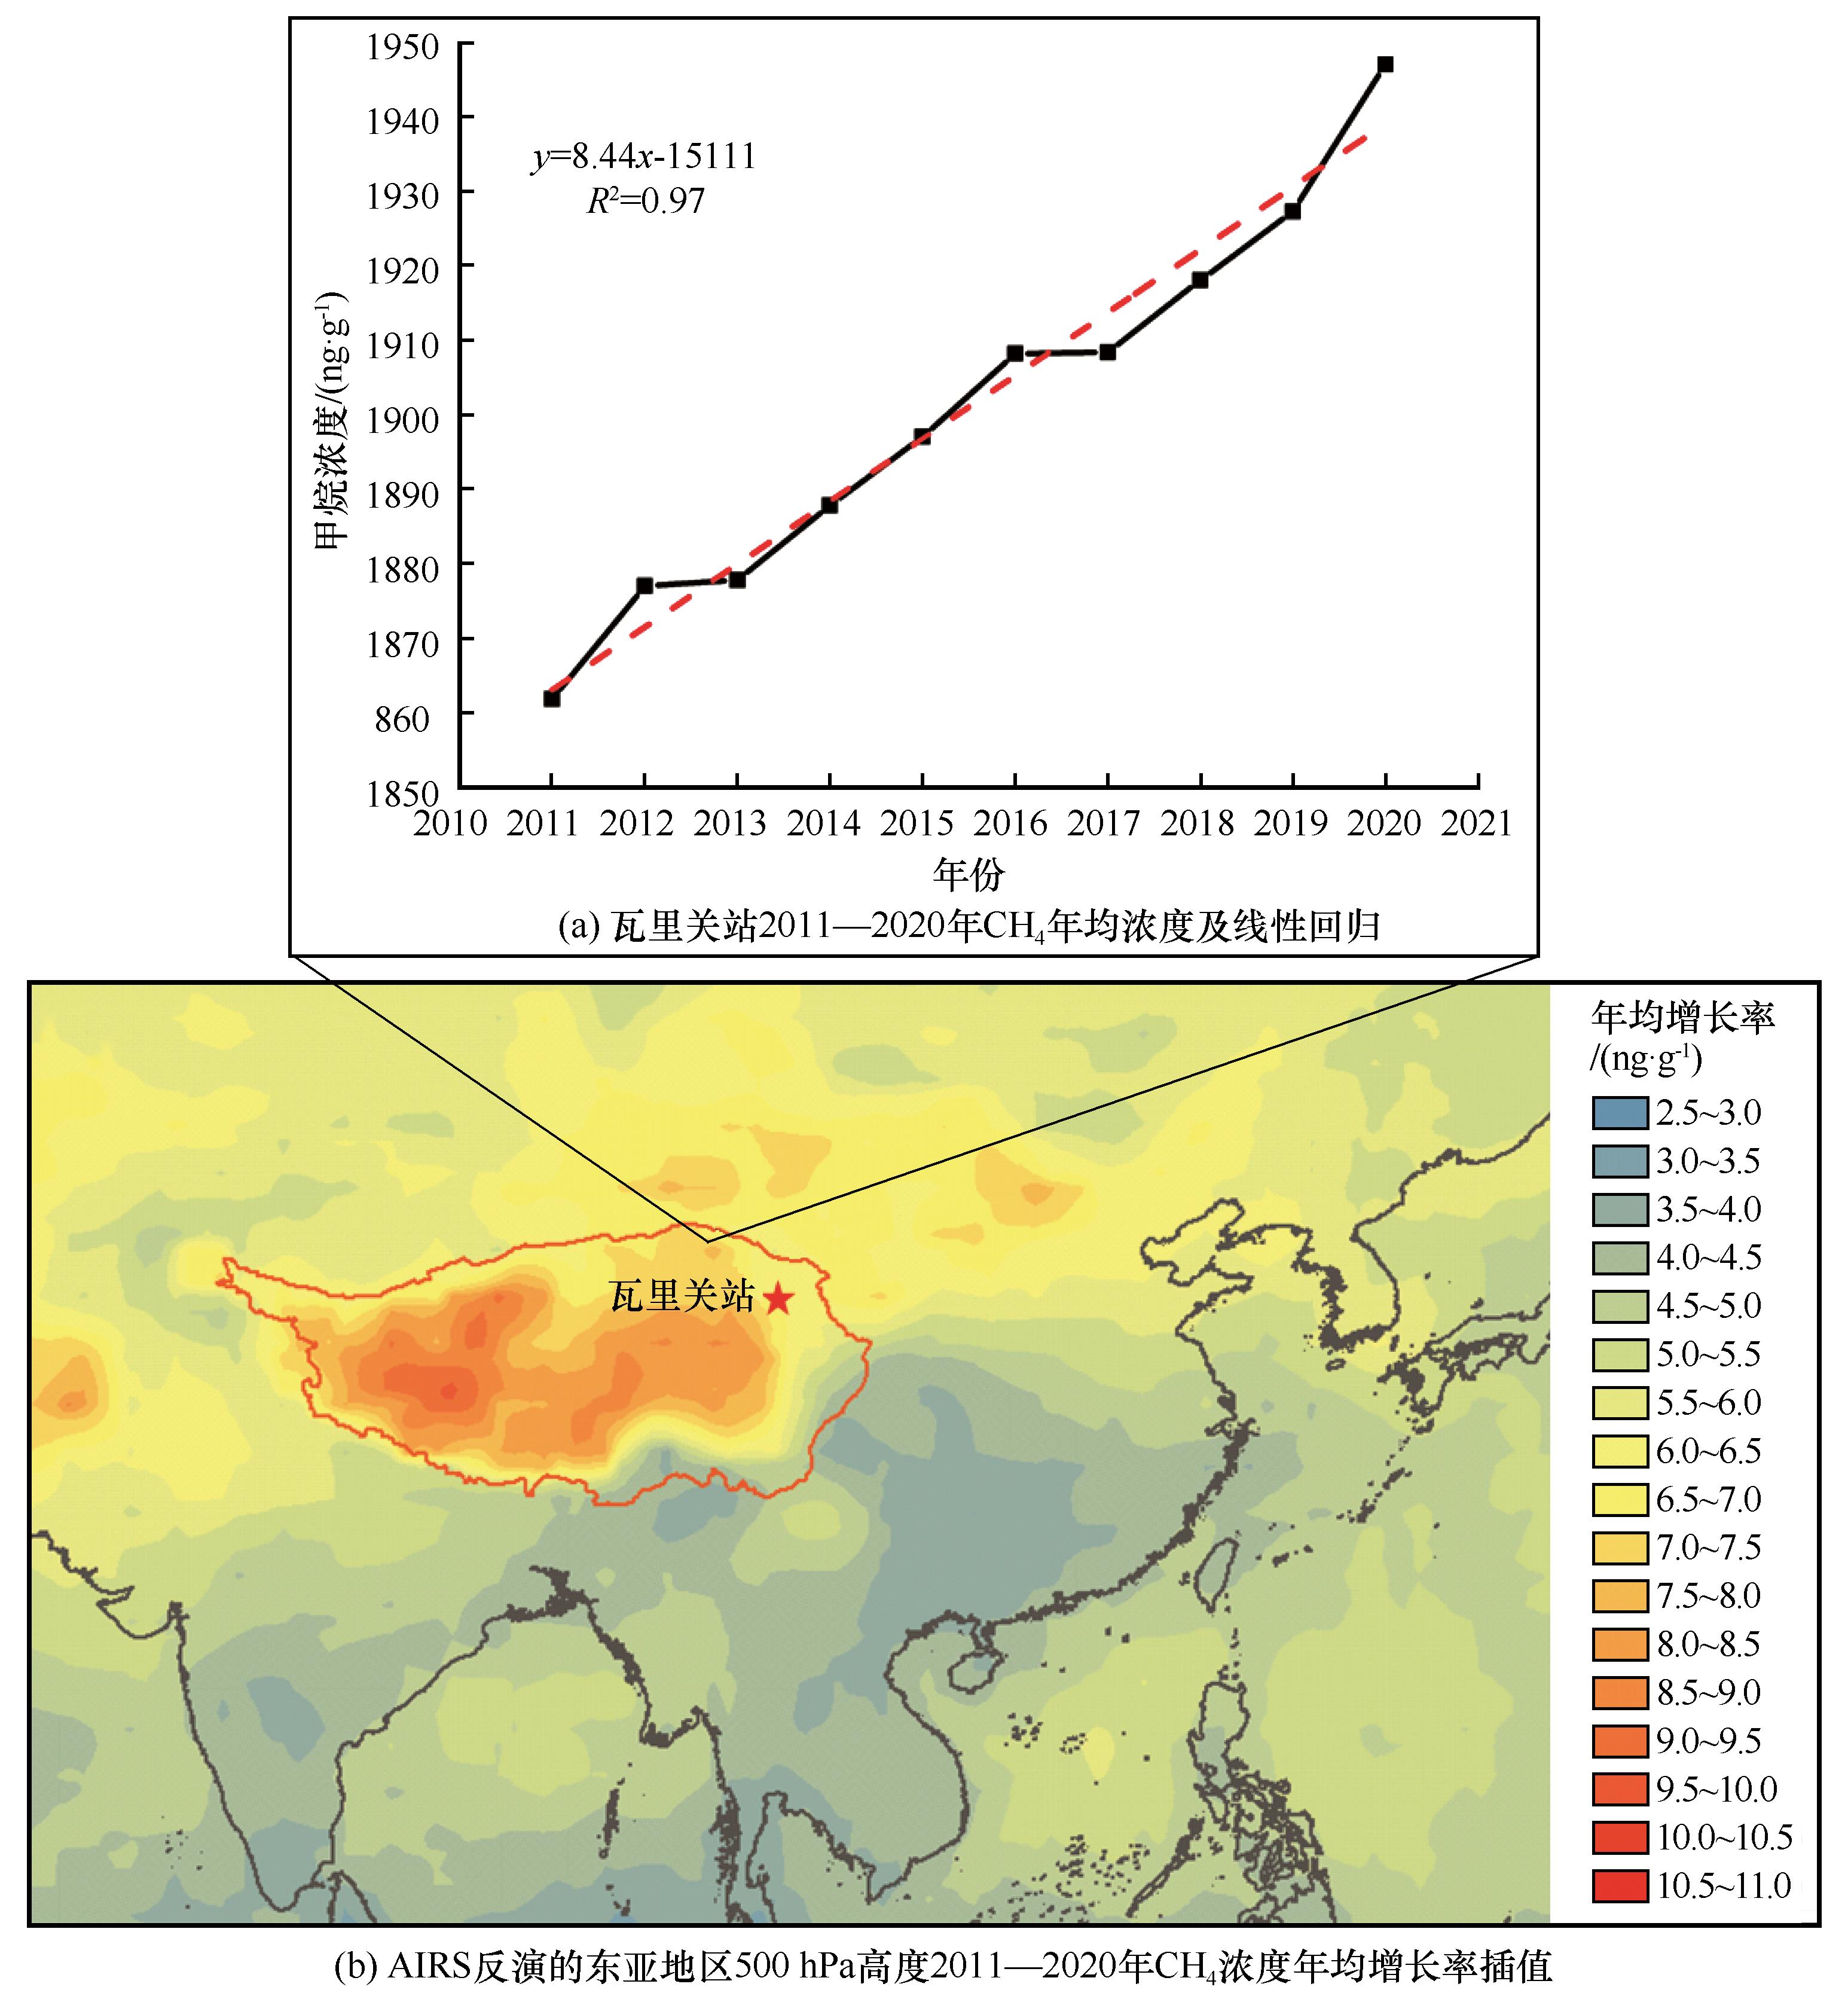
| 图3 基于地面观测和卫星遥感的CH4浓度增长率 |
| Fig. 3 The growth rate of CH4 concentration from ground observation and remote sensing [Annual average concentration and linear regression of CH4 at Waliguan station from 2011 to 2020 (a); Interpolation of annual average growth rate of CH4 concentration at 500 hPa height in East Asia retrieved by AIRS from 2011 to 2020 (b)] |
|
|