), 李晓东1,2(), 张东1,2, 申燕玲1,2
), Xiaodong LI1,2(), Dong ZHANG1,2, Yanling SHEN1,2
), 李晓东1,2(), 张东1,2, 申燕玲1,2
), Xiaodong LI1,2(), Dong ZHANG1,2, Yanling SHEN1,2
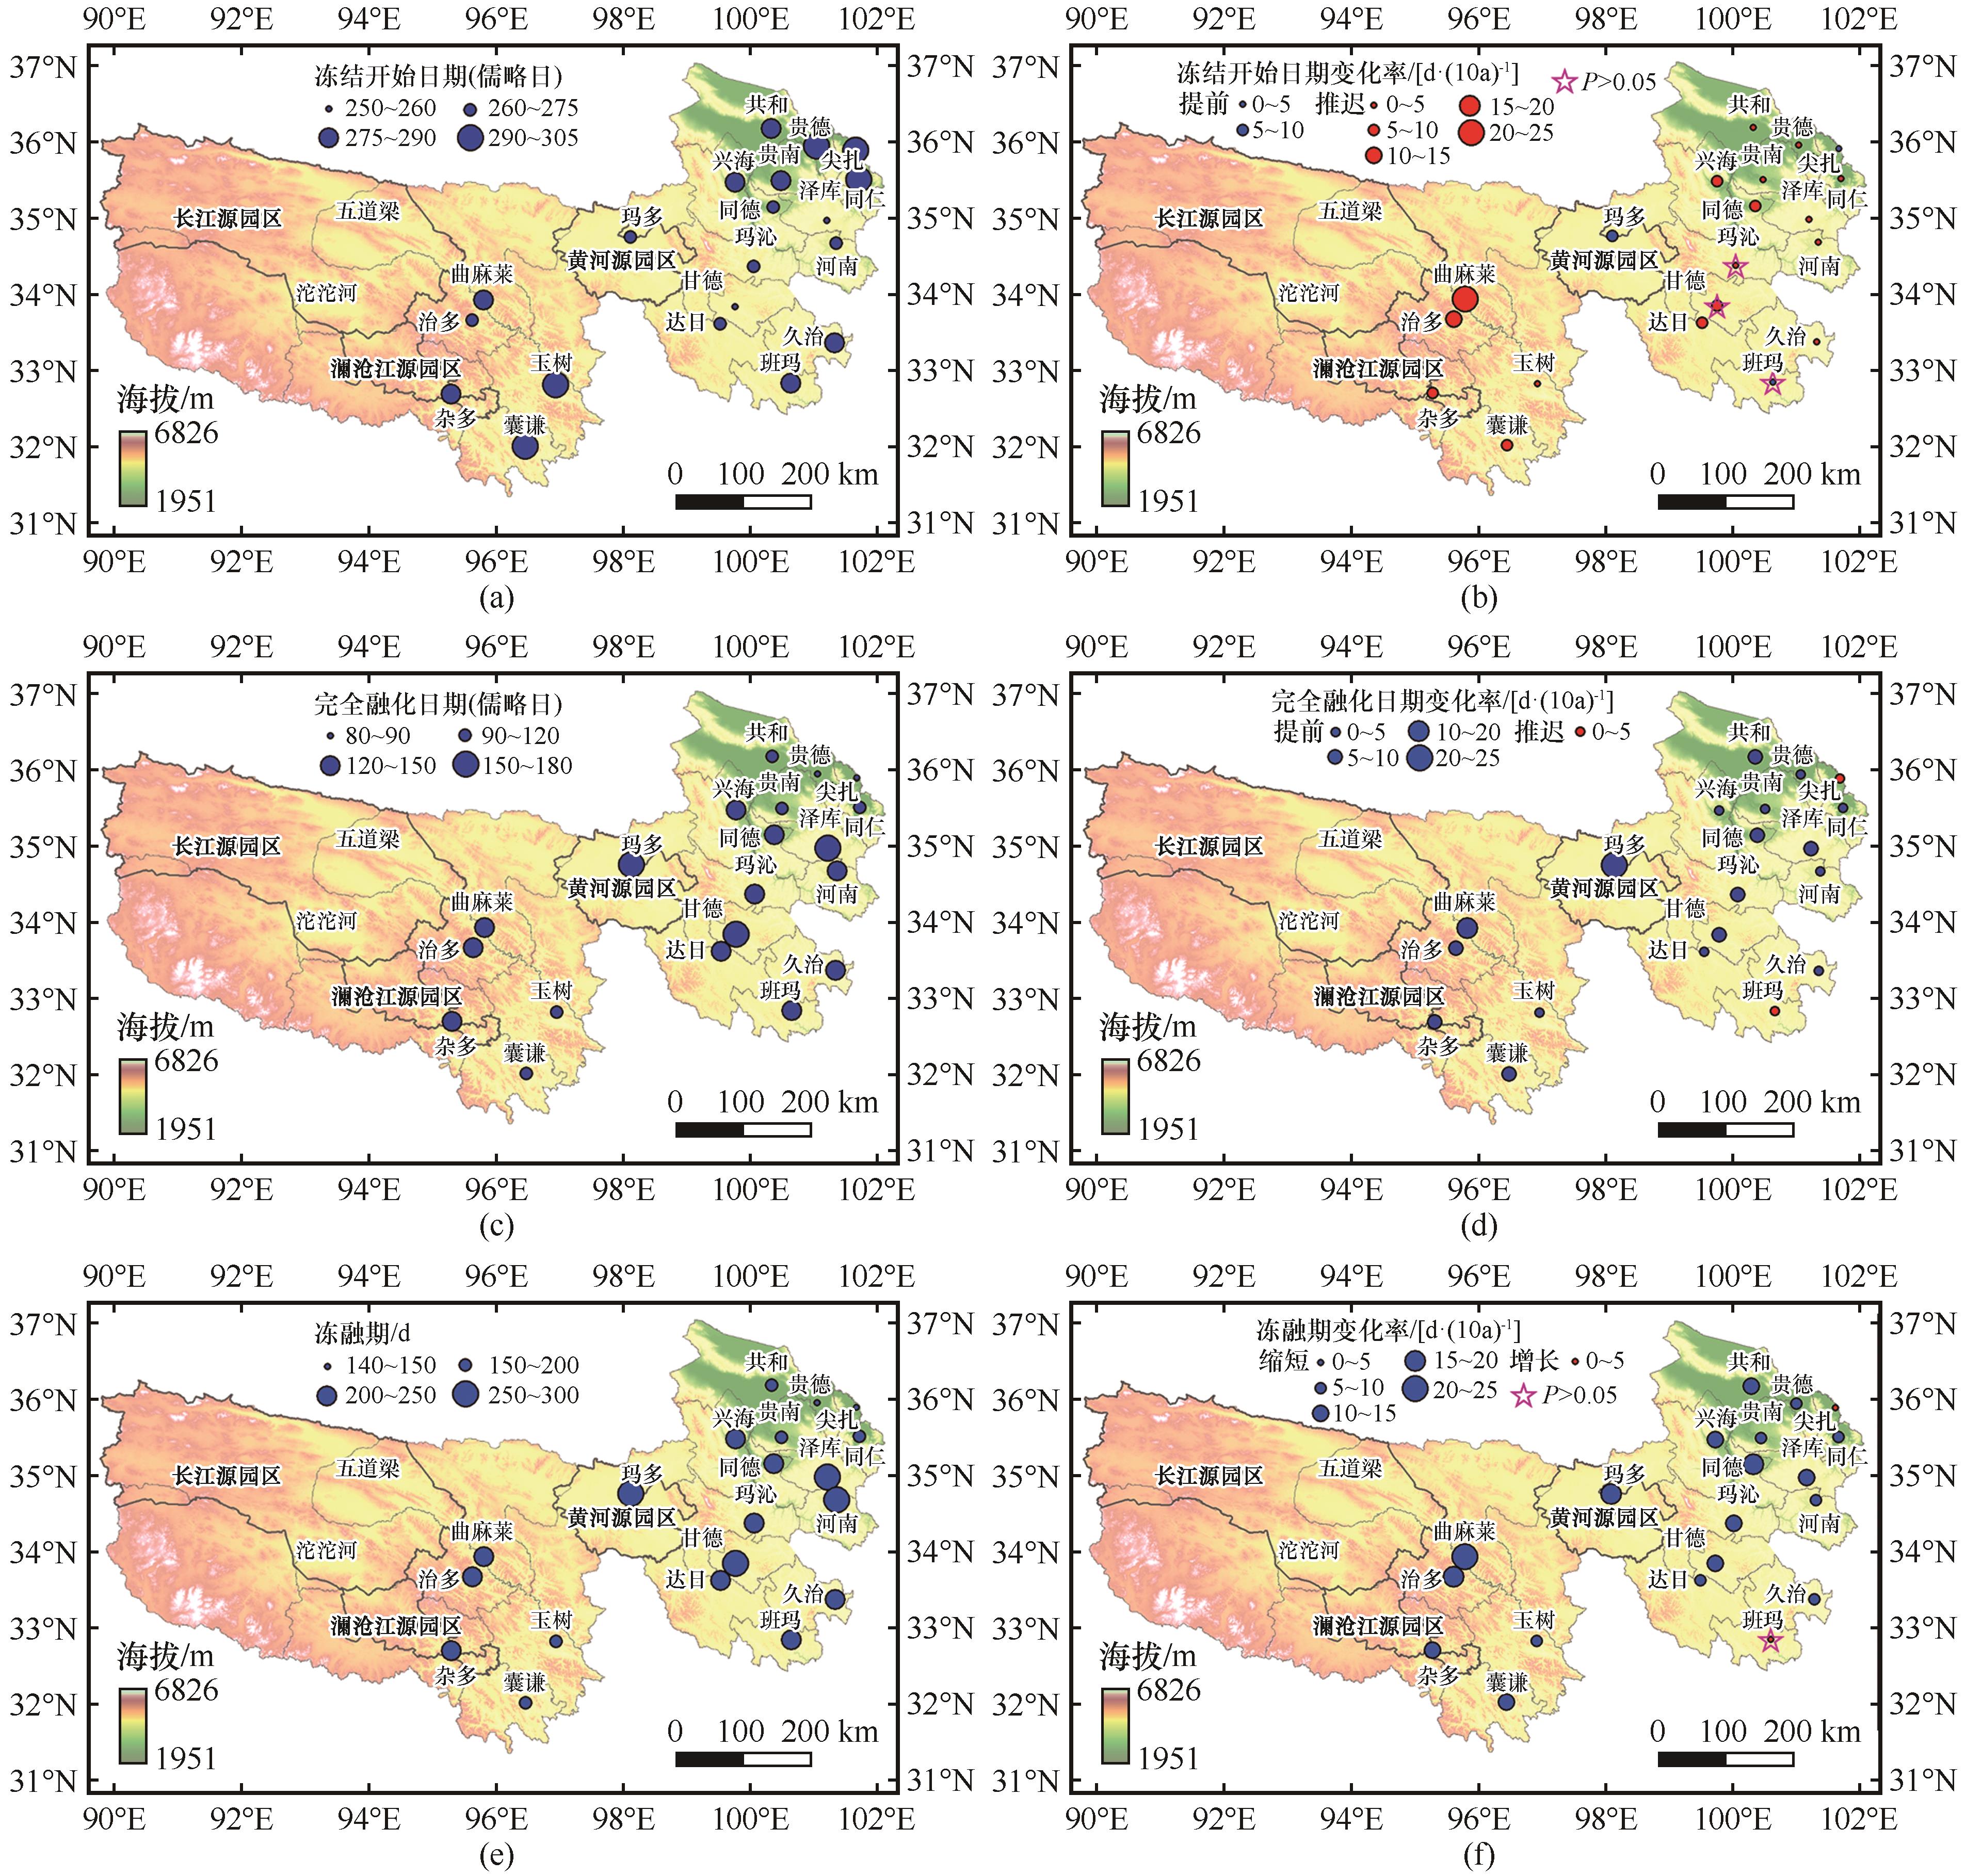
图6. 1961—2019年三江源地区季节冻土冻结开始日期(a)、冻结开始日期变化率(b)、完全融化日期(c)、完全融化日期变化率(d)、冻融期(e)、冻融期变化率(f)空间分布[图(a)、(c)、(e)中蓝点大小表示冻结开始日期、完全融化日期对应儒略日或冻融期的时长,图(b)、(d)、(f)中红点表示冻结开始日期、完全融化日期推迟或冻融期增长,蓝点表示冻结开始日期、完全融化日期提前或冻融期缩短,五角星表示未通过P<0.05的显著性检验]
Fig. 6. The long-term average and trend spatial distribution of each freeze-thaw state variable in the Three Rivers Source Region from 1961 to 2019: the long-term average of the first date of soil freeze (blue circles) (a), the long-term trend of the first date of soil freeze (blue circles indicate reflect it is decreasing, red circles indicate reflect it is increasing) (b), the long-term average of the last date of soil thaw (blue circles) (c), the long-term trend of the last date of soil thaw (blue circles indicate it is decreasing, red circles indicate it is increasing) (d), the long-term average of freeze-thaw duration (blue circles) (e), the long-term trend of freeze-thaw duration (blue circles indicate it is decreasing, red circles reflect it is increasing) (f), and five-pointed star indicate no significant change (P<0.05)