1961—2019年三江源地区季节冻土冻融状态时空变化及影响因素研究
梁奔奔1,2( ), 李晓东1,2(), 张东1,2, 申燕玲1,2
), 李晓东1,2(), 张东1,2, 申燕玲1,2
Study on spatiotemporal changes of the freeze-thaw status of seasonally frozen ground and influencing factors in the Three Rivers Source Region from 1961 to 2019
Benben LIANG1,2(), Xiaodong LI1,2(), Dong ZHANG1,2, Yanling SHEN1,2
), Xiaodong LI1,2(), Dong ZHANG1,2, Yanling SHEN1,2
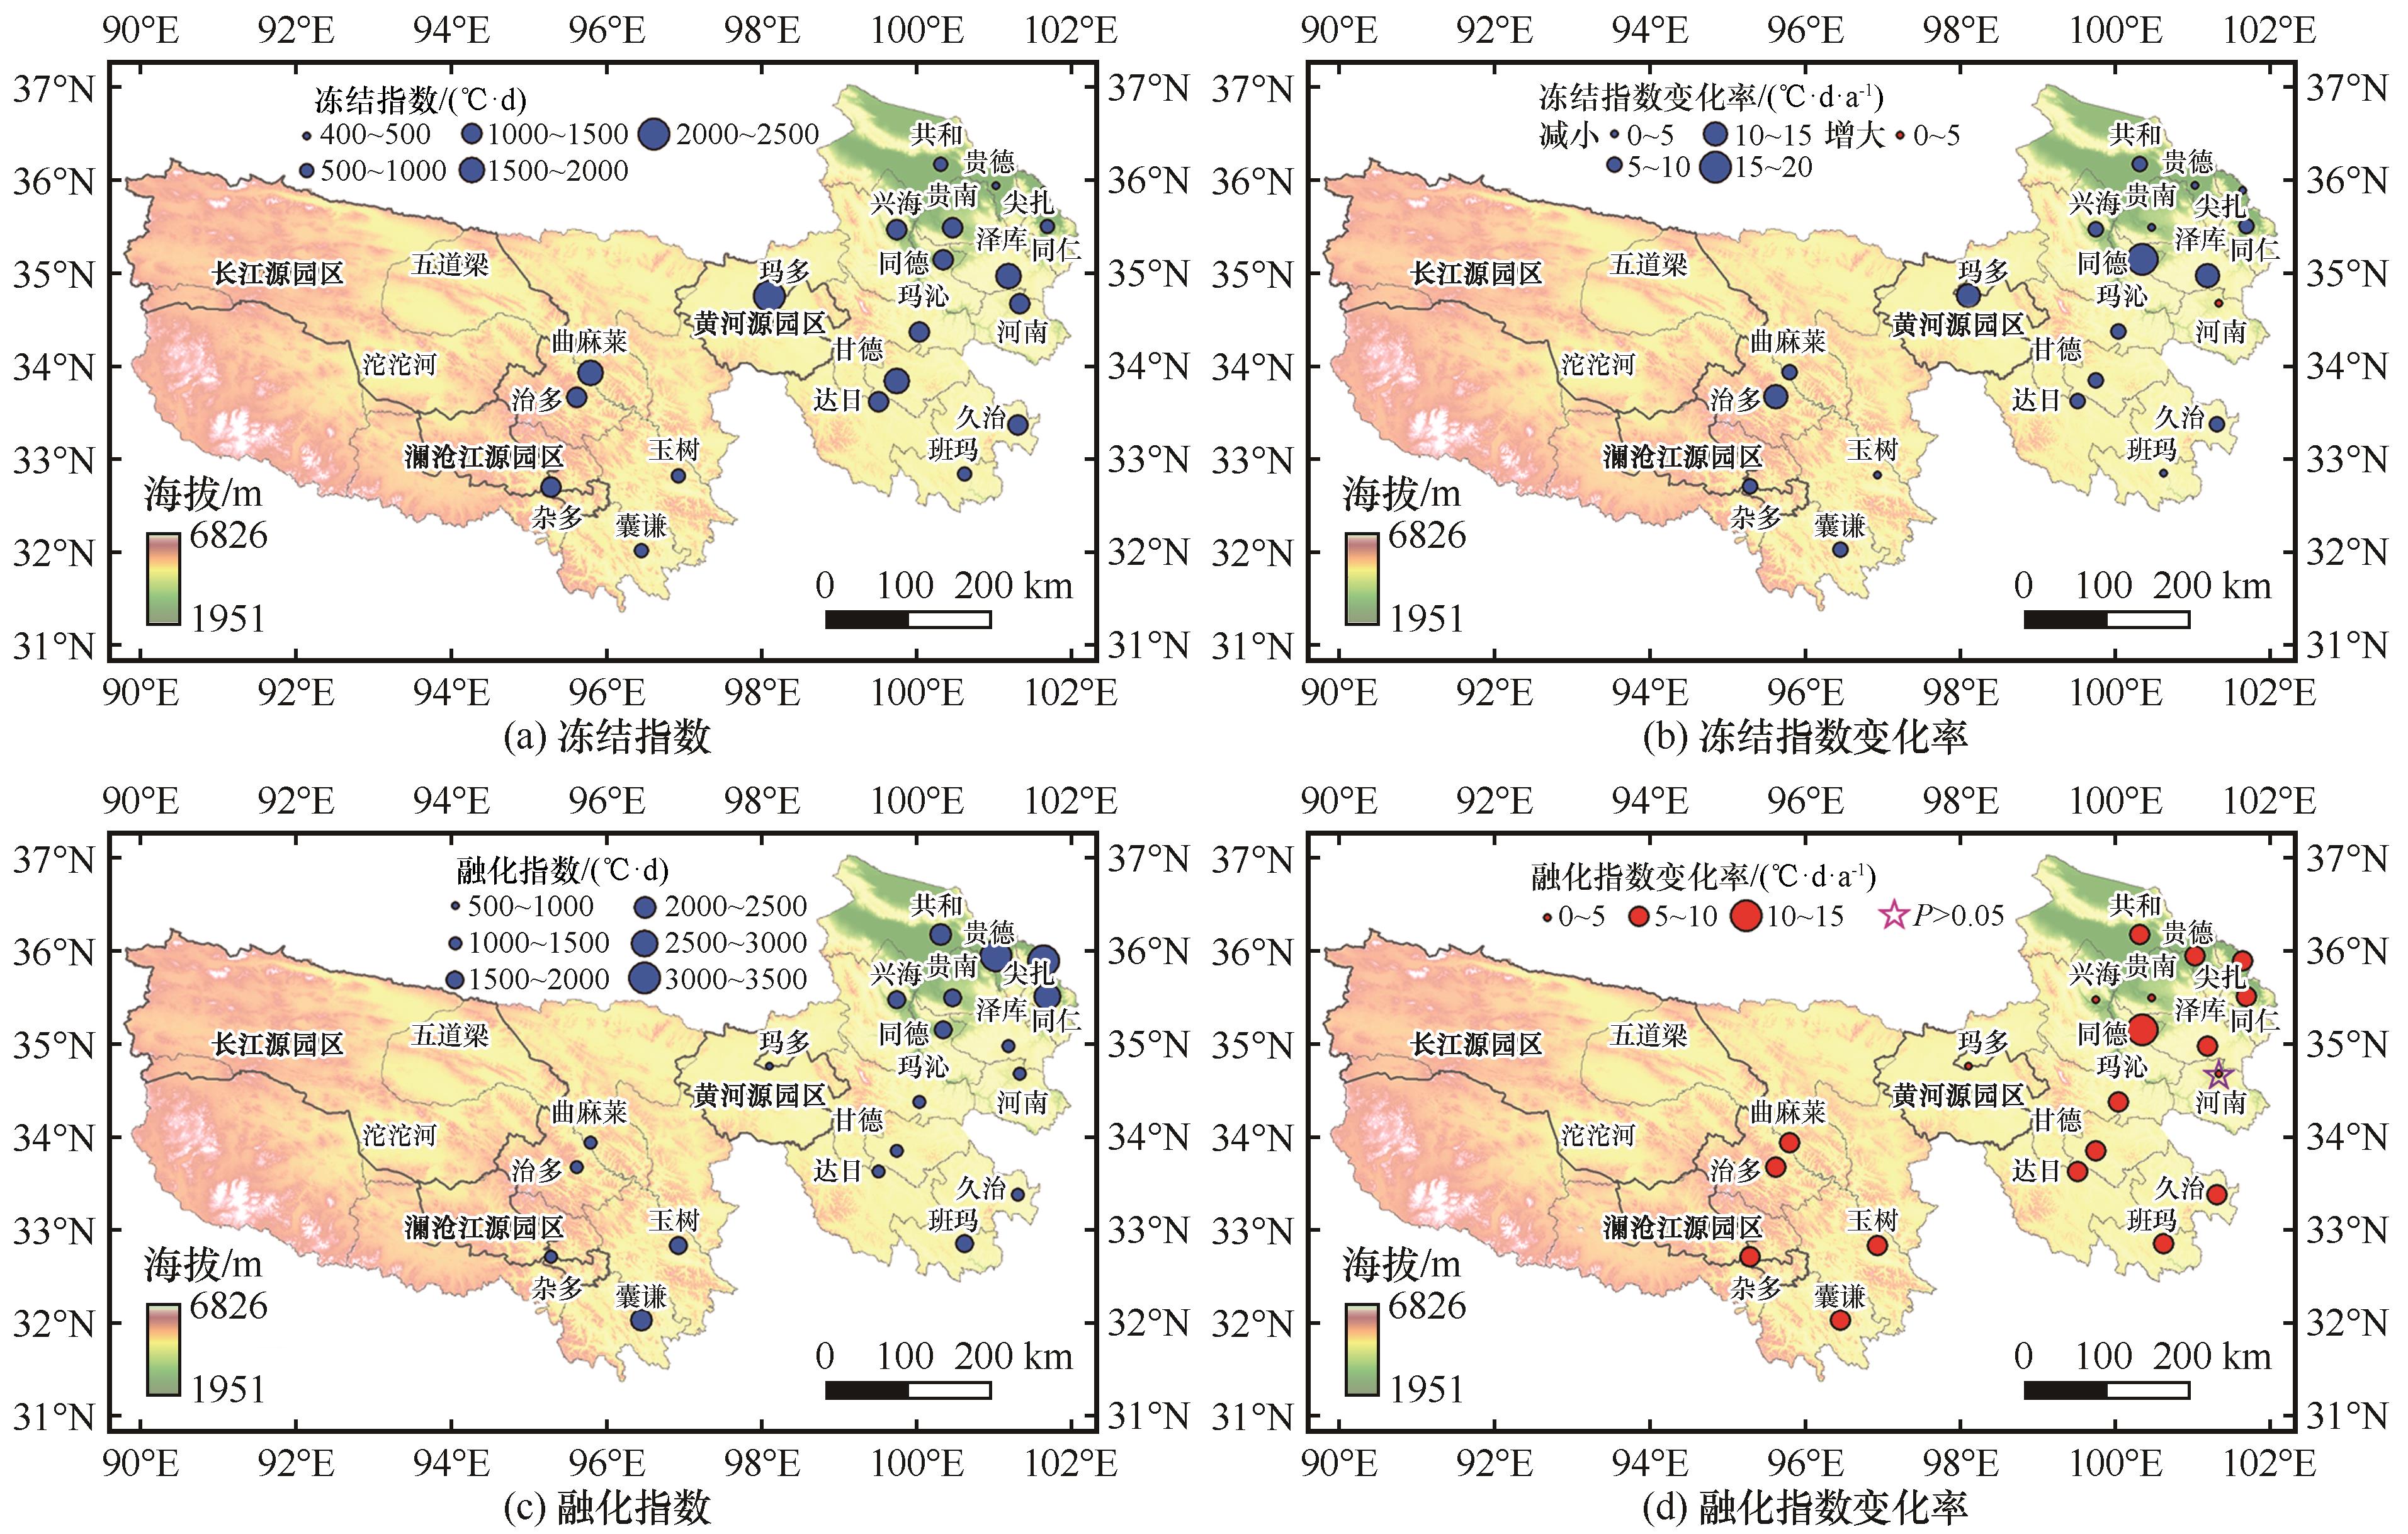
图8. 1961—2019年三江源地区冻结指数(a)、冻结指数变化率(b)、融化指数(c)、融化指数变化率(d)空间分布[图(a)、(c)中蓝点大小表示冻结、融化指数大小,图(b)、(d)中红点表示冻结、融化指数增大,蓝点表示减小,五角星表示未通过P<0.05的显著性检验]
Fig. 8. The long-term average and trend spatial distribution of freezing and thawing index in the Three Rivers Source Region from 1961 to 2019: the long-term average of freezing index (blue circles) (a), the long-term trend of freezing index (blue circles reflect it is decreasing, red circles reflect it is increasing) (b), the long-term average of thawing index (blue circles) (c), the long-term trend of thawing index (blue circles reflect it is decreasing, red circles reflect it is increasing) (d), and five-pointed star indicate no significant change (P<0.05)