1850—2100年北极阿拉斯加地区最大河冰厚度时空变化特征
杨瑞敏( ), 周茅先
), 周茅先
Spatiotemporal variations in the maximum river ice thickness across Alaska from 1850 to 2100
Ruimin YANG(), Maoxian ZHOU
), Maoxian ZHOU
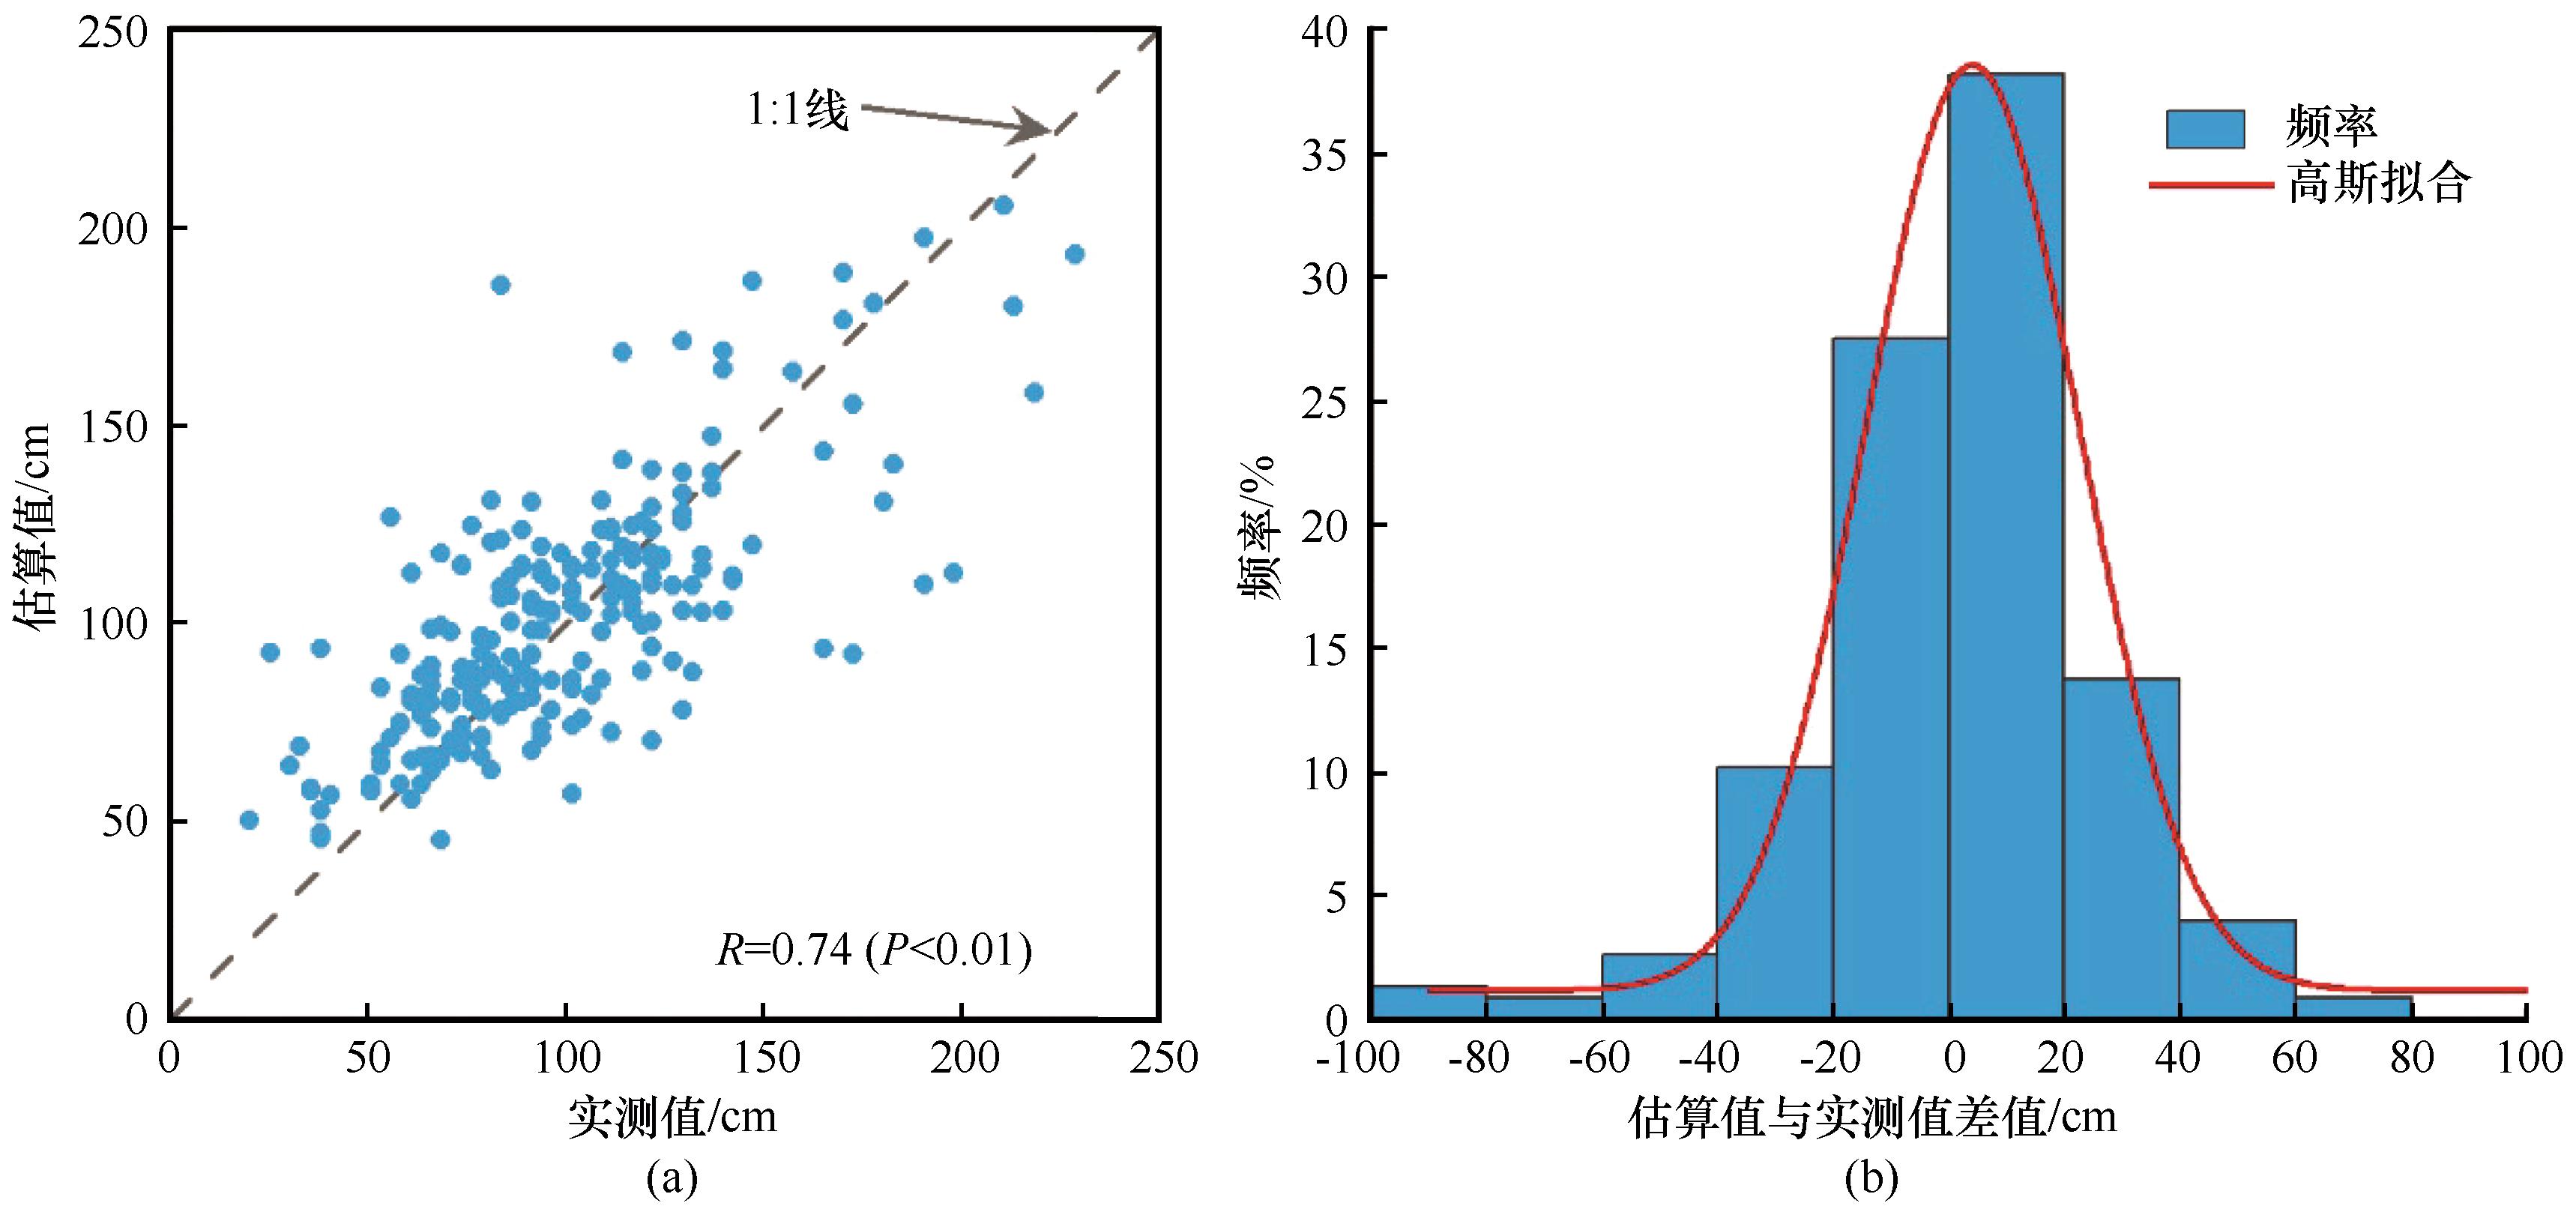
图2. 最大河冰厚度野外实测值与利用年冻结指数估算的结果的对比分析(a)(灰色虚线为1∶1线)及估算值与实测值差值频率分布直方图(b)
Fig. 2. Results of regression analysis between the MRITs (maximum river ice thicknesses) from gauging sites and the MRITs estimated using Equation (5) [The gray dash line is y=x (a)] and frequency histogram of differences between the MRITs from gauging sites and the MRITs estimated using equation (b)