CLM5. 0对阿拉斯加多年冻土区土壤温度和碳循环模拟的适用性评估
Applicability evaluation of CLM5. 0 in simulating soil temperature and carbon cycle in Alaskan permafrost region
CLM5. 0对阿拉斯加多年冻土区土壤温度和碳循环模拟的适用性评估 |
| 闫旭春, 吴晓东, 吕雅琼, 吴通华, 李韧, 胡国杰, 邹德富, 刘亚东, 魏献花, 范晓英, 王栋 |
|
Applicability evaluation of CLM5. 0 in simulating soil temperature and carbon cycle in Alaskan permafrost region |
| Xuchun YAN, Xiaodong WU, Yaqiong LÜ, Tonghua WU, Ren LI, Guojie HU, Defu ZOU, Yadong LIU, Xianhua WEI, Xiaoying FAN, Dong WANG |
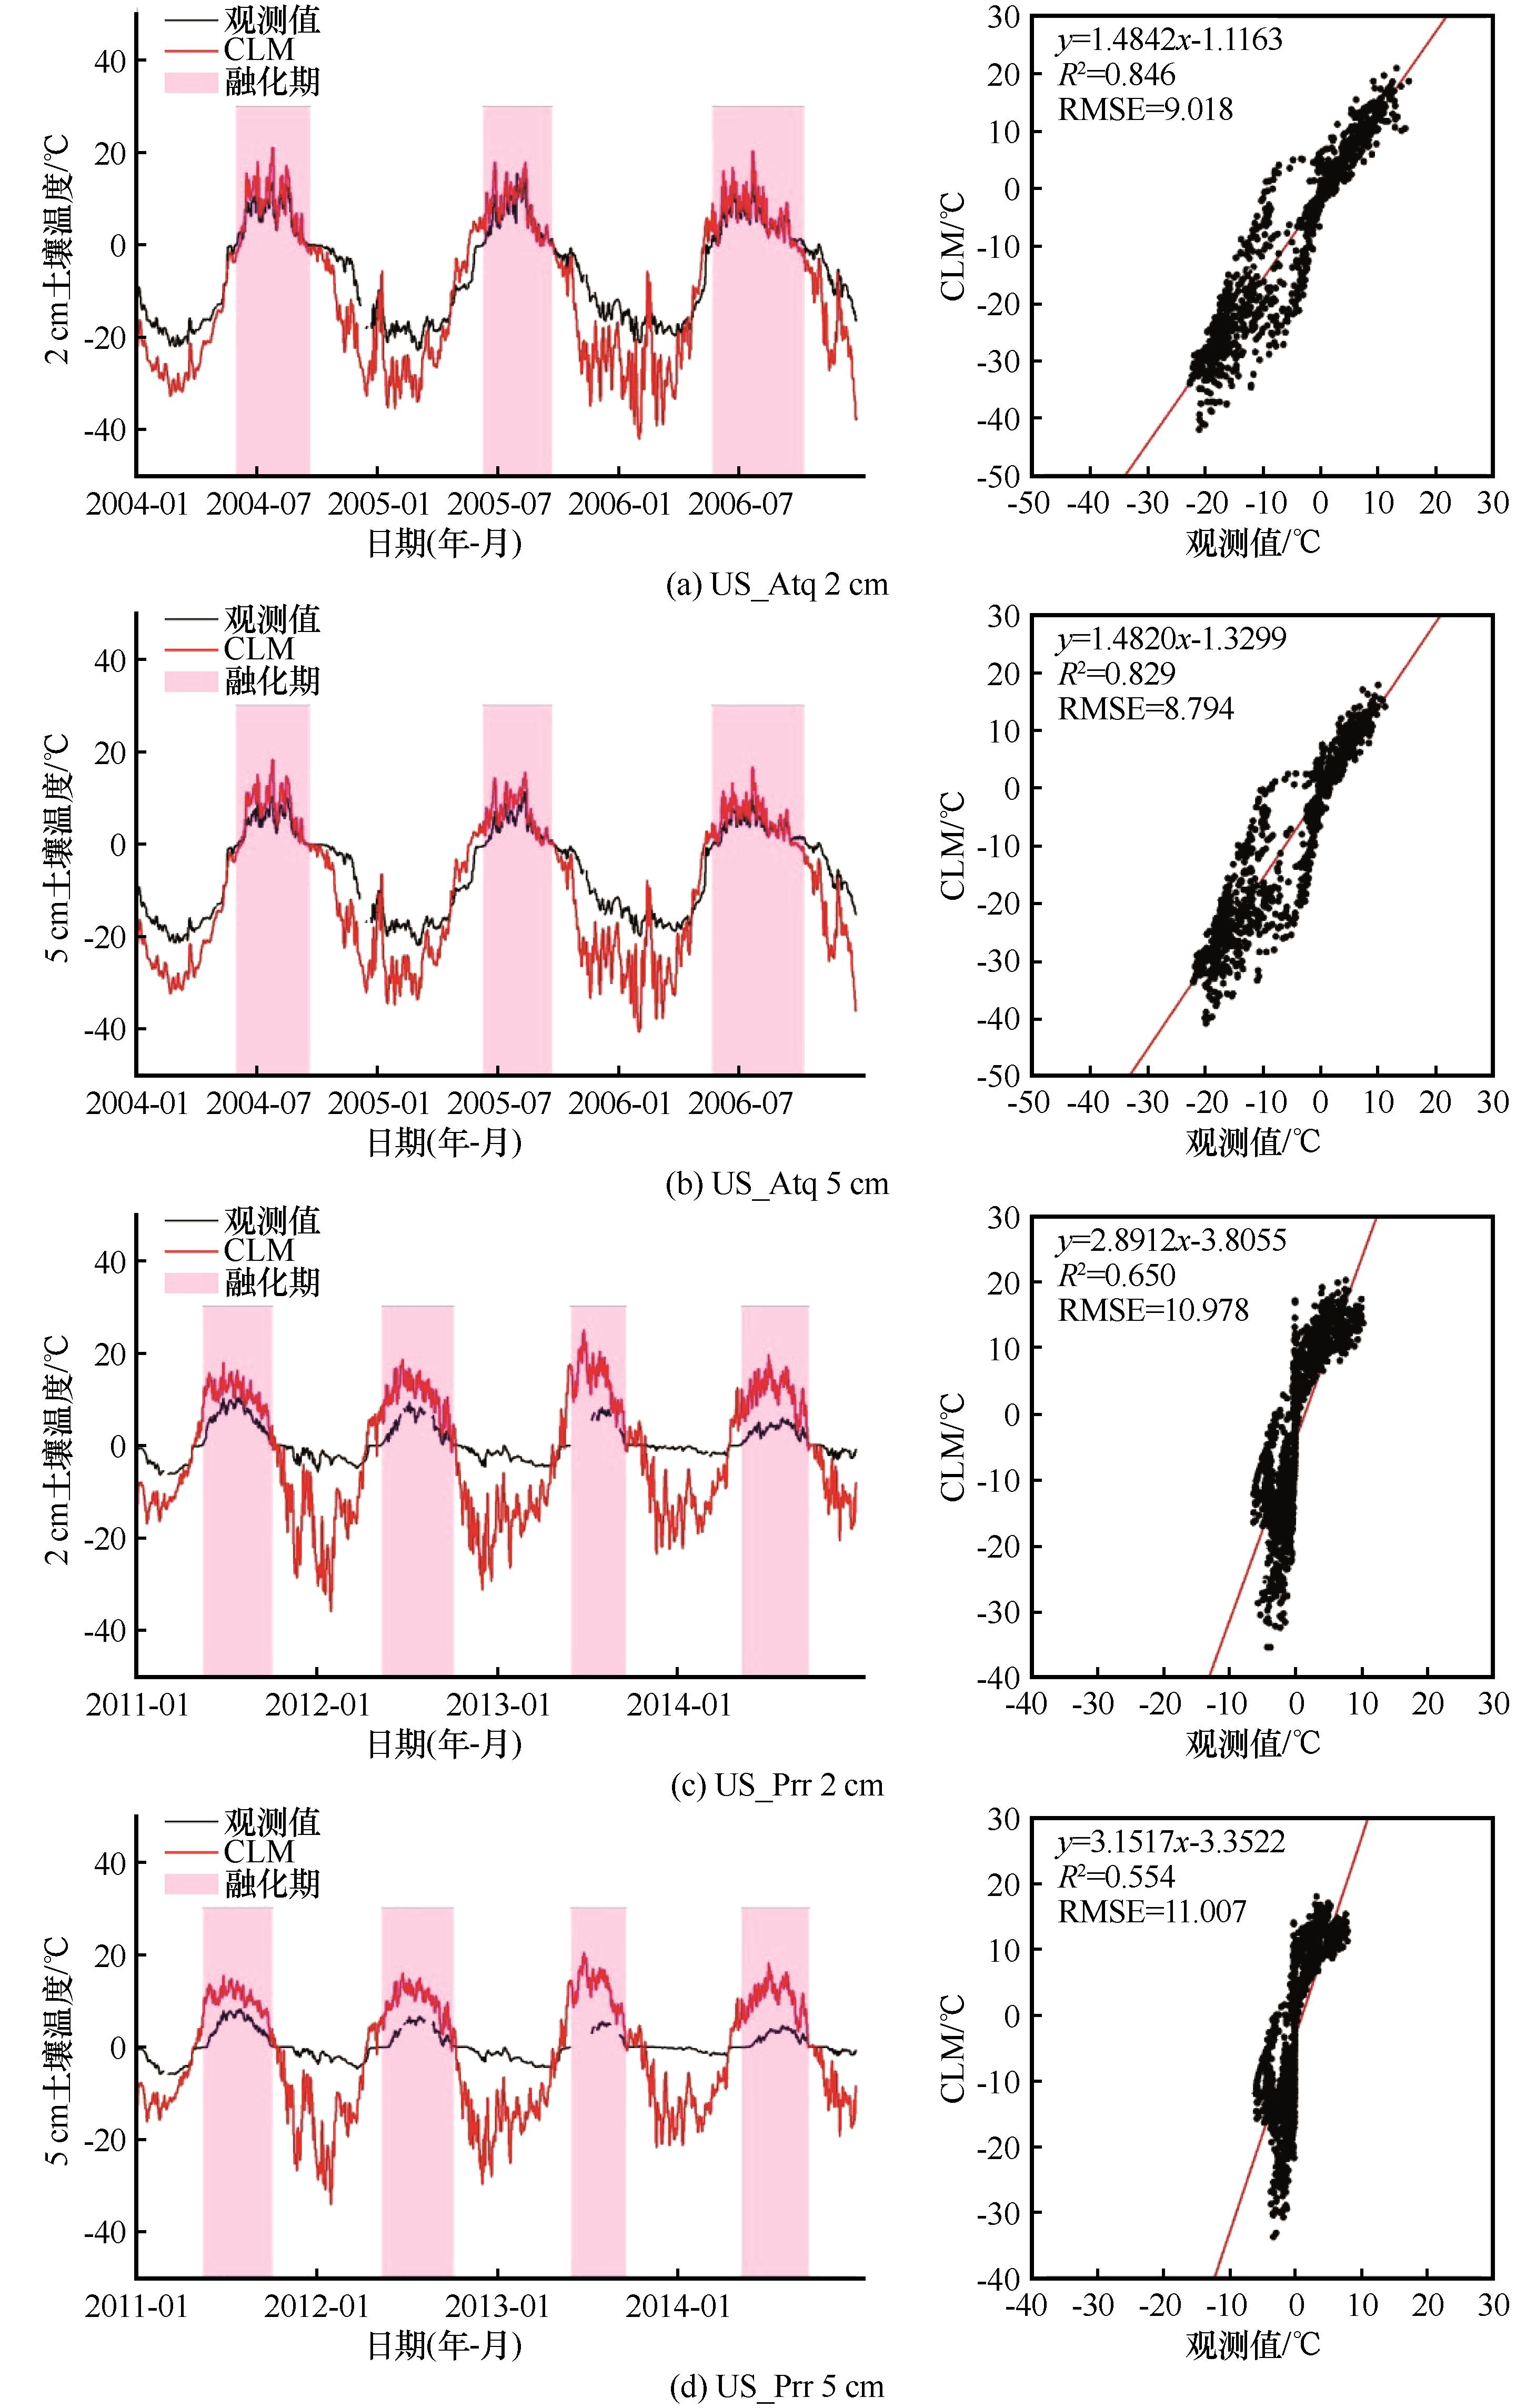
| 图2 站点模拟和观测的表层土壤温度[左图为模型模拟(红色线)和观测(黑色线)的表层土壤温度时间序列;右图为模拟和观测的散点图,红色直线为拟合线。其中,阴影表示融化期(使用2 cm深度土壤温度高于或低于0 ℃,来确定融化期的开始和结束日期[ |
| Fig. 2 Simulated and observed surface soil temperature [The left panels show time series of CLM simulations (red lines) and observed surface soil temperature (black lines); the right panels show scatter plots of CLM simulations and observed surface soil temperature, and the red lines are fitted lines. In this study, shading indicates the thawing period (The thaw start-date, thaw end-date, and thaw duration were calculated by determining daily soil temperature at a depth of 2 cm was above or below 0 ℃[ |
|
|