


0 引言
近半个世纪以来, 全球变暖使得更多的降水以降雨形式发生[7-10], 另一方面气温升高又加速了水循环过程, 使得冷季降水量及极端降雪呈现增加趋势[11-12]。因此, 相比于降雨, 降雪变化的不确定性和空间差异更大, 对气候变化的响应更为复杂, 是气候变化领域的研究热点之一。早期的大多数研究集中于气候变化背景下地表积雪(范围、 雪深及雪水当量)变化[13-14]、 降雪/降水比率变化[9-10]、 降雪量变化[15-16]及流域融雪径流变化特征等[17-18]。近十年极端气候事件频发, 极端降雪和强降雪事件也引起了国外学者的广泛关注: 大多数研究表明在气候变暖、 大气饱和比湿增加的气候背景下, 即使在一些降雪总量下降的区域, 极端和强降雪事件的频率和降雪强度仍呈现增加趋势, 并且这种增加趋势在一定温升范围内可能将会持续[11,19-20]; 强降雪和极端降雪的未来预估研究也在陆续开展[21]。
鉴于此, 本文拟基于中国西北干旱区气象站近40年(1971—2010年)的日气象观测资料, 采用百分比法确定每个站点的极端降雪事件阈值, 研究总降雪及极端降雪的变化特征及可能机理; 并采用IPCC-CMIP5 (the Fifth Phase of the Coupled Model Inter Comparison Project)气候情景数据探讨未来该区域总降雪和极端降雪量及发生次数的变化趋势; 该研究成果将为当地水资源管理及应对极端降雪灾害措施的制定提供参考依据。
1 研究区概况
中国西北干旱区包括新疆全境、 甘肃河西走廊、 青海祁连山地区、 内蒙古阿拉善高原及黄河宁夏段以西的宁夏部分地区(图1), 覆盖面积约2.19×10⁶ km2, 约占中国面积的22.8%。该区域地形复杂, 既横亘有3 000 m以上的山脉, 也有海拔在-156 ~ 500 m的内陆盆地。由于地处欧亚大陆中心, 距海较远, 境内四周又有阿尔泰山、 天山、 昆仑山和祁连山一系列巨大山脉的阻隔, 海洋湿润水汽很难到达, 气候十分干旱, 年平均降水量小于200 mm。其特殊的地理位置和地貌组成决定了该区域气候变化的复杂性, 是全球变化最敏感的区域之一[26], 尤其是20世纪80年代后期以来, 伴随着气温和降水的“突变性”增加, 西北干旱区极端气候水文事件的强度和频率呈明显增加趋势[27-28], 由此而引发的灾害损失也不断加大。
图1
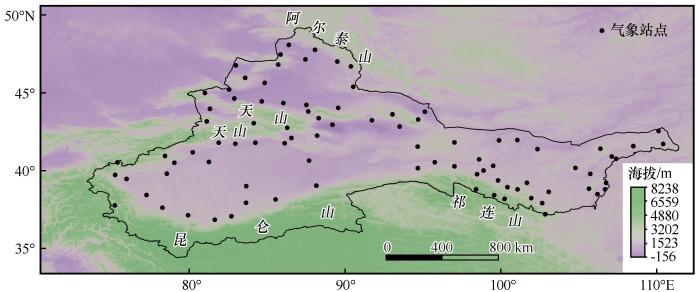
图1
中国西北干旱区边界和气象站点分布
Fig.1
The boundary of the arid areas of Northwest China and spatial distribution of meteorological stations
2 数据及方法
2.1 站点观测数据及气候情景数据
依据资料的连续性、 时段、 台站迁移等情况, 选取了1971—2010年研究区内89个气象站点日观测数据(日降水量、 平均气温、 相对湿度和气压)(图1)。数据来源于中国国家气象信息中心(
IPCC-CMIP5的全球气候模式(GCM)输出数据是进行未来气候变化预估的重要数据源, 目前参与CMIP5计划的GCM模式多达40个, 且不同模式输出的结果差异很大。本文从中选取了数据完整的24个GCMs, 并提取气象站点所在格网的基准期(1971—2005年)和RCP4.5排放情景下的21世纪中叶(2041—2070年)的模拟数据。分析冷季(降雪发生的主要时间段, 10月—次年3月)21世纪中叶相比基准期平均的气温和降水量变化情况, 从中选择了接近平均水平的4个GCMs模式开展降雪的未来变化研究(图2)。GCMs模式的模拟数据由CEDA(Centre for Environmental Data Analysis:
图2
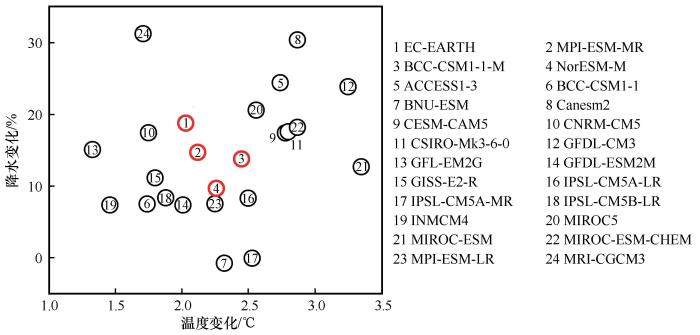
图2
RCP4.5情景下GCMs 模式预估的21世纪中叶(2041—2070年)冷季平均气温和降水相对于基准期(1971—2005年)的变化情况(红色标注的为选取的模式)
Fig.2
Station-averaged projected change in cold season average temperature and percent change in cumulative cold season precipitation between the historical (1971—2005) and midcentury (2041—2070) periods under RCP4.5 (the selected four GCMs were marked red)
2.2 降雪量及极端降雪阈值的计算
国家气象信息中心提供的气象数据在1979年后无降水类型(降雨/降雪/雨夹雪)标注, 故需依据其他气象要素观测数据对降水类型进行判识, 从而确定降雪量。本文采用Ding等[29]提出的多要素(湿球温度、 气压、 湿度及海拔)降水类型判别方案, 该方案对中国降水类型判识精度要明显高于其他临界温度阈值法。具体日降雪量(Ps )计算公式如下:
式中: P为观测的日降水量(mm); T0和
本文将连续多日有降雪且降雪量均大于有效降雪量(0.1 mm)的降雪日合并作为一次降雪事件, 累计该时段的降雪量为该降雪事件的降雪量, 并统计该降雪事件的持续日数及平均降雪强度(mm·d-1)。将每个台站1971—2010年有效降雪事件(降雪量≥0.1 mm)按升序排列, 并统计其累计频率(累计百分位), 以第95百分位所对应的降雪量作为该站点的极端降雪的阈值[30], 从而可获取每个站点的极端降雪事件及对应的降雪量。
2.3 GCM模式降尺度方法
GCM模式能够较好地模拟出大尺度的平均气候特征, 但输出结果的空间分辨率一般较低, 缺少区域气候信息, 难以对区域气候情景做出有效预估, 故常需要进行动力或统计降尺度。统计降尺度方法利用GCM历史模拟的气候要素与区域观测气象要素之间的数学关系, 并将这种关系应用到GCM输出的大尺度未来气候情景数据, 从而获得区域未来气候变化情景。该方法可以一定程度上修正GCM的系统误差, 且简单易行, 是目前应用最为广泛的一种降尺度方法。本研究采用QDM (bias-correction with quantile delta mapping)统计降尺度方法[31-33]对GCMs模式的输出数据进行降尺度, 该方法已被验证能较好地获取极端气候信息[31-32], 具体计算方案如下:
2.4 克劳修斯-克拉伯龙方程
克劳修斯-克拉伯龙方程(CC: Clausius-Clapeyron)是目前解释降水和极端降水强度随气温变化的物理基础, 本文尝试采用该方程来探讨我国西北干旱区降雪对气候变化的响应机理。CC方程表达了大气饱和水汽压(es)与气温(T)之间的数值联系, 其公式如下:
式中: lv为汽化潜热(0 ℃时水的汽化潜热值为2.5×10⁶ J·kg-1); Rv为气体常数(461.5 J·kg-1·K-1)。
3 结果分析
3.1 西北干旱区降雪时空变化特征
图3
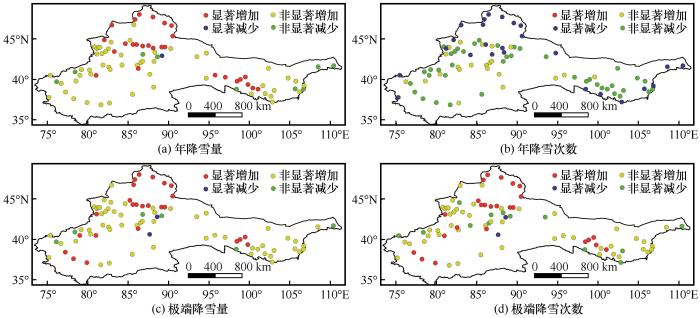
图3
1971—2010年中国西北干旱区年降雪量(a)、 年降雪次数(b)、 极端降雪量(c)和极端降雪次数(d)变化趋势的空间分布(P≤0.05为显著)
Fig.3
Spatial distribution of the trends of annual snowfall amount (a), occurrences of snowfall (b), the extreme snowfall amount (c) and occurrences of the extreme snowfall (d) in the arid areas of Northwest China during the period of 1971—2010 (P≤0.05 is considered statistically significant)
进一步分析区域平均的年降雪量及发生次数的变化趋势(图4), 可以看出, 1971—2010年期间西北干旱区年降雪量以2.8 mm·(10a)-1的速率呈明显的增加趋势, 但年降雪次数以-1.4次·(10a)-1的速率呈明显的减少趋势。年极端降雪量及发生次数均呈现一个明显增加趋势, 其中极端降雪量的增加速率为2.1 mm·(10a)-1, 极端降雪发生次数的增加速率为0.14次·(10a)-1。西北干旱区年极端降雪发生次数仅占总降雪次数的2.4%, 但其对年降雪量的平均贡献可达1/4, 且近40年极端降雪量的增加是年降雪量增加的主要原因(约贡献了73%的增加量)。
图4
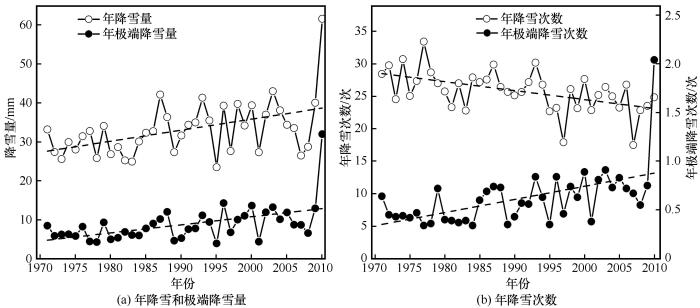
图4
1971—2010年中国西北干旱区平均的年降雪和极端降雪量(a)及降雪次数的年际变化(b)
Fig.4
The inter-annual variations of mean annual total and extreme snowfall amount (a) and occurrences of snowfall and extreme snowfall (b) in the arid areas of Northwest China during the period of 1971—2010
3.2 极端降雪事件对气候变暖的响应机理
图5
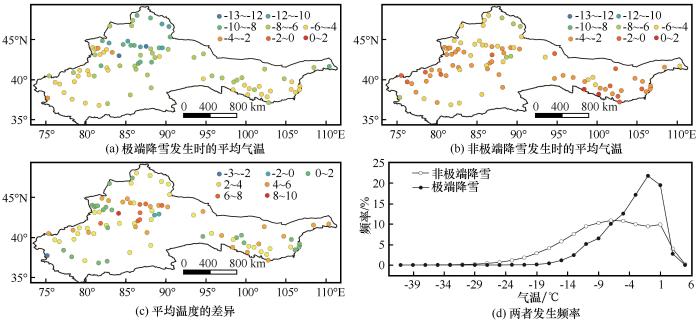
图5
极端与非极端降雪发生时的平均气温(a、 b), 极端降雪与非极端降雪发生时平均温度的差异(c)以及在不同温度区间两者发生频率的分布(d)
Fig.5
Average temperature coincident with extreme and other snowfall events (a, b), difference between temperature coincident with extreme and other snowfall events (c) and the frequency distribution of extreme and other snowfall events within different temperature ranges (d)
为了探讨我国西北干旱区降雪强度随气温变化的特征及其是否符合CC方程理论, 本文统计了每个温度区间(1 ℃间隔)平均降雪强度与气温的关系(图6)。从图上可以看出, 当气温高于1 ℃, 降雪强度会随气温的升高而快速下降, 这主要由于在该气温区间, 温度的进一步升高会使得更多降水以混合态降水形式发生; 而当气温低于1 ℃时, 降雪强度随气温升高而增大, 该变化特征基本符合CC方程。此外在极端降雪事件集中的气温区间内(-7.5 ~ 1.0 ℃), 降雪强度随气温的升高而快速增加, 气温每升高1 ℃, 降雪强度平均约增加8.6%, 该值要稍高于CC比率; 而在气温低于-7.5 ℃的温度区间, 降雪强度随气温升高的增加幅度相对较小, 气温每升高1 ℃, 降雪强度平均增加约3.2%。这也表明极端降雪的强度随温度升高而增加的幅度要明显大于非极端降雪。
图6
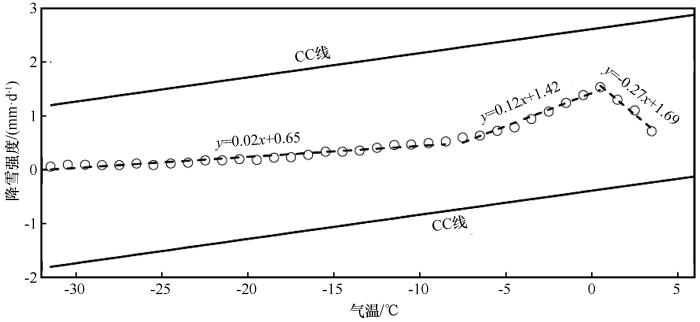
图6
中国西北干旱区平均降雪强度与气温的关系
Fig.6
Relationship between averaged snowfall intensity and air temperature in the arid areas of Northwest China
综上所述, 中国西北干旱区的降雪强度在1 ℃气温以下会随温度升高而增大, 在一定温度范围内的升温有利于极端降雪事件的发生, 故气候变暖是过去40年西北干旱区极端降雪事件增加的主要原因。
3.3 未来降雪变化预估
本文采用QDM方法将站点邻近的GCMs格网数据降尺度到站点, 从而获得站点未来日气候预估情景数据。图7展示了西北干旱区1971—2100年降尺度的4个GCMs模拟和基准期观测的年降雪量和极端降雪量及发生次数的变化趋势。可以看出, 降尺度后的GCMs数据能够较好地重现基准期的年降雪量和极端降雪的量及发生次数的变化特征, 且GCMs模拟的多年平均的降雪量及发生次数与观测值之间的相对误差小于10%, 故采用该降尺度方法获取的GCMs模拟的站点数据可用于分析未来降雪的变化趋势。进一步分析表明, 在RCP4.5情景下, 未来年降雪次数将继续呈现明显下降趋势[图7(c)], 尽管预估的未来冷季降水量将增加(图2), 但由于气温的升高, 降雪/降水比率下降, 西北干旱区年降雪量预计在(2040±5)年前后将开始缓慢下降[图7(a)]; 年极端降雪量与发生次数的变化趋势极为相似[图7(b)和(d)], 预计(2060±5)年左右达到峰值, 随后将开始缓慢减少, 这明显要晚于年降雪量拐点出现的时间。
图7
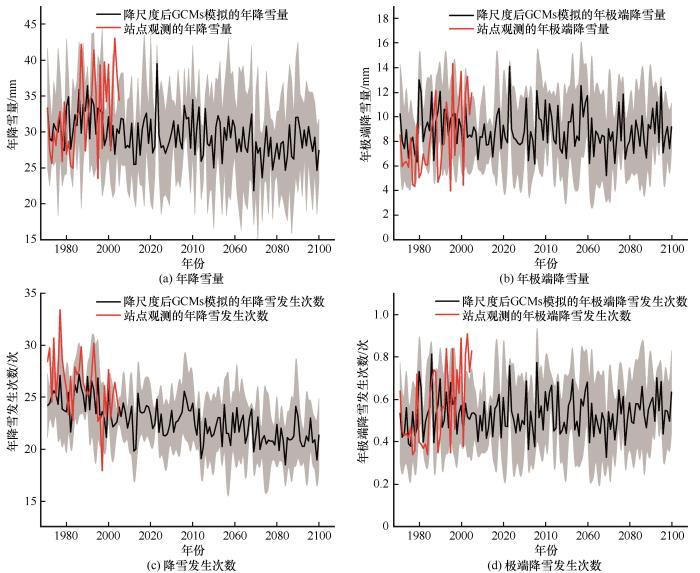
图7
西北干旱区平均的年降雪量(a)、 年极端降雪量(b)、 降雪发生次数(c)和极端降雪发生次数(d)的历史及未来的变化(黑色线为4个模式模拟结果的平均值, 灰色部分为4个模式模拟结果的范围)
Fig.7
The inter-annual variations of historical and future mean annual snowfall amount (a), extreme snowfall amount (b), occurrences of snowfall (c) and occurrences of extreme snowfall (d) in the arid areas of Northwest China (solid balck lines represent represents the ensemble means, and the gray swath represents the spans of results from 4 GCMs)
图8显示了4个模式预估的我国西北干旱区2050s(2041—2060年)平均年降雪量、 极端降雪量及发生次数相比基准期(1971—2005年)的变化情况。到2050s, 西北干旱区所有站点的年降雪发生次数都将明显减少, 区域站点平均的年降雪发生次数约减少11%, 相当于2.6次[图8(b)]; 约55%的站点年降雪量相比基准期稍有减少, 整个区域站点平均的年降雪量减少5%, 减少的站点主要集中于伊犁河谷及河西走廊[图8(a)]。但到2050s, 西北干旱区仍约有60%站点的极端降雪量和发生次数相比基准期均有所增加, 减少的站点也主要位于伊犁河谷及祁连山中高山带, 区域站点平均的年极端降雪量和降雪次数相比基准期约分别增加2%和4%[图8(c)和(d)]。
图8
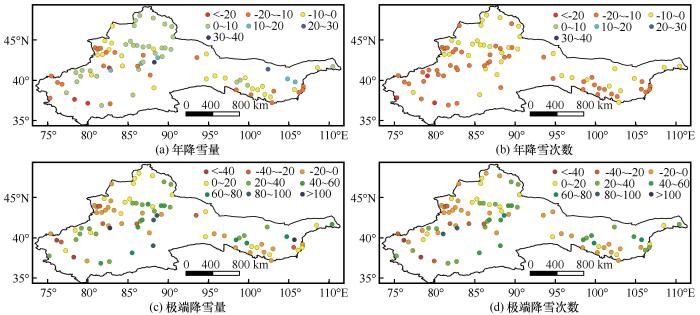
图8
RCP4.5气候情景下, 2050s西北干旱区年降雪量(a)、 年降雪次数(b)、 极端降雪量(c)和极端降雪次数(d)相比基准期的变化
Fig.8
Percentage change in annual snowfall amount (a), occurrences of snowfall (b), extreme snowfall amount (c) and occurrences of extreme snowfall (d) between baseline time period and 2050s under RCP4.5 climate scenario
4 结论
(1)1971—2010年中国西北干旱区尽管站点的年降雪次数呈现明显减少趋势, 但年降雪量总体呈现明显增加趋势; 极端降雪量和发生次数均呈现增加趋势。尽管年极端降雪发生次数占总降雪次数的比例不足3%, 但其对年降雪量的平均贡献可达1/4, 极端降雪量的增加是近40 a西北干旱区降雪总量增加的主要原因。
(2)西北干旱区极端降雪发生时的平均气温要明显高于非极端降雪事件发生时的气温, 平均高3.3 ℃; 当气温低于1 ℃, 平均降雪强度随温度的升高而增大(3.1%·℃-1 ~ 8.6%·℃-1), 基本符合克劳修斯-克拉伯龙方程, 故过去40 a气候变暖是导致西北干旱区极端降雪量显著增加的主要原因。
(3)IPCC-CMIP5的4个GCMs的预估数据表明, RCP4.5气候情景下, 西北干旱区年降雪次数未来将大幅度减少。由于气温的升高, 降雪/降水比率下降, 年降雪量将在(2040±5)年前后达到峰值, 而年极端降雪量和发生次数预计(2060±5)年左右达到峰值。相比基准期, 到本世纪中期, 西北干旱区所有站点的年降雪发生次数均将明显减少, 平均约减少11%, 超过55%站点的年降雪量将有所减少, 整个区域站点平均减少5%; 但仍有60%左右的站点年极端降雪量和发生次数有所增加, 整个区域站点平均的年极端降雪量和发生次数约分别增加2%和4%。
参考文献
Spatial and temporal variation of snow cover over Northern hemisphere using Modis snow products
[J].
基于MODIS雪产品的北半球积雪时空分布变化特征分析
[J].
Global warming due to increasing absorbed solar radiation
[J].
Potential impacts of a warming climate on water availability in snow-dominated regions
[J].
Hydrogeologic influence on changes in snowmelt runoff with climate warming: Numerical experiments on a mid-elevation catchment in the Sierra Nevada, USA
[J].
The responses of glaciers and snow cover to climate change in Xinjiang (II): Hazards effects
[J].
新疆冰川、 积雪对气候变化的响应(II): 灾害效应
[J].
A spatial and temporal analysis of damaging snowstorms in the United States
[J].
Change of snowfall/rainfall ratio in the Tibetan Plateau based on a gridded dataset with high resolution during 1961-2013
[J].
基于高分辨率格点数据的1961—2013年青藏高原雪雨比变化
[J].
Change of snowfall/rainfall ratio in Xinjiang during the period of 1961-2013
[J].
1961—2013年新疆雪雨比变化
[J].
Seasonal trends and temperature dependence of the snowfall/precipitation-day ratio in Switzerland
[J].
Long-term variability of occurrence of precipitation forms in winter in Kraków, Poland
[J].
Contrasting responses of mean and extreme snowfall to climate change
[J].
More extreme precipitation in the world’s dry and wet regions
[J].
Estimating the rates of mass change, ice volume change and snow volume change in Greenland from ICESat and GRACE data
[J].
Seasonal snow cover regime and historical change in Central Asia from 1986 to 2008
[J].
Insignificant change in Antarctic snowfall since the International Geophysical Year
[J].
Future changes in northern hemisphere snowfall
[J].
Changes in snowmelt runoff timing in western North America under a “Business as Usual” climate change scenario
[J].
Modeling snowmelt-runoff under climate scenarios in the Hunza River basin, Karakoram Range, Northern Pakistan
[J].
Decreasing spatial dependence in extreme snowfall in the French Alps since 1958 under climate change
[J].
Evaluation of probable maximum snow accumulation: Development of a methodology for climate change studies
[J].
Projected changes in snowfall extremes and interannual variability of snowfall in the western U.S
[J].
Spatiotemporal variation and regional distribution characteristics of snowfall in China from 1970 to 2000
[J].
1970—2000年中国降雪量变化和区域性分布特征
[J].
Spatio-temporal variation analysis of snow cover area of Tianshan Mountains in China using MODIS data
[J].
基于MODIS数据中国天山积雪面积时空变化特征分析
[J].
Variation characteristics of different levels of snow in Liaoning Province
[J].
辽宁省不同等级降雪变化特征
[J].
Spatial‐temporal features of intense snowfall events in China and their possible change
[J].
Ponder on the issue of water resources in the arid region of Northwest China
[J].
西北干旱区水资源问题研究思考
[J].
Characteristics and effects of the extreme maximum air temperature in the summer of 2015 in Xinjiang under global warming
[J].
气候变暖背景下2015年夏季新疆极端高温过程及其影响
[J].
Characteristics of extreme climatic/hydrological events in the arid region of northwestern China
[J].
西北干旱区极端气候水文事件特征分析
[J].
The dependence of precipitation types on surface elevation and meteorological conditions and its parameterization
[J].
Comparative study of calculated threshold values in regional extreme precipitation
[J].
区域极端降水事件阈值计算方法比较分析
[J].
Bias Correction of GCM precipitation by quantile mapping: How well do methods preserve changes in quantiles and extremes?
[J].
Intercomparison of projected changes in climate extremes for South Korea: application of trend preserving statistical downscaling methods to the CMIP5 ensemble
[J].
Extreme high‐temperature events over East Asia in 1.5 °C and 2 °C warmer futures: Analysis of NCAR CESM low‐warming experiments
[J].
Relationship between surface temperature and extreme rainfalls: A multi-time-scale and event-based analysis
[J].
A U.S.-based analysis of the ability of the Clausius-Clapeyron relationship to explain changes in extreme rainfall with changing temperature
[J].
Temperature influences on intense UK hourly precipitation and dependency on large-scale circulation
[J].
Does higher surface temperature intensify extreme precipitation?
[J].
Does storm duration modulate the extreme precipitation-temperature scaling relationship?
[J].

 甘公网安备 62010202000676号