Glaciers in the Earth’s hydrological cycle: assessments of glacier mass and runoff changes on global and regional scales
1
2014
... 冰川不仅是重要的淡水资源[1-2],还是气候变化的敏感指示器[3-5].祁连山位于青藏高原东北缘,地处我国西北干旱半干旱区,共发育有现代冰川2 821条,总面积为1 986.94 km2[6].发源于祁连山的冰川融水径流是河西走廊和柴达木盆地重要的淡水来源.近年来,在气候变暖的大背景下,青藏高原大部分地区的冰川消融强烈[7-9].祁连山地区的冰川也经历了不同程度的退缩[10-18],严重威胁流域内的生产和生活用水安全[15,19].因此,祁连山地区冰川物质平衡的研究对流域内水资源的分配和利用具有重要的指导意义.此外,祁连山还是我国现代冰川研究的起源之地.1958年施雅风先生领导组织高山冰雪利用研究队在祁连山开展大规模考察,出版了《祁连山现代冰川考察报告》[20],开启了我国现代冰川研究的先河.李吉均先生作为主要成员参加了祁连山现代冰川考察工作,自此也开启了他本人的现代冰川研究生涯,之后在青藏高原各地进行冰川研究工作,出版了《西藏冰川》[21]等著作,为推动我国现代冰川研究作出了杰出贡献.2020年7月21日先生不幸仙逝,谨以此文致以缅怀. ...
Importance of snow and glacier meltwater for agriculture on the Indo-Gangetic Plain
1
2019
... 冰川不仅是重要的淡水资源[1-2],还是气候变化的敏感指示器[3-5].祁连山位于青藏高原东北缘,地处我国西北干旱半干旱区,共发育有现代冰川2 821条,总面积为1 986.94 km2[6].发源于祁连山的冰川融水径流是河西走廊和柴达木盆地重要的淡水来源.近年来,在气候变暖的大背景下,青藏高原大部分地区的冰川消融强烈[7-9].祁连山地区的冰川也经历了不同程度的退缩[10-18],严重威胁流域内的生产和生活用水安全[15,19].因此,祁连山地区冰川物质平衡的研究对流域内水资源的分配和利用具有重要的指导意义.此外,祁连山还是我国现代冰川研究的起源之地.1958年施雅风先生领导组织高山冰雪利用研究队在祁连山开展大规模考察,出版了《祁连山现代冰川考察报告》[20],开启了我国现代冰川研究的先河.李吉均先生作为主要成员参加了祁连山现代冰川考察工作,自此也开启了他本人的现代冰川研究生涯,之后在青藏高原各地进行冰川研究工作,出版了《西藏冰川》[21]等著作,为推动我国现代冰川研究作出了杰出贡献.2020年7月21日先生不幸仙逝,谨以此文致以缅怀. ...
Sensitivity of glaciers and small ice caps to greenhouse warming
1
1992
... 冰川不仅是重要的淡水资源[1-2],还是气候变化的敏感指示器[3-5].祁连山位于青藏高原东北缘,地处我国西北干旱半干旱区,共发育有现代冰川2 821条,总面积为1 986.94 km2[6].发源于祁连山的冰川融水径流是河西走廊和柴达木盆地重要的淡水来源.近年来,在气候变暖的大背景下,青藏高原大部分地区的冰川消融强烈[7-9].祁连山地区的冰川也经历了不同程度的退缩[10-18],严重威胁流域内的生产和生活用水安全[15,19].因此,祁连山地区冰川物质平衡的研究对流域内水资源的分配和利用具有重要的指导意义.此外,祁连山还是我国现代冰川研究的起源之地.1958年施雅风先生领导组织高山冰雪利用研究队在祁连山开展大规模考察,出版了《祁连山现代冰川考察报告》[20],开启了我国现代冰川研究的先河.李吉均先生作为主要成员参加了祁连山现代冰川考察工作,自此也开启了他本人的现代冰川研究生涯,之后在青藏高原各地进行冰川研究工作,出版了《西藏冰川》[21]等著作,为推动我国现代冰川研究作出了杰出贡献.2020年7月21日先生不幸仙逝,谨以此文致以缅怀. ...
Contrasting glacier responses to recent climate change in High-Mountain Asia
1
2017
... 冰川不仅是重要的淡水资源[1-2],还是气候变化的敏感指示器[3-5].祁连山位于青藏高原东北缘,地处我国西北干旱半干旱区,共发育有现代冰川2 821条,总面积为1 986.94 km2[6].发源于祁连山的冰川融水径流是河西走廊和柴达木盆地重要的淡水来源.近年来,在气候变暖的大背景下,青藏高原大部分地区的冰川消融强烈[7-9].祁连山地区的冰川也经历了不同程度的退缩[10-18],严重威胁流域内的生产和生活用水安全[15,19].因此,祁连山地区冰川物质平衡的研究对流域内水资源的分配和利用具有重要的指导意义.此外,祁连山还是我国现代冰川研究的起源之地.1958年施雅风先生领导组织高山冰雪利用研究队在祁连山开展大规模考察,出版了《祁连山现代冰川考察报告》[20],开启了我国现代冰川研究的先河.李吉均先生作为主要成员参加了祁连山现代冰川考察工作,自此也开启了他本人的现代冰川研究生涯,之后在青藏高原各地进行冰川研究工作,出版了《西藏冰川》[21]等著作,为推动我国现代冰川研究作出了杰出贡献.2020年7月21日先生不幸仙逝,谨以此文致以缅怀. ...
3
2008
... 冰川不仅是重要的淡水资源[1-2],还是气候变化的敏感指示器[3-5].祁连山位于青藏高原东北缘,地处我国西北干旱半干旱区,共发育有现代冰川2 821条,总面积为1 986.94 km2[6].发源于祁连山的冰川融水径流是河西走廊和柴达木盆地重要的淡水来源.近年来,在气候变暖的大背景下,青藏高原大部分地区的冰川消融强烈[7-9].祁连山地区的冰川也经历了不同程度的退缩[10-18],严重威胁流域内的生产和生活用水安全[15,19].因此,祁连山地区冰川物质平衡的研究对流域内水资源的分配和利用具有重要的指导意义.此外,祁连山还是我国现代冰川研究的起源之地.1958年施雅风先生领导组织高山冰雪利用研究队在祁连山开展大规模考察,出版了《祁连山现代冰川考察报告》[20],开启了我国现代冰川研究的先河.李吉均先生作为主要成员参加了祁连山现代冰川考察工作,自此也开启了他本人的现代冰川研究生涯,之后在青藏高原各地进行冰川研究工作,出版了《西藏冰川》[21]等著作,为推动我国现代冰川研究作出了杰出贡献.2020年7月21日先生不幸仙逝,谨以此文致以缅怀. ...
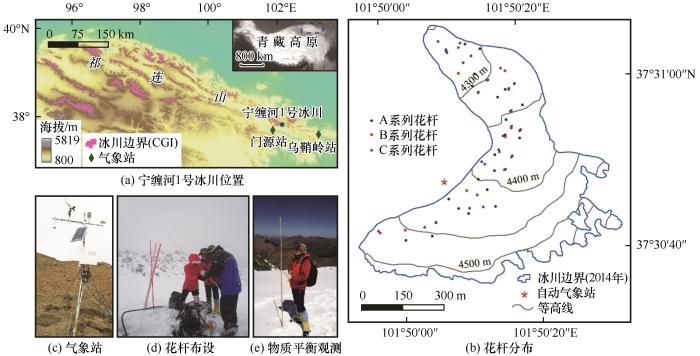
... 冷龙岭位于祁连山东段,第一次冰川编目(CGI1)数据显示,此处发育现代冰川244条,其中南坡103条,冰川融水流入大通河,最后注入黄河,属于黄河流域;北坡141条,属内陆水系,注入石羊河[6].NC01冰川位于冷龙岭北坡[图1(a)],属于亚大陆型山地冰川,冰川面积为0.77 km2[6],海拔范围为4 260~4 640 m,冰面表碛覆盖较少.Cao等[36]在2014年8月对NC01冰川的厚度进行了测量,发现NC01冰川平均冰厚约24 m,最大厚度为65 m,总冰量约9.36×10⁶ m3.NC01冰川受东亚季风和西风带的共同控制[37].2010年建立在NC01冰川侧碛垄上(4 450 m)的自动气象站[图1(c)]显示,NC01冰川附近的年平均气温约为-6.0 ℃,年平均降水量>800 mm,降水主要集中在6—8月的夏季[36].近年来的研究显示,在过去的几十年,NC01冰川快速退缩,且退缩速率呈加速趋势[14,16].2010—2015年,NC01冰川物质平衡线平均高度约为4 680 m,已超过了冰川的最高海拔[36].NC01冰川融水经宁缠河最终汇入甘肃三大内陆河之一的石羊河. ...
... 2[6],海拔范围为4 260~4 640 m,冰面表碛覆盖较少.Cao等[36]在2014年8月对NC01冰川的厚度进行了测量,发现NC01冰川平均冰厚约24 m,最大厚度为65 m,总冰量约9.36×10⁶ m3.NC01冰川受东亚季风和西风带的共同控制[37].2010年建立在NC01冰川侧碛垄上(4 450 m)的自动气象站[图1(c)]显示,NC01冰川附近的年平均气温约为-6.0 ℃,年平均降水量>800 mm,降水主要集中在6—8月的夏季[36].近年来的研究显示,在过去的几十年,NC01冰川快速退缩,且退缩速率呈加速趋势[14,16].2010—2015年,NC01冰川物质平衡线平均高度约为4 680 m,已超过了冰川的最高海拔[36].NC01冰川融水经宁缠河最终汇入甘肃三大内陆河之一的石羊河. ...
The state and fate of Himalayan glaciers
1
2012
... 冰川不仅是重要的淡水资源[1-2],还是气候变化的敏感指示器[3-5].祁连山位于青藏高原东北缘,地处我国西北干旱半干旱区,共发育有现代冰川2 821条,总面积为1 986.94 km2[6].发源于祁连山的冰川融水径流是河西走廊和柴达木盆地重要的淡水来源.近年来,在气候变暖的大背景下,青藏高原大部分地区的冰川消融强烈[7-9].祁连山地区的冰川也经历了不同程度的退缩[10-18],严重威胁流域内的生产和生活用水安全[15,19].因此,祁连山地区冰川物质平衡的研究对流域内水资源的分配和利用具有重要的指导意义.此外,祁连山还是我国现代冰川研究的起源之地.1958年施雅风先生领导组织高山冰雪利用研究队在祁连山开展大规模考察,出版了《祁连山现代冰川考察报告》[20],开启了我国现代冰川研究的先河.李吉均先生作为主要成员参加了祁连山现代冰川考察工作,自此也开启了他本人的现代冰川研究生涯,之后在青藏高原各地进行冰川研究工作,出版了《西藏冰川》[21]等著作,为推动我国现代冰川研究作出了杰出贡献.2020年7月21日先生不幸仙逝,谨以此文致以缅怀. ...
Different glacier status with atmospheric circulations in Tibetan Plateau and surroundings
1
2012
... 在目前研究中,“冰川学方法”和“大地测量法”是最常用的两种获得冰川物质平衡的方法[22-23].“冰川学方法”指通过在冰面布设花杆,观测花杆处的积累和消融,进而获得整个冰川物质平衡的方法[24-25].“大地测量法”指通过代表不同时期冰面高程的数字高程模型(DEM)之间的高程差获得冰川物质平衡的方法[26].相较于“大地测量法”,“冰川学方法”能够最直接获得精度较高的测量数据[22,25,27],适合用于冰川物质平衡的长期监测.然而,受高海拔地区极端气候以及地形等条件的限制,有物质平衡直接观测的冰川较少,有长时间连续物质平衡观测的冰川更为匮乏[8,28]. ...
全球变暖背景下青藏高原及周边地区冰川变化的时空格局与趋势及影响
1
2019
... 冰川不仅是重要的淡水资源[1-2],还是气候变化的敏感指示器[3-5].祁连山位于青藏高原东北缘,地处我国西北干旱半干旱区,共发育有现代冰川2 821条,总面积为1 986.94 km2[6].发源于祁连山的冰川融水径流是河西走廊和柴达木盆地重要的淡水来源.近年来,在气候变暖的大背景下,青藏高原大部分地区的冰川消融强烈[7-9].祁连山地区的冰川也经历了不同程度的退缩[10-18],严重威胁流域内的生产和生活用水安全[15,19].因此,祁连山地区冰川物质平衡的研究对流域内水资源的分配和利用具有重要的指导意义.此外,祁连山还是我国现代冰川研究的起源之地.1958年施雅风先生领导组织高山冰雪利用研究队在祁连山开展大规模考察,出版了《祁连山现代冰川考察报告》[20],开启了我国现代冰川研究的先河.李吉均先生作为主要成员参加了祁连山现代冰川考察工作,自此也开启了他本人的现代冰川研究生涯,之后在青藏高原各地进行冰川研究工作,出版了《西藏冰川》[21]等著作,为推动我国现代冰川研究作出了杰出贡献.2020年7月21日先生不幸仙逝,谨以此文致以缅怀. ...
Glacier changes in the Qilian Mountains in the past half-century: based on the revised first and second Chinese glacier inventory
1
2018
... 冰川不仅是重要的淡水资源[1-2],还是气候变化的敏感指示器[3-5].祁连山位于青藏高原东北缘,地处我国西北干旱半干旱区,共发育有现代冰川2 821条,总面积为1 986.94 km2[6].发源于祁连山的冰川融水径流是河西走廊和柴达木盆地重要的淡水来源.近年来,在气候变暖的大背景下,青藏高原大部分地区的冰川消融强烈[7-9].祁连山地区的冰川也经历了不同程度的退缩[10-18],严重威胁流域内的生产和生活用水安全[15,19].因此,祁连山地区冰川物质平衡的研究对流域内水资源的分配和利用具有重要的指导意义.此外,祁连山还是我国现代冰川研究的起源之地.1958年施雅风先生领导组织高山冰雪利用研究队在祁连山开展大规模考察,出版了《祁连山现代冰川考察报告》[20],开启了我国现代冰川研究的先河.李吉均先生作为主要成员参加了祁连山现代冰川考察工作,自此也开启了他本人的现代冰川研究生涯,之后在青藏高原各地进行冰川研究工作,出版了《西藏冰川》[21]等著作,为推动我国现代冰川研究作出了杰出贡献.2020年7月21日先生不幸仙逝,谨以此文致以缅怀. ...
Climate change and glacier area shrinkage in the Qilian Mountains, China, from 1956 to 2010
0
2014
2000-2010年祁连山冰川冰储量变化
0
2018
2000-2010年祁连山冰川冰储量变化
0
2018
利用卫星资料反演区域冰川冰量变化的尝试: 以祁连山为例
0
2013
利用卫星资料反演区域冰川冰量变化的尝试: 以祁连山为例
0
2013
Changes in the glacier extent and surface elevation along the Ningchan and Shuiguan River source, eastern Qilian Mountains, China
2
2014
... 冷龙岭位于祁连山东段,第一次冰川编目(CGI1)数据显示,此处发育现代冰川244条,其中南坡103条,冰川融水流入大通河,最后注入黄河,属于黄河流域;北坡141条,属内陆水系,注入石羊河[6].NC01冰川位于冷龙岭北坡[图1(a)],属于亚大陆型山地冰川,冰川面积为0.77 km2[6],海拔范围为4 260~4 640 m,冰面表碛覆盖较少.Cao等[36]在2014年8月对NC01冰川的厚度进行了测量,发现NC01冰川平均冰厚约24 m,最大厚度为65 m,总冰量约9.36×10⁶ m3.NC01冰川受东亚季风和西风带的共同控制[37].2010年建立在NC01冰川侧碛垄上(4 450 m)的自动气象站[图1(c)]显示,NC01冰川附近的年平均气温约为-6.0 ℃,年平均降水量>800 mm,降水主要集中在6—8月的夏季[36].近年来的研究显示,在过去的几十年,NC01冰川快速退缩,且退缩速率呈加速趋势[14,16].2010—2015年,NC01冰川物质平衡线平均高度约为4 680 m,已超过了冰川的最高海拔[36].NC01冰川融水经宁缠河最终汇入甘肃三大内陆河之一的石羊河. ...
... 先前的研究表明,每上升1 ℃需要增加25%的降水才能弥补气温升高造成的冰川消融[49].此外,气温升高会导致降水中液态降水的比例增加,使得冰面反照率减小进而加速冰川表面消融[50].1972年以来NC01冰川整体呈退缩趋势,且2008—2020年冰川退缩速率(7.54 m·a-1)明显高于1970—2010年(4.50 m·a-1)[14].这可能与近年来气温的明显升高有关,气温升高带来的消融量远大于降水增加带来的积累量. ...
Changes in glacier mass in the Lenglongling Mountains from 1972 to 2016 based on remote sensing data and modeling
2
2019
... 冰川不仅是重要的淡水资源[1-2],还是气候变化的敏感指示器[3-5].祁连山位于青藏高原东北缘,地处我国西北干旱半干旱区,共发育有现代冰川2 821条,总面积为1 986.94 km2[6].发源于祁连山的冰川融水径流是河西走廊和柴达木盆地重要的淡水来源.近年来,在气候变暖的大背景下,青藏高原大部分地区的冰川消融强烈[7-9].祁连山地区的冰川也经历了不同程度的退缩[10-18],严重威胁流域内的生产和生活用水安全[15,19].因此,祁连山地区冰川物质平衡的研究对流域内水资源的分配和利用具有重要的指导意义.此外,祁连山还是我国现代冰川研究的起源之地.1958年施雅风先生领导组织高山冰雪利用研究队在祁连山开展大规模考察,出版了《祁连山现代冰川考察报告》[20],开启了我国现代冰川研究的先河.李吉均先生作为主要成员参加了祁连山现代冰川考察工作,自此也开启了他本人的现代冰川研究生涯,之后在青藏高原各地进行冰川研究工作,出版了《西藏冰川》[21]等著作,为推动我国现代冰川研究作出了杰出贡献.2020年7月21日先生不幸仙逝,谨以此文致以缅怀. ...
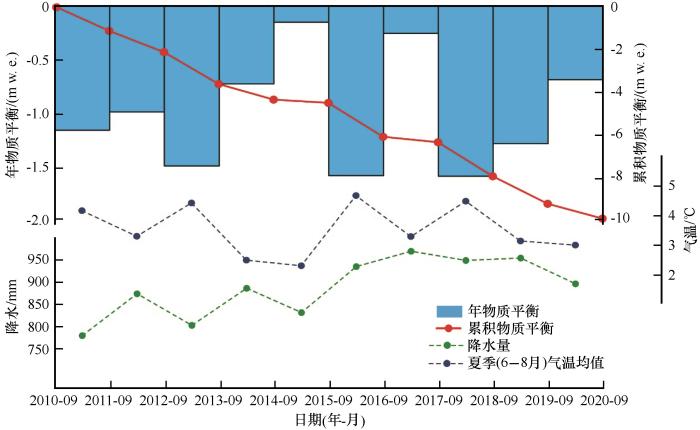
... 气候变化是全球冰川变化的主要原因[48].先前的研究表明,NC01冰川的退缩也可归因于气候变化[15-16,36].冰川侧碛垄上自动气象站获得的资料显示:2010—2020年,NC01冰川夏季(6—8月)气温均值在2.3~4.7 ℃之间,年降水量为780~970 mm(图4).对比2010—2020年NC01冰川物质平衡变化发现,夏季气温越高,冰川物质亏损越明显(图4),二者呈现明显的负相关关系,比如2014—2015年较低的夏季气温和2015—2016年较高的夏季气温分别对应了最小和最大的物质亏损(图4).2010—2020年,虽然降水有增多趋势,但冰川仍处于较为强烈的负平衡. ...
Glacier variations in response to climate change from 1972 to 2007 in the western Lenglongling Mountains, northeastern Tibetan Plateau
2
2012
... 冷龙岭位于祁连山东段,第一次冰川编目(CGI1)数据显示,此处发育现代冰川244条,其中南坡103条,冰川融水流入大通河,最后注入黄河,属于黄河流域;北坡141条,属内陆水系,注入石羊河[6].NC01冰川位于冷龙岭北坡[图1(a)],属于亚大陆型山地冰川,冰川面积为0.77 km2[6],海拔范围为4 260~4 640 m,冰面表碛覆盖较少.Cao等[36]在2014年8月对NC01冰川的厚度进行了测量,发现NC01冰川平均冰厚约24 m,最大厚度为65 m,总冰量约9.36×10⁶ m3.NC01冰川受东亚季风和西风带的共同控制[37].2010年建立在NC01冰川侧碛垄上(4 450 m)的自动气象站[图1(c)]显示,NC01冰川附近的年平均气温约为-6.0 ℃,年平均降水量>800 mm,降水主要集中在6—8月的夏季[36].近年来的研究显示,在过去的几十年,NC01冰川快速退缩,且退缩速率呈加速趋势[14,16].2010—2015年,NC01冰川物质平衡线平均高度约为4 680 m,已超过了冰川的最高海拔[36].NC01冰川融水经宁缠河最终汇入甘肃三大内陆河之一的石羊河. ...
... 气候变化是全球冰川变化的主要原因[48].先前的研究表明,NC01冰川的退缩也可归因于气候变化[15-16,36].冰川侧碛垄上自动气象站获得的资料显示:2010—2020年,NC01冰川夏季(6—8月)气温均值在2.3~4.7 ℃之间,年降水量为780~970 mm(图4).对比2010—2020年NC01冰川物质平衡变化发现,夏季气温越高,冰川物质亏损越明显(图4),二者呈现明显的负相关关系,比如2014—2015年较低的夏季气温和2015—2016年较高的夏季气温分别对应了最小和最大的物质亏损(图4).2010—2020年,虽然降水有增多趋势,但冰川仍处于较为强烈的负平衡. ...
1987-2018年祁连山冰川变化遥感监测及影响因子分析
1
2020
... 冰川不仅是重要的淡水资源[1-2],还是气候变化的敏感指示器[3-5].祁连山位于青藏高原东北缘,地处我国西北干旱半干旱区,共发育有现代冰川2 821条,总面积为1 986.94 km2[6].发源于祁连山的冰川融水径流是河西走廊和柴达木盆地重要的淡水来源.近年来,在气候变暖的大背景下,青藏高原大部分地区的冰川消融强烈[7-9].祁连山地区的冰川也经历了不同程度的退缩[10-18],严重威胁流域内的生产和生活用水安全[15,19].因此,祁连山地区冰川物质平衡的研究对流域内水资源的分配和利用具有重要的指导意义.此外,祁连山还是我国现代冰川研究的起源之地.1958年施雅风先生领导组织高山冰雪利用研究队在祁连山开展大规模考察,出版了《祁连山现代冰川考察报告》[20],开启了我国现代冰川研究的先河.李吉均先生作为主要成员参加了祁连山现代冰川考察工作,自此也开启了他本人的现代冰川研究生涯,之后在青藏高原各地进行冰川研究工作,出版了《西藏冰川》[21]等著作,为推动我国现代冰川研究作出了杰出贡献.2020年7月21日先生不幸仙逝,谨以此文致以缅怀. ...
Climate background, relative rate, and runoff effect of multiphase water transformation in Qilian Mountains, the third pole region
1
2019
... 冰川不仅是重要的淡水资源[1-2],还是气候变化的敏感指示器[3-5].祁连山位于青藏高原东北缘,地处我国西北干旱半干旱区,共发育有现代冰川2 821条,总面积为1 986.94 km2[6].发源于祁连山的冰川融水径流是河西走廊和柴达木盆地重要的淡水来源.近年来,在气候变暖的大背景下,青藏高原大部分地区的冰川消融强烈[7-9].祁连山地区的冰川也经历了不同程度的退缩[10-18],严重威胁流域内的生产和生活用水安全[15,19].因此,祁连山地区冰川物质平衡的研究对流域内水资源的分配和利用具有重要的指导意义.此外,祁连山还是我国现代冰川研究的起源之地.1958年施雅风先生领导组织高山冰雪利用研究队在祁连山开展大规模考察,出版了《祁连山现代冰川考察报告》[20],开启了我国现代冰川研究的先河.李吉均先生作为主要成员参加了祁连山现代冰川考察工作,自此也开启了他本人的现代冰川研究生涯,之后在青藏高原各地进行冰川研究工作,出版了《西藏冰川》[21]等著作,为推动我国现代冰川研究作出了杰出贡献.2020年7月21日先生不幸仙逝,谨以此文致以缅怀. ...
1
1958
... 冰川不仅是重要的淡水资源[1-2],还是气候变化的敏感指示器[3-5].祁连山位于青藏高原东北缘,地处我国西北干旱半干旱区,共发育有现代冰川2 821条,总面积为1 986.94 km2[6].发源于祁连山的冰川融水径流是河西走廊和柴达木盆地重要的淡水来源.近年来,在气候变暖的大背景下,青藏高原大部分地区的冰川消融强烈[7-9].祁连山地区的冰川也经历了不同程度的退缩[10-18],严重威胁流域内的生产和生活用水安全[15,19].因此,祁连山地区冰川物质平衡的研究对流域内水资源的分配和利用具有重要的指导意义.此外,祁连山还是我国现代冰川研究的起源之地.1958年施雅风先生领导组织高山冰雪利用研究队在祁连山开展大规模考察,出版了《祁连山现代冰川考察报告》[20],开启了我国现代冰川研究的先河.李吉均先生作为主要成员参加了祁连山现代冰川考察工作,自此也开启了他本人的现代冰川研究生涯,之后在青藏高原各地进行冰川研究工作,出版了《西藏冰川》[21]等著作,为推动我国现代冰川研究作出了杰出贡献.2020年7月21日先生不幸仙逝,谨以此文致以缅怀. ...
1
1986
... 冰川不仅是重要的淡水资源[1-2],还是气候变化的敏感指示器[3-5].祁连山位于青藏高原东北缘,地处我国西北干旱半干旱区,共发育有现代冰川2 821条,总面积为1 986.94 km2[6].发源于祁连山的冰川融水径流是河西走廊和柴达木盆地重要的淡水来源.近年来,在气候变暖的大背景下,青藏高原大部分地区的冰川消融强烈[7-9].祁连山地区的冰川也经历了不同程度的退缩[10-18],严重威胁流域内的生产和生活用水安全[15,19].因此,祁连山地区冰川物质平衡的研究对流域内水资源的分配和利用具有重要的指导意义.此外,祁连山还是我国现代冰川研究的起源之地.1958年施雅风先生领导组织高山冰雪利用研究队在祁连山开展大规模考察,出版了《祁连山现代冰川考察报告》[20],开启了我国现代冰川研究的先河.李吉均先生作为主要成员参加了祁连山现代冰川考察工作,自此也开启了他本人的现代冰川研究生涯,之后在青藏高原各地进行冰川研究工作,出版了《西藏冰川》[21]等著作,为推动我国现代冰川研究作出了杰出贡献.2020年7月21日先生不幸仙逝,谨以此文致以缅怀. ...
Comparison of glaciological and geodetic mass balance at Urumqi Glacier No.1, Tian Shan, Central Asia
2
2014
... 在目前研究中,“冰川学方法”和“大地测量法”是最常用的两种获得冰川物质平衡的方法[22-23].“冰川学方法”指通过在冰面布设花杆,观测花杆处的积累和消融,进而获得整个冰川物质平衡的方法[24-25].“大地测量法”指通过代表不同时期冰面高程的数字高程模型(DEM)之间的高程差获得冰川物质平衡的方法[26].相较于“大地测量法”,“冰川学方法”能够最直接获得精度较高的测量数据[22,25,27],适合用于冰川物质平衡的长期监测.然而,受高海拔地区极端气候以及地形等条件的限制,有物质平衡直接观测的冰川较少,有长时间连续物质平衡观测的冰川更为匮乏[8,28]. ...
... [22,25,27],适合用于冰川物质平衡的长期监测.然而,受高海拔地区极端气候以及地形等条件的限制,有物质平衡直接观测的冰川较少,有长时间连续物质平衡观测的冰川更为匮乏[8,28]. ...
Geodetic reanalysis of annual glaciological mass balances (2001-2011) of Hintereisferner, Austria
5
2018
... 在目前研究中,“冰川学方法”和“大地测量法”是最常用的两种获得冰川物质平衡的方法[22-23].“冰川学方法”指通过在冰面布设花杆,观测花杆处的积累和消融,进而获得整个冰川物质平衡的方法[24-25].“大地测量法”指通过代表不同时期冰面高程的数字高程模型(DEM)之间的高程差获得冰川物质平衡的方法[26].相较于“大地测量法”,“冰川学方法”能够最直接获得精度较高的测量数据[22,25,27],适合用于冰川物质平衡的长期监测.然而,受高海拔地区极端气候以及地形等条件的限制,有物质平衡直接观测的冰川较少,有长时间连续物质平衡观测的冰川更为匮乏[8,28]. ...
... 基于传统的冰川学观测方法,即通过观测单点位置处冰川的积累和消融[23-24],对NC01冰川进行逐年的物质平衡观测.2010年消融季末,首次在NC01冰川上布设了22根花杆(A系列,见表1)开始物质平衡观测.随着冰川的不断消融,持续观测4~6年后,花杆会发生倾倒.为了保证观测的连续性,分别于2016年和2020年在原花杆附近重新布设了新的花杆(B系列和C系列,见表1).NC01冰川冰面平坦,表碛覆盖较少,花杆可以均匀地分布在整个冰川[图1(b)].为了准确反映冰川的物质平衡,花杆布设时尽可能地分布在不同的海拔高度.本研究假设冰密度为(850±60) kg·m-3,积雪密度为(390±40) kg·m-3[36]. ...
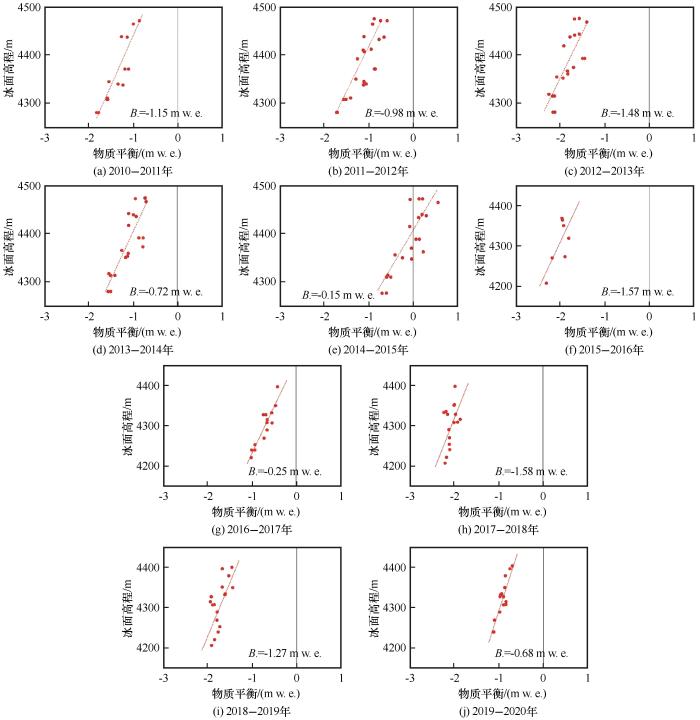
... 将花杆获得的冰川单点物质平衡外推到整个冰川区,传统的计算方法主要有等值线法和等高线法两种方法[38].等值线法指以观测获得的单点物质平衡为基础绘制出物质平衡等值线图,利用面积加权法计算出物质平衡;等高线法指提取出冰川的等高线,将相邻等高线之间的物质平衡视为固定值,通过不同高程带面积加权来计算整个冰川物质平衡的方法[23].蒲健辰等[29,39]、刘潮海等[40]分别在唐古拉山小冬克玛底冰川、祁连山七一冰川和天山乌鲁木齐河源1号冰川对两种冰川物质平衡的计算方法进行了比较,发现二者结果基本一致.在先前的研究中发现,NC01冰川表面物质平衡和冰面高程存在明显的负相关关系[36].考虑到布设在NC01冰川上的花杆在空间上密度较大,分布较为均匀且基本覆盖了整个冰川,此研究中通过拟合获得花杆观测物质平衡和冰面高程之间的关系,并将这一关系应用到整个冰川区来获得整个冰川的物质平衡. ...
... 花杆观测推算冰川物质平衡的误差主要来源于花杆分布、花杆读数、冰川密度的准确性以及将花杆观测结果外推到整个冰川区的方法[23,25,41-44].有学者研究发现,其不确定性在0.1~0.6 m w.e.[23,41,45].在此次研究中,参照Thibert等[46]提出的方法,获得整个冰川年物质平衡不确定性约为0.5 m w.e.. ...
... [23,41,45].在此次研究中,参照Thibert等[46]提出的方法,获得整个冰川年物质平衡不确定性约为0.5 m w.e.. ...
Methoden und M?glichkeiten von Massenhaushaltsstudien auf Gletschern: Ergebnisse der Messreihe Hintereisferner (?tztaler Alpen) 1953-1968
2
1970
... 在目前研究中,“冰川学方法”和“大地测量法”是最常用的两种获得冰川物质平衡的方法[22-23].“冰川学方法”指通过在冰面布设花杆,观测花杆处的积累和消融,进而获得整个冰川物质平衡的方法[24-25].“大地测量法”指通过代表不同时期冰面高程的数字高程模型(DEM)之间的高程差获得冰川物质平衡的方法[26].相较于“大地测量法”,“冰川学方法”能够最直接获得精度较高的测量数据[22,25,27],适合用于冰川物质平衡的长期监测.然而,受高海拔地区极端气候以及地形等条件的限制,有物质平衡直接观测的冰川较少,有长时间连续物质平衡观测的冰川更为匮乏[8,28]. ...
... 基于传统的冰川学观测方法,即通过观测单点位置处冰川的积累和消融[23-24],对NC01冰川进行逐年的物质平衡观测.2010年消融季末,首次在NC01冰川上布设了22根花杆(A系列,见表1)开始物质平衡观测.随着冰川的不断消融,持续观测4~6年后,花杆会发生倾倒.为了保证观测的连续性,分别于2016年和2020年在原花杆附近重新布设了新的花杆(B系列和C系列,见表1).NC01冰川冰面平坦,表碛覆盖较少,花杆可以均匀地分布在整个冰川[图1(b)].为了准确反映冰川的物质平衡,花杆布设时尽可能地分布在不同的海拔高度.本研究假设冰密度为(850±60) kg·m-3,积雪密度为(390±40) kg·m-3[36]. ...
Glacier mass-balance measurements: a manual for field and office work
3
1993
... 在目前研究中,“冰川学方法”和“大地测量法”是最常用的两种获得冰川物质平衡的方法[22-23].“冰川学方法”指通过在冰面布设花杆,观测花杆处的积累和消融,进而获得整个冰川物质平衡的方法[24-25].“大地测量法”指通过代表不同时期冰面高程的数字高程模型(DEM)之间的高程差获得冰川物质平衡的方法[26].相较于“大地测量法”,“冰川学方法”能够最直接获得精度较高的测量数据[22,25,27],适合用于冰川物质平衡的长期监测.然而,受高海拔地区极端气候以及地形等条件的限制,有物质平衡直接观测的冰川较少,有长时间连续物质平衡观测的冰川更为匮乏[8,28]. ...
... ,25,27],适合用于冰川物质平衡的长期监测.然而,受高海拔地区极端气候以及地形等条件的限制,有物质平衡直接观测的冰川较少,有长时间连续物质平衡观测的冰川更为匮乏[8,28]. ...
... 花杆观测推算冰川物质平衡的误差主要来源于花杆分布、花杆读数、冰川密度的准确性以及将花杆观测结果外推到整个冰川区的方法[23,25,41-44].有学者研究发现,其不确定性在0.1~0.6 m w.e.[23,41,45].在此次研究中,参照Thibert等[46]提出的方法,获得整个冰川年物质平衡不确定性约为0.5 m w.e.. ...
The glaciers climate change initiative: methods for creating glacier area, elevation change and velocity products
1
2015
... 在目前研究中,“冰川学方法”和“大地测量法”是最常用的两种获得冰川物质平衡的方法[22-23].“冰川学方法”指通过在冰面布设花杆,观测花杆处的积累和消融,进而获得整个冰川物质平衡的方法[24-25].“大地测量法”指通过代表不同时期冰面高程的数字高程模型(DEM)之间的高程差获得冰川物质平衡的方法[26].相较于“大地测量法”,“冰川学方法”能够最直接获得精度较高的测量数据[22,25,27],适合用于冰川物质平衡的长期监测.然而,受高海拔地区极端气候以及地形等条件的限制,有物质平衡直接观测的冰川较少,有长时间连续物质平衡观测的冰川更为匮乏[8,28]. ...
1
2011
... 在目前研究中,“冰川学方法”和“大地测量法”是最常用的两种获得冰川物质平衡的方法[22-23].“冰川学方法”指通过在冰面布设花杆,观测花杆处的积累和消融,进而获得整个冰川物质平衡的方法[24-25].“大地测量法”指通过代表不同时期冰面高程的数字高程模型(DEM)之间的高程差获得冰川物质平衡的方法[26].相较于“大地测量法”,“冰川学方法”能够最直接获得精度较高的测量数据[22,25,27],适合用于冰川物质平衡的长期监测.然而,受高海拔地区极端气候以及地形等条件的限制,有物质平衡直接观测的冰川较少,有长时间连续物质平衡观测的冰川更为匮乏[8,28]. ...
Glacier mass changes in Rongbuk catchment on Mt. Qomolangma from 1974 to 2006 based on topographic maps and ALOS PRISM data
2
2015
... 在目前研究中,“冰川学方法”和“大地测量法”是最常用的两种获得冰川物质平衡的方法[22-23].“冰川学方法”指通过在冰面布设花杆,观测花杆处的积累和消融,进而获得整个冰川物质平衡的方法[24-25].“大地测量法”指通过代表不同时期冰面高程的数字高程模型(DEM)之间的高程差获得冰川物质平衡的方法[26].相较于“大地测量法”,“冰川学方法”能够最直接获得精度较高的测量数据[22,25,27],适合用于冰川物质平衡的长期监测.然而,受高海拔地区极端气候以及地形等条件的限制,有物质平衡直接观测的冰川较少,有长时间连续物质平衡观测的冰川更为匮乏[8,28]. ...
... Mass balance of different glaciers in China
Table 2| 冰川名称 | 冰川面积/km2 | 年物质平衡/(m w.e.) | 观测时段 | 观测方法 | 数据来源 |
|---|
| 乌鲁木齐河源1号 | 1.58 | -0.627 | 2010—2019年 | 冰川学方法 | WGMS |
| 青冰滩72号 | 6.60 | -0.378 | 2008—2014年 | 冰川学方法 | [53-54] |
| 透明梦珂 | 20.42 | -0.309 | 2010—2012年 | 冰川学方法 | [30] |
| 七一 | 2.53 | -0.476 | 2011—2016年 | 冰川学方法 | [28,55] |
| 十一 | 0.50 | -0.530 | 2000—2012年 | 大地测量法 | [31,56] |
| 水管河4号 | 1.40 | -0.510 | 2010—2013年 | 冰川学方法 | [52] |
| 宁缠河1号 | 0.54 | -0.980 | 2010—2020年 | 冰川学方法 | 本研究 |
注:冰川面积数据来源于国家青藏高原科学数据中心中国第二次冰川编目数据集[57]. ...
祁连山七一冰川物质平衡的最新观测结果
2
2005
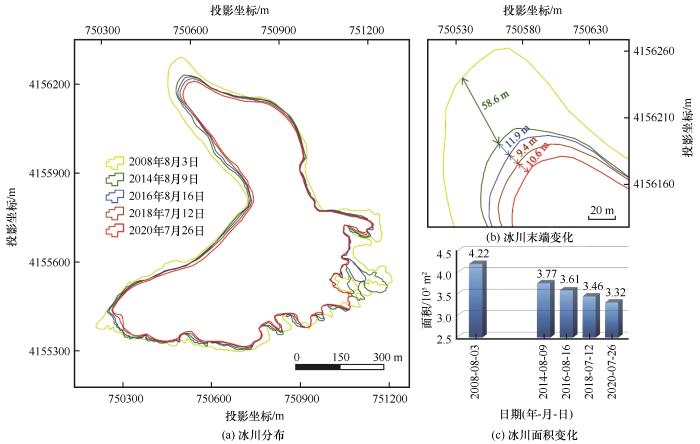
... 鉴于祁连山冰川及其融水的重要性,学者们已在祁连山中段的七一冰川[29-30]、十一冰川[31],以及西段的透明梦珂冰川(老虎沟12号冰川)[32]进行了物质平衡观测,而在祁连山东段仍缺少连续的冰川物质平衡观测数据.据前人研究发现在祁连山东段,冰川退缩尤为剧烈,退缩速率要高于西段和中段[33-35].因此,自2010年始,我们对祁连山东段冷龙岭地区的宁缠河1号(NC01)冰川开展了连续的物质平衡观测.本文的研究目标为:结合覆盖NC01冰川的Google Earth高分辨率影像,以及资源3号(ZY-3)和哨兵2号(Sentinel-2)卫星影像,获得NC01冰川2008—2020年的面积和物质平衡变化信息;结合1972年地形图数字化得到的冰面高程和2014年获得的冰川厚度数据,讨论NC01冰川1972年以来的厚度和冰量变化;最后结合气象资料,探讨冰川变化与气候之间的联系. ...
... 将花杆获得的冰川单点物质平衡外推到整个冰川区,传统的计算方法主要有等值线法和等高线法两种方法[38].等值线法指以观测获得的单点物质平衡为基础绘制出物质平衡等值线图,利用面积加权法计算出物质平衡;等高线法指提取出冰川的等高线,将相邻等高线之间的物质平衡视为固定值,通过不同高程带面积加权来计算整个冰川物质平衡的方法[23].蒲健辰等[29,39]、刘潮海等[40]分别在唐古拉山小冬克玛底冰川、祁连山七一冰川和天山乌鲁木齐河源1号冰川对两种冰川物质平衡的计算方法进行了比较,发现二者结果基本一致.在先前的研究中发现,NC01冰川表面物质平衡和冰面高程存在明显的负相关关系[36].考虑到布设在NC01冰川上的花杆在空间上密度较大,分布较为均匀且基本覆盖了整个冰川,此研究中通过拟合获得花杆观测物质平衡和冰面高程之间的关系,并将这一关系应用到整个冰川区来获得整个冰川的物质平衡. ...
祁连山七一冰川物质平衡的最新观测结果
2
2005
... 鉴于祁连山冰川及其融水的重要性,学者们已在祁连山中段的七一冰川[29-30]、十一冰川[31],以及西段的透明梦珂冰川(老虎沟12号冰川)[32]进行了物质平衡观测,而在祁连山东段仍缺少连续的冰川物质平衡观测数据.据前人研究发现在祁连山东段,冰川退缩尤为剧烈,退缩速率要高于西段和中段[33-35].因此,自2010年始,我们对祁连山东段冷龙岭地区的宁缠河1号(NC01)冰川开展了连续的物质平衡观测.本文的研究目标为:结合覆盖NC01冰川的Google Earth高分辨率影像,以及资源3号(ZY-3)和哨兵2号(Sentinel-2)卫星影像,获得NC01冰川2008—2020年的面积和物质平衡变化信息;结合1972年地形图数字化得到的冰面高程和2014年获得的冰川厚度数据,讨论NC01冰川1972年以来的厚度和冰量变化;最后结合气象资料,探讨冰川变化与气候之间的联系. ...
... 将花杆获得的冰川单点物质平衡外推到整个冰川区,传统的计算方法主要有等值线法和等高线法两种方法[38].等值线法指以观测获得的单点物质平衡为基础绘制出物质平衡等值线图,利用面积加权法计算出物质平衡;等高线法指提取出冰川的等高线,将相邻等高线之间的物质平衡视为固定值,通过不同高程带面积加权来计算整个冰川物质平衡的方法[23].蒲健辰等[29,39]、刘潮海等[40]分别在唐古拉山小冬克玛底冰川、祁连山七一冰川和天山乌鲁木齐河源1号冰川对两种冰川物质平衡的计算方法进行了比较,发现二者结果基本一致.在先前的研究中发现,NC01冰川表面物质平衡和冰面高程存在明显的负相关关系[36].考虑到布设在NC01冰川上的花杆在空间上密度较大,分布较为均匀且基本覆盖了整个冰川,此研究中通过拟合获得花杆观测物质平衡和冰面高程之间的关系,并将这一关系应用到整个冰川区来获得整个冰川的物质平衡. ...
祁连山七一冰川物质平衡的时空变化特征
2
2020
... 鉴于祁连山冰川及其融水的重要性,学者们已在祁连山中段的七一冰川[29-30]、十一冰川[31],以及西段的透明梦珂冰川(老虎沟12号冰川)[32]进行了物质平衡观测,而在祁连山东段仍缺少连续的冰川物质平衡观测数据.据前人研究发现在祁连山东段,冰川退缩尤为剧烈,退缩速率要高于西段和中段[33-35].因此,自2010年始,我们对祁连山东段冷龙岭地区的宁缠河1号(NC01)冰川开展了连续的物质平衡观测.本文的研究目标为:结合覆盖NC01冰川的Google Earth高分辨率影像,以及资源3号(ZY-3)和哨兵2号(Sentinel-2)卫星影像,获得NC01冰川2008—2020年的面积和物质平衡变化信息;结合1972年地形图数字化得到的冰面高程和2014年获得的冰川厚度数据,讨论NC01冰川1972年以来的厚度和冰量变化;最后结合气象资料,探讨冰川变化与气候之间的联系. ...
... Mass balance of different glaciers in China
Table 2| 冰川名称 | 冰川面积/km2 | 年物质平衡/(m w.e.) | 观测时段 | 观测方法 | 数据来源 |
|---|
| 乌鲁木齐河源1号 | 1.58 | -0.627 | 2010—2019年 | 冰川学方法 | WGMS |
| 青冰滩72号 | 6.60 | -0.378 | 2008—2014年 | 冰川学方法 | [53-54] |
| 透明梦珂 | 20.42 | -0.309 | 2010—2012年 | 冰川学方法 | [30] |
| 七一 | 2.53 | -0.476 | 2011—2016年 | 冰川学方法 | [28,55] |
| 十一 | 0.50 | -0.530 | 2000—2012年 | 大地测量法 | [31,56] |
| 水管河4号 | 1.40 | -0.510 | 2010—2013年 | 冰川学方法 | [52] |
| 宁缠河1号 | 0.54 | -0.980 | 2010—2020年 | 冰川学方法 | 本研究 |
注:冰川面积数据来源于国家青藏高原科学数据中心中国第二次冰川编目数据集[57]. ...
冰川物质平衡模式及其对比研究: 以祁连山黑河流域十一冰川研究为例
2
2015
... 鉴于祁连山冰川及其融水的重要性,学者们已在祁连山中段的七一冰川[29-30]、十一冰川[31],以及西段的透明梦珂冰川(老虎沟12号冰川)[32]进行了物质平衡观测,而在祁连山东段仍缺少连续的冰川物质平衡观测数据.据前人研究发现在祁连山东段,冰川退缩尤为剧烈,退缩速率要高于西段和中段[33-35].因此,自2010年始,我们对祁连山东段冷龙岭地区的宁缠河1号(NC01)冰川开展了连续的物质平衡观测.本文的研究目标为:结合覆盖NC01冰川的Google Earth高分辨率影像,以及资源3号(ZY-3)和哨兵2号(Sentinel-2)卫星影像,获得NC01冰川2008—2020年的面积和物质平衡变化信息;结合1972年地形图数字化得到的冰面高程和2014年获得的冰川厚度数据,讨论NC01冰川1972年以来的厚度和冰量变化;最后结合气象资料,探讨冰川变化与气候之间的联系. ...
... Mass balance of different glaciers in China
Table 2| 冰川名称 | 冰川面积/km2 | 年物质平衡/(m w.e.) | 观测时段 | 观测方法 | 数据来源 |
|---|
| 乌鲁木齐河源1号 | 1.58 | -0.627 | 2010—2019年 | 冰川学方法 | WGMS |
| 青冰滩72号 | 6.60 | -0.378 | 2008—2014年 | 冰川学方法 | [53-54] |
| 透明梦珂 | 20.42 | -0.309 | 2010—2012年 | 冰川学方法 | [30] |
| 七一 | 2.53 | -0.476 | 2011—2016年 | 冰川学方法 | [28,55] |
| 十一 | 0.50 | -0.530 | 2000—2012年 | 大地测量法 | [31,56] |
| 水管河4号 | 1.40 | -0.510 | 2010—2013年 | 冰川学方法 | [52] |
| 宁缠河1号 | 0.54 | -0.980 | 2010—2020年 | 冰川学方法 | 本研究 |
注:冰川面积数据来源于国家青藏高原科学数据中心中国第二次冰川编目数据集[57]. ...
The mass-balance characteristics and sensitivities to climate variables of Laohugou Glacier No.12, western Qilian Mountains, China
1
2017
... 鉴于祁连山冰川及其融水的重要性,学者们已在祁连山中段的七一冰川[29-30]、十一冰川[31],以及西段的透明梦珂冰川(老虎沟12号冰川)[32]进行了物质平衡观测,而在祁连山东段仍缺少连续的冰川物质平衡观测数据.据前人研究发现在祁连山东段,冰川退缩尤为剧烈,退缩速率要高于西段和中段[33-35].因此,自2010年始,我们对祁连山东段冷龙岭地区的宁缠河1号(NC01)冰川开展了连续的物质平衡观测.本文的研究目标为:结合覆盖NC01冰川的Google Earth高分辨率影像,以及资源3号(ZY-3)和哨兵2号(Sentinel-2)卫星影像,获得NC01冰川2008—2020年的面积和物质平衡变化信息;结合1972年地形图数字化得到的冰面高程和2014年获得的冰川厚度数据,讨论NC01冰川1972年以来的厚度和冰量变化;最后结合气象资料,探讨冰川变化与气候之间的联系. ...
近50年来祁连山冰川变化: 基于中国第一、二次冰川编目数据
1
2015
... 鉴于祁连山冰川及其融水的重要性,学者们已在祁连山中段的七一冰川[29-30]、十一冰川[31],以及西段的透明梦珂冰川(老虎沟12号冰川)[32]进行了物质平衡观测,而在祁连山东段仍缺少连续的冰川物质平衡观测数据.据前人研究发现在祁连山东段,冰川退缩尤为剧烈,退缩速率要高于西段和中段[33-35].因此,自2010年始,我们对祁连山东段冷龙岭地区的宁缠河1号(NC01)冰川开展了连续的物质平衡观测.本文的研究目标为:结合覆盖NC01冰川的Google Earth高分辨率影像,以及资源3号(ZY-3)和哨兵2号(Sentinel-2)卫星影像,获得NC01冰川2008—2020年的面积和物质平衡变化信息;结合1972年地形图数字化得到的冰面高程和2014年获得的冰川厚度数据,讨论NC01冰川1972年以来的厚度和冰量变化;最后结合气象资料,探讨冰川变化与气候之间的联系. ...
1956-2017年河西内流区冰川资源时空变化特征
0
2019
1956-2017年河西内流区冰川资源时空变化特征
0
2019
1960s-2015年祁连山现代冰川变化研究
1
2020
... 鉴于祁连山冰川及其融水的重要性,学者们已在祁连山中段的七一冰川[29-30]、十一冰川[31],以及西段的透明梦珂冰川(老虎沟12号冰川)[32]进行了物质平衡观测,而在祁连山东段仍缺少连续的冰川物质平衡观测数据.据前人研究发现在祁连山东段,冰川退缩尤为剧烈,退缩速率要高于西段和中段[33-35].因此,自2010年始,我们对祁连山东段冷龙岭地区的宁缠河1号(NC01)冰川开展了连续的物质平衡观测.本文的研究目标为:结合覆盖NC01冰川的Google Earth高分辨率影像,以及资源3号(ZY-3)和哨兵2号(Sentinel-2)卫星影像,获得NC01冰川2008—2020年的面积和物质平衡变化信息;结合1972年地形图数字化得到的冰面高程和2014年获得的冰川厚度数据,讨论NC01冰川1972年以来的厚度和冰量变化;最后结合气象资料,探讨冰川变化与气候之间的联系. ...
Changes in ice volume of the Ningchan No.1 Glacier, China, from 1972 to 2014, as derived from in situ measurements
9
2017
... 冷龙岭位于祁连山东段,第一次冰川编目(CGI1)数据显示,此处发育现代冰川244条,其中南坡103条,冰川融水流入大通河,最后注入黄河,属于黄河流域;北坡141条,属内陆水系,注入石羊河[6].NC01冰川位于冷龙岭北坡[图1(a)],属于亚大陆型山地冰川,冰川面积为0.77 km2[6],海拔范围为4 260~4 640 m,冰面表碛覆盖较少.Cao等[36]在2014年8月对NC01冰川的厚度进行了测量,发现NC01冰川平均冰厚约24 m,最大厚度为65 m,总冰量约9.36×10⁶ m3.NC01冰川受东亚季风和西风带的共同控制[37].2010年建立在NC01冰川侧碛垄上(4 450 m)的自动气象站[图1(c)]显示,NC01冰川附近的年平均气温约为-6.0 ℃,年平均降水量>800 mm,降水主要集中在6—8月的夏季[36].近年来的研究显示,在过去的几十年,NC01冰川快速退缩,且退缩速率呈加速趋势[14,16].2010—2015年,NC01冰川物质平衡线平均高度约为4 680 m,已超过了冰川的最高海拔[36].NC01冰川融水经宁缠河最终汇入甘肃三大内陆河之一的石羊河. ...
... [36].近年来的研究显示,在过去的几十年,NC01冰川快速退缩,且退缩速率呈加速趋势[14,16].2010—2015年,NC01冰川物质平衡线平均高度约为4 680 m,已超过了冰川的最高海拔[36].NC01冰川融水经宁缠河最终汇入甘肃三大内陆河之一的石羊河. ...
... [36].NC01冰川融水经宁缠河最终汇入甘肃三大内陆河之一的石羊河. ...
... 基于传统的冰川学观测方法,即通过观测单点位置处冰川的积累和消融[23-24],对NC01冰川进行逐年的物质平衡观测.2010年消融季末,首次在NC01冰川上布设了22根花杆(A系列,见表1)开始物质平衡观测.随着冰川的不断消融,持续观测4~6年后,花杆会发生倾倒.为了保证观测的连续性,分别于2016年和2020年在原花杆附近重新布设了新的花杆(B系列和C系列,见表1).NC01冰川冰面平坦,表碛覆盖较少,花杆可以均匀地分布在整个冰川[图1(b)].为了准确反映冰川的物质平衡,花杆布设时尽可能地分布在不同的海拔高度.本研究假设冰密度为(850±60) kg·m-3,积雪密度为(390±40) kg·m-3[36]. ...
... 将花杆获得的冰川单点物质平衡外推到整个冰川区,传统的计算方法主要有等值线法和等高线法两种方法[38].等值线法指以观测获得的单点物质平衡为基础绘制出物质平衡等值线图,利用面积加权法计算出物质平衡;等高线法指提取出冰川的等高线,将相邻等高线之间的物质平衡视为固定值,通过不同高程带面积加权来计算整个冰川物质平衡的方法[23].蒲健辰等[29,39]、刘潮海等[40]分别在唐古拉山小冬克玛底冰川、祁连山七一冰川和天山乌鲁木齐河源1号冰川对两种冰川物质平衡的计算方法进行了比较,发现二者结果基本一致.在先前的研究中发现,NC01冰川表面物质平衡和冰面高程存在明显的负相关关系[36].考虑到布设在NC01冰川上的花杆在空间上密度较大,分布较为均匀且基本覆盖了整个冰川,此研究中通过拟合获得花杆观测物质平衡和冰面高程之间的关系,并将这一关系应用到整个冰川区来获得整个冰川的物质平衡. ...
... Cao等[36]依据1972年1∶5万地形图数字化得到的冰面高程,以及2010年和2015年差分GPS测得的冰面高程,基于大地测量法间接地估算了NC01冰川的物质平衡.结果显示:1972—2010年,NC01冰川平均减薄28.8 m,平均减薄速率为0.76 m·a-1,年物质平衡为-0.65 m w.e..2010—2015年,花杆观测和通过差分GPS高程差间接获得的物质平衡分别为 -4.8 m w.e.和-4.3 m w.e.,二者的差异约为10%. ...
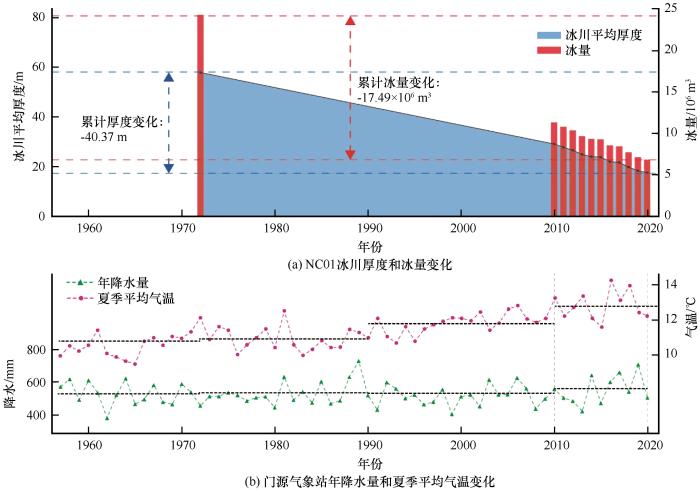
... 在此次研究中,依据Cao等[36]2014年实测的冰川厚度、1972—2010年的物质平衡以及本研究得到的2010—2020年逐年观测物质平衡,推算出了1972年以及2010—2020年逐年的冰川厚度及其冰量[图5(a)].在1972—2020年整个时间段内,NC01冰川平均厚度减薄40.37 m,冰量减少17.49×10⁶ m3,平均减薄速率为0.84 m·a-1,平均冰量变化速率为-0.36×10⁶ m3·a-1.其中,1972—2010年,NC01冰川平均厚度从57.89 m减薄至29.09 m,冰量从24.32×10⁶ m3减少至11.35×10⁶ m3,平均减薄速率为0.76 m·a-1,平均冰量变化速率为-0.34×10⁶ m3·a-1.2010—2020年,冰川退缩加速.2020年冰川平均厚度减薄至17.52 m,冰量减少至6.83×10⁶ m3,平均减薄速率为1.16 m·a-1,平均冰量变化速率为-0.45×10⁶ m3·a-1. ...
... 气候变化是全球冰川变化的主要原因[48].先前的研究表明,NC01冰川的退缩也可归因于气候变化[15-16,36].冰川侧碛垄上自动气象站获得的资料显示:2010—2020年,NC01冰川夏季(6—8月)气温均值在2.3~4.7 ℃之间,年降水量为780~970 mm(图4).对比2010—2020年NC01冰川物质平衡变化发现,夏季气温越高,冰川物质亏损越明显(图4),二者呈现明显的负相关关系,比如2014—2015年较低的夏季气温和2015—2016年较高的夏季气温分别对应了最小和最大的物质亏损(图4).2010—2020年,虽然降水有增多趋势,但冰川仍处于较为强烈的负平衡. ...
... 此外,通过对比祁连山的水管河4号冰川、七一冰川、十一冰川、透明梦珂冰川,以及天山的乌鲁木齐河源1号冰川和青冰滩72号冰川近年来的物质平衡结果发现:在相近时间段,NC01冰川物质亏损更为强烈(表2).可能原因是NC01冰川规模较小,对气候变化的响应更加敏感.在当前的气候状态下,有不少冰川物质平衡线高度都超过了冰川的最高海拔,使得整个冰川都处于消融状态[51].根据Cao等[36]和本文的研究,NC01冰川物质平衡线近10年的平均高度约为4 680 m,已超过了冰川的最高海拔,这也加快了冰川负物质平衡.因此,可以推测,在当前的气候背景下,NC01冰川将在不久后完全消失.Cao等[52]根据冰川ELA高度也认为,目前冷龙岭地区的冰川还需要继续退缩才能与气候达到平衡,伴随着大部分冰川的消失. ...
Holocene moisture evolution in arid Central Asia and its out-of-phase relationship with Asian monsoon history
1
2008
... 冷龙岭位于祁连山东段,第一次冰川编目(CGI1)数据显示,此处发育现代冰川244条,其中南坡103条,冰川融水流入大通河,最后注入黄河,属于黄河流域;北坡141条,属内陆水系,注入石羊河[6].NC01冰川位于冷龙岭北坡[图1(a)],属于亚大陆型山地冰川,冰川面积为0.77 km2[6],海拔范围为4 260~4 640 m,冰面表碛覆盖较少.Cao等[36]在2014年8月对NC01冰川的厚度进行了测量,发现NC01冰川平均冰厚约24 m,最大厚度为65 m,总冰量约9.36×10⁶ m3.NC01冰川受东亚季风和西风带的共同控制[37].2010年建立在NC01冰川侧碛垄上(4 450 m)的自动气象站[图1(c)]显示,NC01冰川附近的年平均气温约为-6.0 ℃,年平均降水量>800 mm,降水主要集中在6—8月的夏季[36].近年来的研究显示,在过去的几十年,NC01冰川快速退缩,且退缩速率呈加速趋势[14,16].2010—2015年,NC01冰川物质平衡线平均高度约为4 680 m,已超过了冰川的最高海拔[36].NC01冰川融水经宁缠河最终汇入甘肃三大内陆河之一的石羊河. ...
1
2010
... 将花杆获得的冰川单点物质平衡外推到整个冰川区,传统的计算方法主要有等值线法和等高线法两种方法[38].等值线法指以观测获得的单点物质平衡为基础绘制出物质平衡等值线图,利用面积加权法计算出物质平衡;等高线法指提取出冰川的等高线,将相邻等高线之间的物质平衡视为固定值,通过不同高程带面积加权来计算整个冰川物质平衡的方法[23].蒲健辰等[29,39]、刘潮海等[40]分别在唐古拉山小冬克玛底冰川、祁连山七一冰川和天山乌鲁木齐河源1号冰川对两种冰川物质平衡的计算方法进行了比较,发现二者结果基本一致.在先前的研究中发现,NC01冰川表面物质平衡和冰面高程存在明显的负相关关系[36].考虑到布设在NC01冰川上的花杆在空间上密度较大,分布较为均匀且基本覆盖了整个冰川,此研究中通过拟合获得花杆观测物质平衡和冰面高程之间的关系,并将这一关系应用到整个冰川区来获得整个冰川的物质平衡. ...
冬克玛底支冰川物质平衡研究
1
1993
... 将花杆获得的冰川单点物质平衡外推到整个冰川区,传统的计算方法主要有等值线法和等高线法两种方法[38].等值线法指以观测获得的单点物质平衡为基础绘制出物质平衡等值线图,利用面积加权法计算出物质平衡;等高线法指提取出冰川的等高线,将相邻等高线之间的物质平衡视为固定值,通过不同高程带面积加权来计算整个冰川物质平衡的方法[23].蒲健辰等[29,39]、刘潮海等[40]分别在唐古拉山小冬克玛底冰川、祁连山七一冰川和天山乌鲁木齐河源1号冰川对两种冰川物质平衡的计算方法进行了比较,发现二者结果基本一致.在先前的研究中发现,NC01冰川表面物质平衡和冰面高程存在明显的负相关关系[36].考虑到布设在NC01冰川上的花杆在空间上密度较大,分布较为均匀且基本覆盖了整个冰川,此研究中通过拟合获得花杆观测物质平衡和冰面高程之间的关系,并将这一关系应用到整个冰川区来获得整个冰川的物质平衡. ...
乌鲁木齐河源1号冰川物质平衡过程研究
1
1989
... 将花杆获得的冰川单点物质平衡外推到整个冰川区,传统的计算方法主要有等值线法和等高线法两种方法[38].等值线法指以观测获得的单点物质平衡为基础绘制出物质平衡等值线图,利用面积加权法计算出物质平衡;等高线法指提取出冰川的等高线,将相邻等高线之间的物质平衡视为固定值,通过不同高程带面积加权来计算整个冰川物质平衡的方法[23].蒲健辰等[29,39]、刘潮海等[40]分别在唐古拉山小冬克玛底冰川、祁连山七一冰川和天山乌鲁木齐河源1号冰川对两种冰川物质平衡的计算方法进行了比较,发现二者结果基本一致.在先前的研究中发现,NC01冰川表面物质平衡和冰面高程存在明显的负相关关系[36].考虑到布设在NC01冰川上的花杆在空间上密度较大,分布较为均匀且基本覆盖了整个冰川,此研究中通过拟合获得花杆观测物质平衡和冰面高程之间的关系,并将这一关系应用到整个冰川区来获得整个冰川的物质平衡. ...
Effect of uncertainties in measured variables on the calculated mass balance of Storglaci?ren
2
1999
... 花杆观测推算冰川物质平衡的误差主要来源于花杆分布、花杆读数、冰川密度的准确性以及将花杆观测结果外推到整个冰川区的方法[23,25,41-44].有学者研究发现,其不确定性在0.1~0.6 m w.e.[23,41,45].在此次研究中,参照Thibert等[46]提出的方法,获得整个冰川年物质平衡不确定性约为0.5 m w.e.. ...
... ,41,45].在此次研究中,参照Thibert等[46]提出的方法,获得整个冰川年物质平衡不确定性约为0.5 m w.e.. ...
Effective sample size for glacier mass balance
0
1999
How many stakes are required to measure the mass balance of a glacier?
0
1999
Reanalysing glacier mass balance measurement series
1
2013
... 花杆观测推算冰川物质平衡的误差主要来源于花杆分布、花杆读数、冰川密度的准确性以及将花杆观测结果外推到整个冰川区的方法[23,25,41-44].有学者研究发现,其不确定性在0.1~0.6 m w.e.[23,41,45].在此次研究中,参照Thibert等[46]提出的方法,获得整个冰川年物质平衡不确定性约为0.5 m w.e.. ...
Six decades of glacier mass-balance observations: a review of the worldwide monitoring network
1
2009
... 花杆观测推算冰川物质平衡的误差主要来源于花杆分布、花杆读数、冰川密度的准确性以及将花杆观测结果外推到整个冰川区的方法[23,25,41-44].有学者研究发现,其不确定性在0.1~0.6 m w.e.[23,41,45].在此次研究中,参照Thibert等[46]提出的方法,获得整个冰川年物质平衡不确定性约为0.5 m w.e.. ...
Glaciological and volumetric mass-balance measurements: error analysis over 51 years for Glacier de Sarennes, French Alps
1
2008
... 花杆观测推算冰川物质平衡的误差主要来源于花杆分布、花杆读数、冰川密度的准确性以及将花杆观测结果外推到整个冰川区的方法[23,25,41-44].有学者研究发现,其不确定性在0.1~0.6 m w.e.[23,41,45].在此次研究中,参照Thibert等[46]提出的方法,获得整个冰川年物质平衡不确定性约为0.5 m w.e.. ...
Glacier area stability in the Central Karakoram National Park (Pakistan) in 2001-2010: the “Karakoram Anomaly” in the spotlight
1
2016
... 手工数字化提取冰川边界的误差主要来自于影像自身的定位精度以及难以区分的混合像元.在此处,利用和Minora等[47]相似的方法估算了基于Google Earth高分辨率历史影像、ZY-3和Sentinel-2卫星影像提取冰川面积的不确定性(EA).其估算公式为 ...
Observations: cryosphere
1
2013
... 气候变化是全球冰川变化的主要原因[48].先前的研究表明,NC01冰川的退缩也可归因于气候变化[15-16,36].冰川侧碛垄上自动气象站获得的资料显示:2010—2020年,NC01冰川夏季(6—8月)气温均值在2.3~4.7 ℃之间,年降水量为780~970 mm(图4).对比2010—2020年NC01冰川物质平衡变化发现,夏季气温越高,冰川物质亏损越明显(图4),二者呈现明显的负相关关系,比如2014—2015年较低的夏季气温和2015—2016年较高的夏季气温分别对应了最小和最大的物质亏损(图4).2010—2020年,虽然降水有增多趋势,但冰川仍处于较为强烈的负平衡. ...
Extracting a climate signal from 169 glacier records
1
2005
... 先前的研究表明,每上升1 ℃需要增加25%的降水才能弥补气温升高造成的冰川消融[49].此外,气温升高会导致降水中液态降水的比例增加,使得冰面反照率减小进而加速冰川表面消融[50].1972年以来NC01冰川整体呈退缩趋势,且2008—2020年冰川退缩速率(7.54 m·a-1)明显高于1970—2010年(4.50 m·a-1)[14].这可能与近年来气温的明显升高有关,气温升高带来的消融量远大于降水增加带来的积累量. ...
Evidence for intensification of the global water cycle: review and synthesis
1
2006
... 先前的研究表明,每上升1 ℃需要增加25%的降水才能弥补气温升高造成的冰川消融[49].此外,气温升高会导致降水中液态降水的比例增加,使得冰面反照率减小进而加速冰川表面消融[50].1972年以来NC01冰川整体呈退缩趋势,且2008—2020年冰川退缩速率(7.54 m·a-1)明显高于1970—2010年(4.50 m·a-1)[14].这可能与近年来气温的明显升高有关,气温升高带来的消融量远大于降水增加带来的积累量. ...
Global glacier change bulletin No
1
3
... 此外,通过对比祁连山的水管河4号冰川、七一冰川、十一冰川、透明梦珂冰川,以及天山的乌鲁木齐河源1号冰川和青冰滩72号冰川近年来的物质平衡结果发现:在相近时间段,NC01冰川物质亏损更为强烈(表2).可能原因是NC01冰川规模较小,对气候变化的响应更加敏感.在当前的气候状态下,有不少冰川物质平衡线高度都超过了冰川的最高海拔,使得整个冰川都处于消融状态[51].根据Cao等[36]和本文的研究,NC01冰川物质平衡线近10年的平均高度约为4 680 m,已超过了冰川的最高海拔,这也加快了冰川负物质平衡.因此,可以推测,在当前的气候背景下,NC01冰川将在不久后完全消失.Cao等[52]根据冰川ELA高度也认为,目前冷龙岭地区的冰川还需要继续退缩才能与气候达到平衡,伴随着大部分冰川的消失. ...
An investigation on changes in glacier mass balance and hypsometry for a small mountainous glacier in the northeastern Tibetan Plateau
2
2017
... 此外,通过对比祁连山的水管河4号冰川、七一冰川、十一冰川、透明梦珂冰川,以及天山的乌鲁木齐河源1号冰川和青冰滩72号冰川近年来的物质平衡结果发现:在相近时间段,NC01冰川物质亏损更为强烈(表2).可能原因是NC01冰川规模较小,对气候变化的响应更加敏感.在当前的气候状态下,有不少冰川物质平衡线高度都超过了冰川的最高海拔,使得整个冰川都处于消融状态[51].根据Cao等[36]和本文的研究,NC01冰川物质平衡线近10年的平均高度约为4 680 m,已超过了冰川的最高海拔,这也加快了冰川负物质平衡.因此,可以推测,在当前的气候背景下,NC01冰川将在不久后完全消失.Cao等[52]根据冰川ELA高度也认为,目前冷龙岭地区的冰川还需要继续退缩才能与气候达到平衡,伴随着大部分冰川的消失. ...
... Mass balance of different glaciers in China
Table 2| 冰川名称 | 冰川面积/km2 | 年物质平衡/(m w.e.) | 观测时段 | 观测方法 | 数据来源 |
|---|
| 乌鲁木齐河源1号 | 1.58 | -0.627 | 2010—2019年 | 冰川学方法 | WGMS |
| 青冰滩72号 | 6.60 | -0.378 | 2008—2014年 | 冰川学方法 | [53-54] |
| 透明梦珂 | 20.42 | -0.309 | 2010—2012年 | 冰川学方法 | [30] |
| 七一 | 2.53 | -0.476 | 2011—2016年 | 冰川学方法 | [28,55] |
| 十一 | 0.50 | -0.530 | 2000—2012年 | 大地测量法 | [31,56] |
| 水管河4号 | 1.40 | -0.510 | 2010—2013年 | 冰川学方法 | [52] |
| 宁缠河1号 | 0.54 | -0.980 | 2010—2020年 | 冰川学方法 | 本研究 |
注:冰川面积数据来源于国家青藏高原科学数据中心中国第二次冰川编目数据集[57]. ...
2008-2014年青冰滩72号冰川物质平衡特征分析
1
2020
... Mass balance of different glaciers in China
Table 2| 冰川名称 | 冰川面积/km2 | 年物质平衡/(m w.e.) | 观测时段 | 观测方法 | 数据来源 |
|---|
| 乌鲁木齐河源1号 | 1.58 | -0.627 | 2010—2019年 | 冰川学方法 | WGMS |
| 青冰滩72号 | 6.60 | -0.378 | 2008—2014年 | 冰川学方法 | [53-54] |
| 透明梦珂 | 20.42 | -0.309 | 2010—2012年 | 冰川学方法 | [30] |
| 七一 | 2.53 | -0.476 | 2011—2016年 | 冰川学方法 | [28,55] |
| 十一 | 0.50 | -0.530 | 2000—2012年 | 大地测量法 | [31,56] |
| 水管河4号 | 1.40 | -0.510 | 2010—2013年 | 冰川学方法 | [52] |
| 宁缠河1号 | 0.54 | -0.980 | 2010—2020年 | 冰川学方法 | 本研究 |
注:冰川面积数据来源于国家青藏高原科学数据中心中国第二次冰川编目数据集[57]. ...
Characteristics of a partially debris-covered glacier and its response to atmospheric warming in Mt. Tomor, Tien Shan, China
1
2017
... Mass balance of different glaciers in China
Table 2| 冰川名称 | 冰川面积/km2 | 年物质平衡/(m w.e.) | 观测时段 | 观测方法 | 数据来源 |
|---|
| 乌鲁木齐河源1号 | 1.58 | -0.627 | 2010—2019年 | 冰川学方法 | WGMS |
| 青冰滩72号 | 6.60 | -0.378 | 2008—2014年 | 冰川学方法 | [53-54] |
| 透明梦珂 | 20.42 | -0.309 | 2010—2012年 | 冰川学方法 | [30] |
| 七一 | 2.53 | -0.476 | 2011—2016年 | 冰川学方法 | [28,55] |
| 十一 | 0.50 | -0.530 | 2000—2012年 | 大地测量法 | [31,56] |
| 水管河4号 | 1.40 | -0.510 | 2010—2013年 | 冰川学方法 | [52] |
| 宁缠河1号 | 0.54 | -0.980 | 2010—2020年 | 冰川学方法 | 本研究 |
注:冰川面积数据来源于国家青藏高原科学数据中心中国第二次冰川编目数据集[57]. ...
祁连山七一冰川表面运动特征最新观测研究
1
2014
... Mass balance of different glaciers in China
Table 2| 冰川名称 | 冰川面积/km2 | 年物质平衡/(m w.e.) | 观测时段 | 观测方法 | 数据来源 |
|---|
| 乌鲁木齐河源1号 | 1.58 | -0.627 | 2010—2019年 | 冰川学方法 | WGMS |
| 青冰滩72号 | 6.60 | -0.378 | 2008—2014年 | 冰川学方法 | [53-54] |
| 透明梦珂 | 20.42 | -0.309 | 2010—2012年 | 冰川学方法 | [30] |
| 七一 | 2.53 | -0.476 | 2011—2016年 | 冰川学方法 | [28,55] |
| 十一 | 0.50 | -0.530 | 2000—2012年 | 大地测量法 | [31,56] |
| 水管河4号 | 1.40 | -0.510 | 2010—2013年 | 冰川学方法 | [52] |
| 宁缠河1号 | 0.54 | -0.980 | 2010—2020年 | 冰川学方法 | 本研究 |
注:冰川面积数据来源于国家青藏高原科学数据中心中国第二次冰川编目数据集[57]. ...
Recent geodetic mass balance and extent changes of very small glaciers in the Hulugou basin, central Qilian Mountains, China
1
2019
... Mass balance of different glaciers in China
Table 2| 冰川名称 | 冰川面积/km2 | 年物质平衡/(m w.e.) | 观测时段 | 观测方法 | 数据来源 |
|---|
| 乌鲁木齐河源1号 | 1.58 | -0.627 | 2010—2019年 | 冰川学方法 | WGMS |
| 青冰滩72号 | 6.60 | -0.378 | 2008—2014年 | 冰川学方法 | [53-54] |
| 透明梦珂 | 20.42 | -0.309 | 2010—2012年 | 冰川学方法 | [30] |
| 七一 | 2.53 | -0.476 | 2011—2016年 | 冰川学方法 | [28,55] |
| 十一 | 0.50 | -0.530 | 2000—2012年 | 大地测量法 | [31,56] |
| 水管河4号 | 1.40 | -0.510 | 2010—2013年 | 冰川学方法 | [52] |
| 宁缠河1号 | 0.54 | -0.980 | 2010—2020年 | 冰川学方法 | 本研究 |
注:冰川面积数据来源于国家青藏高原科学数据中心中国第二次冰川编目数据集[57]. ...
中国第二次冰川编目数据集(V
1
1
... 注:冰川面积数据来源于国家青藏高原科学数据中心中国第二次冰川编目数据集[57]. ...
中国第二次冰川编目数据集(V
1
1
... 注:冰川面积数据来源于国家青藏高原科学数据中心中国第二次冰川编目数据集[57]. ...


 甘公网安备 62010202000676号