1961—2016年东北地区冬季寒潮事件变化特征及其对区域气候变暖的响应
胡春丽 , 1 , 李辑 , 1 , 郭婷婷 , 1 , 王婉昭 1 , 王婷 1 , 丁抗抗 2 , 焦敏 3 , 李菲 4
1.辽宁省生态气象和卫星遥感中心, 辽宁 沈阳 110166
2.辽宁省气象信息中心, 辽宁 沈阳 110166
3.中国气象局 沈阳大气环境研究所, 辽宁 沈阳 110166
4.沈阳区域气候中心, 辽宁 沈阳 110166
Variation characteristics of winter cold wave events in Northeast China and its response to regional climate warming during 1961—2016
HU Chunli , 1 , LI Ji , 1 , GUO Tingting , 1 , WANG Wanzhao 1 , WANG Ting 1 , DING Kangkang 2 , JIAO Min 3 , LI Fei 4
1.Eco-Meteorology and Satellite Remote Sensing Center of Liaoning Province,Shenyang 110166,China
2.Meteorological Information Center of Liaoning Province,Shenyang 110166,China
3.Shenyang Institute of Atmospheric Environment,China Meteorological Administration,Shenyang 110166,China
4.Shenyang Regional Climate Center,Shenyang 110166,China
通讯作者: 李辑,正研级高级工程师,主要从事气候变化、短期气候预测研究. E-mail: cqliji@sina.com 郭婷婷,工程师,主要从事生态与农业气象、卫星遥感应用研究. E-mail: hgfcp@yeah.net
编委: 武俊杰
收稿日期: 2020-09-25
修回日期: 2021-01-29
基金资助:
国家重点研发计划项目 . 2018YFC1505601
Received: 2020-09-25
Revised: 2021-01-29
摘要
利用东北地区1961—2016年164个气象台站逐日平均气温和最低气温数据,根据国家标准《寒潮等级》(GB/T 21987—2017)的单站冷空气等级,计算近56年来各单站不同等级冷空气过程的频次、强度、持续日数,应用趋势系数、Mann-Kendall检验、小波分析、相似系数等统计方法,研究了东北地区三种类型寒潮(超强寒潮、强寒潮、寒潮)的气候变化特征。结果表明:三种类型寒潮日数空间分布存在明显的地区差异,高海拔地区相对偏多,低海拔和平原地区相对偏少。年尺度上,1961—2016年三种类型寒潮日数和站次呈减少趋势,减少速率呈现为超强寒潮>强寒潮>寒潮;年代尺度上,三者均在20世纪60年代到70年代末期相对偏多,1980年开始进入一个相对偏少的时段,21世纪00年代中期以后有小幅度增加;寒潮日数和站次均存在明显的3~5 a短周期性变化。1961—2016年东北地区冬季气温在空间变化上全区呈一致的增加趋势,66%的站点增温显著,检测到冬季气温的突变点为1981年。东北地区气候变暖后,三种类型寒潮日数和站次均有明显的减少。
关键词:
东北地区 寒潮 特征 气候变暖 响应
Abstract
Based on the daily average air temperature and minimum air temperature data of 164 meteorological stations in Northeast China from 1961 to 2016, according to the Chinese national standard Grade of cold wave (GB/T 21987—2017), we applied linear trend, trend coefficient, Mann-Kendall test, wavelet analysis and other analytical methods, and calculated the occurrence frequency, temperature drop and continuous days of the cold wave process of the stations, and spatial and temporal distribution characteristics of the cold wave in Northeast China were analyzed. The results show that the winter average air temperature of each station has a small correlation with cold wave days of three types (super-strong cold wave, strong cold wave and cold wave). The colder areas with lower average temperature in winter and the warmer areas with higher temperature have little difference in the number of cold wave days. There are obvious regional differences in the spatial distribution of the three types of cold wave days. There are relatively more in high-altitude areas, and relatively few in low-altitude and plain areas. This conclusion is consistent with the actual occurrence of cold waves. The distribution characteristics of the three types of cold waves are determined by the cold wave path. When cold air enters from the east, middle, and west routes, the Greater Khingan Range and west side of the Changbai Mountains are most affected, and the Songliao Plain on the east side of the Greater Khingan Range is affected by the foehn effect and low altitude factors. The cold air gradually degenerates, the degree of influence gradually decreases and weakens; the Sanjiang Plain is affected by the regional climate and the blocking effect of the Lesser Khingan Range and the Changbai Mountains on the cold air, the cold wave is weaker, and the number of days is less. On the annual scale, the number of days and station-times of the three types of cold waves showed a decreasing trend from 1961 to 2016, and the rate of decrease was super strong cold wave > strong cold wave > cold wave; On the decadal scale, the three were relatively high from the 1960s to the end of the 1970s, and entered a relatively small period since 1980. There was a small increase after the mid-2000s, but the magnitude was significantly smaller than that of the 1980s. The rate of decrease means that the frequency of cold waves has increased since the beginning of the 21st century, but the long-term downward trend has not changed. Both the number of cold wave days and the number of station-times have obvious short-term periodic changes of 3 to 5 years. Before the 2000s, the period was mainly about 3 years, and in the 2000s, the period was about 5 years. The spatial variation of winter temperature in Northeast China from 1961 to 2016 showed a consistent increase in the whole region, and 66% of the stations increased significantly. The mutation point of the winter temperature was detected in 1981. After the climate in Northeast China warmed, the number of cold wave days and station-times of the three types decreased significantly, with the most significant decrease in eastern Jilin and northeastern Liaoning.
Keywords:
Northeast China cold wave characteristics climate warming response
本文引用格式
胡春丽, 李辑, 郭婷婷, 王婉昭, 王婷, 丁抗抗, 焦敏, 李菲. 1961—2016年东北地区冬季寒潮事件变化特征及其对区域气候变暖的响应 [J]. 冰川冻土 , 2021, 43(6): 1755-1763 doi:10.7522/j.issn.1000-0240.2021.0110
HU Chunli, LI Ji, GUO Tingting, WANG Wanzhao, WANG Ting, DING Kangkang, JIAO Min, LI Fei. Variation characteristics of winter cold wave events in Northeast China and its response to regional climate warming during 1961—2016 [J]. Journal of Glaciology and Geocryology
0 引言
气候系统变暖仍在持续,极端天气气候事件风险进一步加剧。20世纪50年代以来,观测到的许多变化在几十年乃至上千年都前所未有,主要表现在大气和海洋变暖、积雪减少、冰川萎缩、海平面上升、温室气体浓度增加[1 ] ,会导致极端气候事件发生得更加频繁。寒潮作为一种极端气候事件,是自极地或寒带的寒冷空气向中、低纬度的侵袭活动,在我国冬、春季频繁发生,造成气温急剧下降,并伴有大风和雨雪天气。不仅造成经济损失,也会给农业生产、交通运输和人体健康等带来严重的影响[2 -3 ] 。长期以来,国内外众多学者针对寒潮天气过程,从冷空气源地和路径、寒潮机理、气候特征等方面进行了大量研究[4 -17 ] ,形成了比较系统和经典的寒潮理论。在气候变暖背景下,随着气象资料的积累和更新,研究发现中国寒潮频次和强度呈现新的变化特征[18 -22 ] ,而区域尺度寒潮变化特征各有不同。毛炜峄等[23 ] 分析了1951— 2015年乌鲁木齐市寒潮过程频数及强度气候特征,秋、冬、春季的寒潮过程频数大多在20世纪50年代最多。姚永明等[24 ] 研究发现长江中下游地区寒潮的发生随着全球变暖的气候趋势,总体频次减少,有明显的年代际特征。刘宪锋等[25 ] 揭示1960—2013年内蒙古单站寒潮频次总体呈下降趋势,而1991年之后呈增加趋势,寒潮主要受北极涛动(AO)、北大西洋涛动(NAO)、冷空气(CA)、亚洲极涡强度指数(APVII)和东亚大槽强度(CQ)控制。
本文根据寒潮国标定义,利用最新的气象资料,研究气候变暖背景下东北地区冬季寒潮变化特征,研究结果有助于深入了解东北冬季气候变化规律,探讨区域气候变化的原因,为未来准确预测寒潮等级、提高气象防灾减灾能力提供科学依据。
1 数据与方法
1.1 数据
本文研究区域行政上包括黑龙江、吉林、辽宁三省,采用的数据由辽宁省气象信息气象档案馆提供的1961—2016年东北地区164个地面气象观测站逐日气温、最低气温资料,站点分布均匀,时间序列较长。12月至翌年2月为冬季(如1961年冬季为1961年12月至1962年2月),常年值采用1981—2010年30年的平均值。
1.2 寒潮等级定义
本文参照中华人民共和国国家标准《寒潮等级》[26 ] (GB/T 21987—2017),给出寒潮等级判定。寒潮:某地的日最低气温24小时内降温幅度≥8 ℃或48小时内降温幅度≥10 ℃,72小时内降温幅度≥12 ℃,而且该地日最低气温≤4 ℃的冷空气活动。强寒潮:某地的日最低气温24小时内降温幅度≥10 ℃或48小时内降温幅度≥12 ℃,72小时内降温幅度≥14 ℃,而且该地日最低气温≤2 ℃的冷空气活动。超强寒潮:某地的日最低气温24小时内降温幅度≥12 ℃或48小时内降温幅度≥14 ℃,72小时内降温幅度≥16 ℃,而且该地日最低气温≤0 ℃的冷空气活动。寒潮日定义为降温过程初终日之间(含初、终日)的天数,即各类寒潮造成的极端低温日数。
1.3 方法
采用线性倾向估计法分析寒潮的变化趋势,蒙特卡洛方法对空间变化趋势进行显著性检验[27 ] ,Mann-Kendell(M-K)检验寒潮的突变特征,Morlet小波[28 ] 分析方法进行周期分析。
1.3.1 Mann-Kendall检验
Mann-Kendall检验是一种非参数统计方法[27 ] ,假设时间序列数据(x 1 ,x 2 ,…,xn ),n 为样本数,M-K统计变量S 的计算公式为
S = ∑ k = 1 n - 1 ∑ j = k + 1 n s g n ( x j - x k ) (1)
s g n ( x j - x k ) = + 1 , ( x j - x k ) > 0 0 , ( x j - x k ) = 0 - 1 , ( x j - x k ) < 0 (2)
U F k = [ S k - E ( S k ) ] V a r ( S k ) (3)
若UFk
1.3.2 相似系数
采用相似系数定量表示两幅图的相似性,计算公式[29 ] 为
c o s θ 12 = ∑ i = 1 n x i y i ∑ i = 1 n x i 2 ∑ i = 1 n y i 2 (4)
式中:c o s θ 12 n ± 1 表示相似性越大,等于± 1 表示完全正(反)相似。
2 结果与分析
2.1 寒潮的空间分布特征
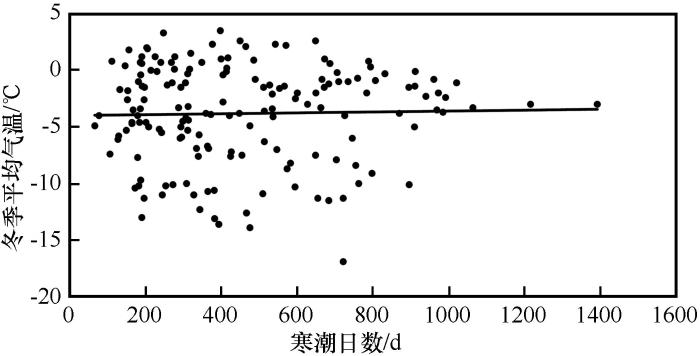
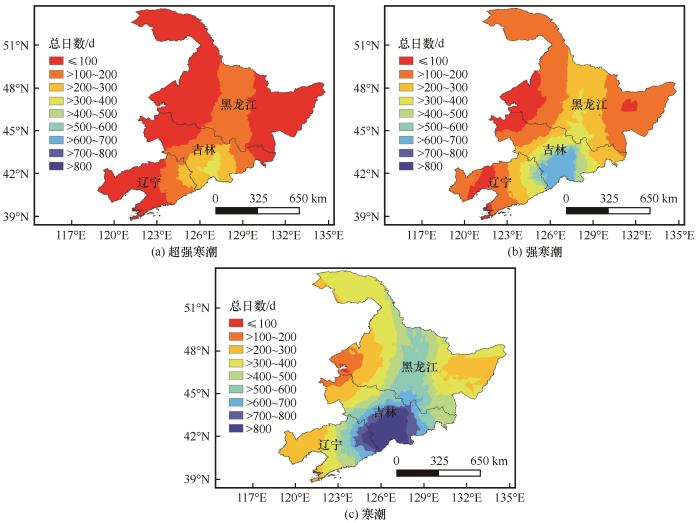
东北地区各站冬季平均气温与超强寒潮、强寒潮、寒潮出现日数相关程度较小,东北地区164站冬季平均气温与超级寒潮日数(图略)、强寒潮日数(图略)、寒潮日数关系的散点图(图1 )表明冬季平均气温偏低的偏冷地区与气温偏高的偏暖区,寒潮日数差异小。从东北地区1961—2016年寒潮出现总日数空间分布来看(图2 ),超强寒潮日数区域性较为明显,为4~530 d,其中黑龙江超强寒潮日数中部多,东西少,吉林东部多,西部少,辽宁东北部多,西南部少;高值中心位于吉林东南部靖宇(530 d),该结论与乔雪梅等[30 ] 研究基本一致,低值中心位于辽宁西部和南部、吉林西北部、黑龙江西部和东部部分地区,上述地区超强寒潮出现日数不足30 d,其中黑龙江齐齐哈尔地区甘南站超强寒潮日数为4 d;东北地区强寒潮、寒潮出现日数空间分布与超强寒潮日数相类似,强寒潮、寒潮日数以吉林东南部靖宇为高值中心,出现日数分别为900 d和1 392 d,黑龙江中部、辽宁东北部出现日数相对偏多,黑龙江、吉林西部出现日数相对较少,低值中心位于黑龙江西部甘南,出现日数分别为19 d和67 d。计算得到图2 (a)和图2 (b)、图2 (c)的相似系数为0.99和0.96,可见超级寒潮、强寒潮、寒潮相似性较高,表明超强寒潮偏多(少)的地区,强寒潮、寒潮同样偏多(少)。
图1
图1
东北地区164站冬季平均气温与寒潮日数的关系
Fig.1
Relationship between winter average air temperature and cold wave days at 164 stations in Northeast China
图2
图2
1961—2016年东北地区三种类型寒潮总日数空间分布
Fig.2
Spatial distribution of total cold wave days of three types in Northeast China during 1961—2016: super-strong cold wave (a), strong cold wave (b) and cold wave (c)
由以上分析可见,东北地区超级寒潮、强寒潮、寒潮日数空间分布相似,东部山区超级寒潮、强寒潮、寒潮出现日数最多,位于内陆地区为最少;超级寒潮、强寒潮、寒潮的空间分布与海陆、地形分布有一定的关系,高海拔地区相对偏多,低海拔和平原相对偏少,大兴安岭、小兴安岭和长白山属于三种类型寒潮发生日数较多地区,松辽平原和三江平原寒潮发生日数最少。三种类型寒潮分布特点与寒潮路径决定,我国冷空气从东、中、西三条路线进入时,大兴安岭和长白山西侧受到影响最大,大兴安岭东侧松辽平原由于焚风效应及海拔低的因素影响,冷空气逐渐变性,影响程度逐渐减少减弱;三江平原受区域气候影响及小兴安岭和长白山对冷空气阻滞作用,寒潮影响较弱,发生日数最少。
2.2 寒潮的时间演变规律
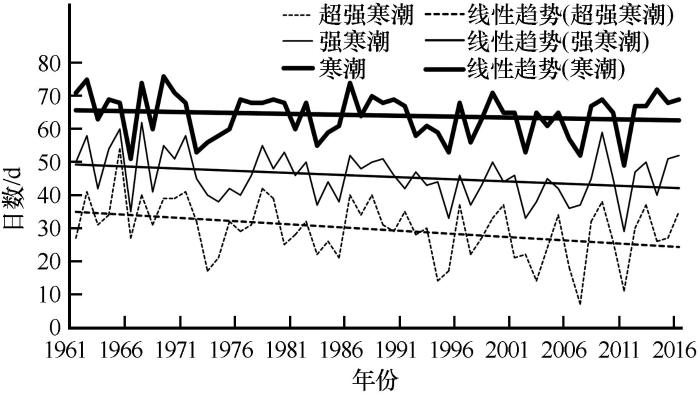
1961—2016年东北地区冬季超强寒潮、强寒潮、寒潮日数均呈减少趋势(图3 )。其中超强寒潮、强寒潮减少趋势显著,超级寒潮自20世纪80年代初期开始减少,减少速率为1.9 d·(10a)-1 ,减少趋势系数为-0.35,通过了0.01显著性水平检验,同时也是3个等级寒潮减少速率最大的,2007年达到最小值。强寒潮以1.3 d·(10a)-1 的速率呈显著减少趋势,并通过了0.05显著性水平检验。20世纪80年代末期到90年代为比较明显的偏少时段,21世纪00年代以后呈明显地波动变化。寒潮以0.5 d·(10a)-1 的速率呈显著减少趋势,未通过0.05显著性水平检验。从年代际变化来看,三者均在20世纪60年代到90年代初期相对偏多,20世纪90年代中期开始进入一个相对偏少的时段,21世纪00年代中期以后有所增加。超强寒潮和强寒潮、强寒潮和寒潮、超强寒潮和寒潮三者相关系数分别0.77、0.78、0.69,表明寒潮偏多(少)年份,超级寒潮、强寒潮偏多(少)。
图3
图3
1961—2016年东北地区超强寒潮、强寒潮、寒潮日数年际变化
Fig.3
Interannual changes of super-strong cold wave days, strong cold wave days and cold wave days in Northeast China during 1961—2016
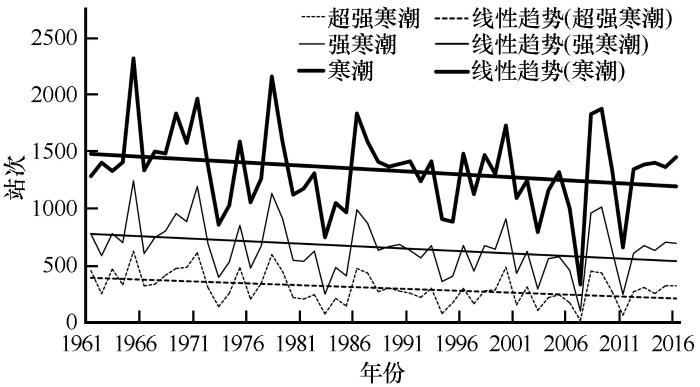
1961—2016年东北地区寒潮站次(超强寒潮、强寒潮、寒潮)均呈减少趋势(图4 )。超强寒潮、强寒潮、寒潮站次分别以32.9站次•(10a)-1 、43.3站次•(10a)-1 、51.7站次•(10a)-1 的速率减少,趋势系数分别为-0.386、-0.305、-0.235,超强寒潮和强寒潮减少速率通过了0.01、0.05显著性水平检验。从年代际变化来看,三者均在20世纪60年代到70年代末期相对偏多,1980年开始进入一个相对偏少的时段,2007年达到极端最少值,21世纪00年代中期以后有所增加,但是长期下降趋势没有改变[31 ] 。其中,超强寒潮站次最少5年分别为2007年、2011年、1983年、1994年、2003年,均发生在20世纪80年代后,最多5年为1970年、2000年、1978年、1971年、1965年,大部分发生在20世纪80年代前。
图4
图4
东北地区1961—2016年超强寒潮、强寒潮、寒潮站次年际变化
Fig.4
Interannual changes of super-cold wave station-times, strong cold wave station-times and cold wave station-times in Northeast China during 1961—2016
超强寒潮和强寒潮、强寒潮和寒潮、超强寒潮和寒潮三者相关系数分别0.97、0.97、0.91,表明寒潮站次偏多(少)年份,超级寒潮、强寒潮站次偏多(少)。
2.3 寒潮的周期特征
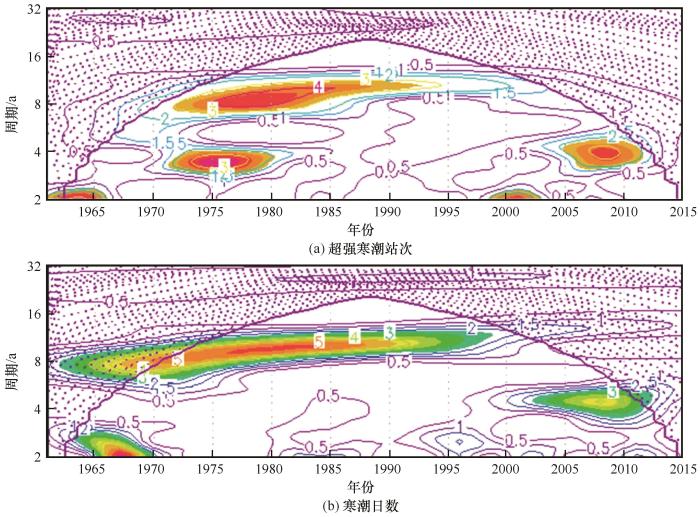
使用Morlet小波分析方法,分析东北地区三种类型寒潮站次和日数的周期特征(图5 给出了超强寒潮站次和寒潮日数)。小波分析表明,超强寒潮日数、超强寒潮站次、强寒潮日数、强寒潮站次、寒潮日数、寒潮站次的周期性特征很明显,在整个分析时段内存在明显的周期性变化。超强寒潮日数、强寒潮日数、寒潮日数分别在1977—1994年、1970—1992年和1970—2000年有3 a左右周期,在2000—2014年、2004—2014年和2002—2014年有4~5 a左右周期;超强寒潮站次、强寒潮站次、寒潮站次分别在1972—1992年、1972—1998年、1972—2000年有3~4 a左右周期,均在21世纪00年代以后有4~5 a左右周期。
图5
图5
东北地区寒潮周期特征
Fig.5
Periodic characteristics of cold wave in Northeast China: super-cold wave station-times (a) and cold wave days (b)
2.4 寒潮与气候变暖的关系
2.4.1 冬季气温变化
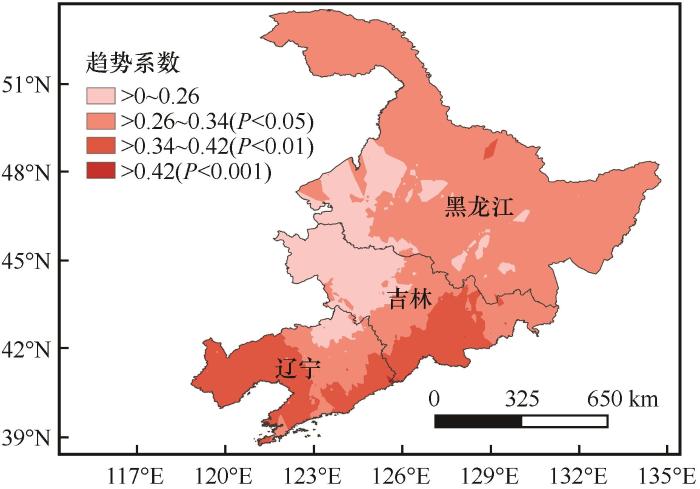
气温平均值的增加和气温变率的增加都会对极端气温事件产生影响[32 ] 。气候变暖伴随着最高及最低气温的增温,最高气温和最低气温的平均值会发生改变,寒潮也会发生相应地改变,进而影响到寒潮出现的日数和站次。随着气候变暖,发现东北平均气温呈显著的增温趋势,分析1961—2016年东北冬季气温的空间变化趋势(图6 ),全区100%站点呈现增加趋势,66%的站点通过了0.05显著性水平检验,37%的站点通过了0.01显著性水平检验,15%的站点(黑龙江省2个站、吉林省8个站、辽宁省10个站)通过了0.001显著性水平检验,增温最显著区域主要位于吉林东南部、辽宁西部和辽宁东北部地区,其中吉林二道站和辽宁本溪站趋势系数0.55以上。黑龙江、吉林、辽宁分别有37%、35%、24%站点增温不显著,低值中心位于黑龙江西部(泰来站趋势系数0.09)和吉林西部地区(农安站趋势系数0.03)。
图6
图6
东北地区气温变化趋势系数的空间分布
Fig.6
Spatial distribution of air temperature trend coefficients in Northeast China
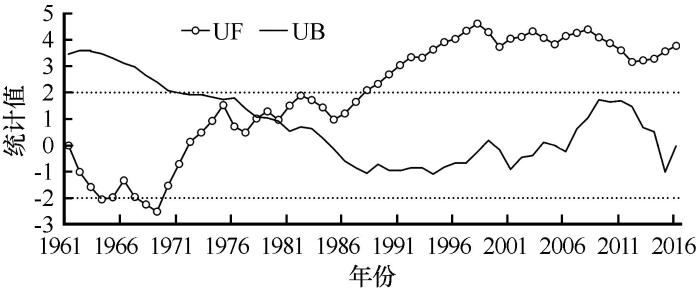
图7 给出1961—2016年东北地区冬季平均气温的Mann-Kendall突变检验。可见,UF曲线在1972年以后均大于0,且在1987年以后突破临界线,表明1972年以来东北地区冬季平均气温呈上升趋势,且1987年以后上升趋势显著。UF和UB曲线在1981年左右出现交点,且交点在临界线之间,说明1981年为东北地区冬季平均气温发生新突变的时间,该结论与前人基于1961—2007年东北气温资料计算结果不一致[33 ] 。利用本文处理的冬季1961—2007年气温资料,得到突变点为1986/1987年,结论与已有研究相同[33 ] ,资料延长至2016年,突变点为1981年,东北地区冬季气温突变点发生漂移。
图7
图7
东北地区冬季平均气温的Mann-Kendall检验
Fig.7
Mann-Kendall test of average winter air temperature in Northeast China
2.4.2 寒潮对气候变暖的响应
分析1961—2016年东北地区气温与寒潮的相关系数,超强寒潮、强寒潮、寒潮日数与冬季平均气温均是显著的负相关,相关系数系数为-0.318、 -0.246、-0.220,其中超强寒潮与气温相关性均通过了0.05显著性水平检验,这说明寒潮事件与东北地区气候变暖密切相关。使用Mann-Kendell方法对东北地区冬季平均气温分析发现1981年发生了突变,将1961—2016年分为1961—1981年和1982—2016年两个时段,分别统计两个时段寒潮的发生日数,站次(表1 )。可见气候变暖后超强寒潮日数、超强寒潮站次、强寒潮日数、强寒潮站次、寒潮日数、寒潮站次一致减少。
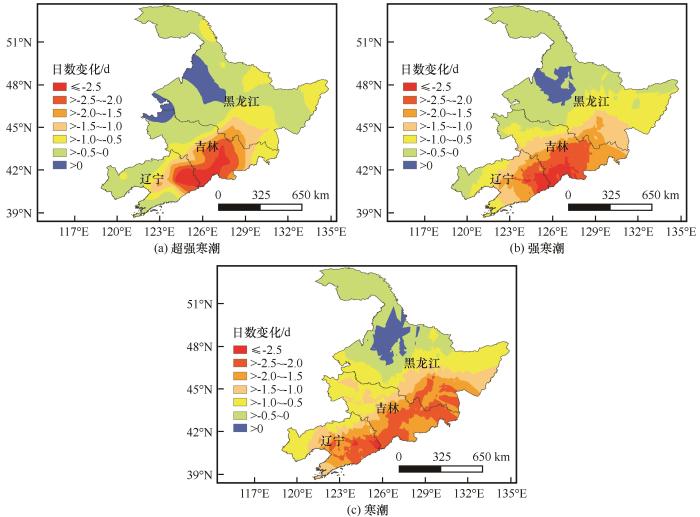
根据气候暖期减冷期寒潮日数差值空间分布(图8 ),黑龙江中部地区超强寒潮、强寒潮、寒潮暖期较冷期偏多0.2~0.6 d、0.1~1.5 d、0.1~3.2 d,主要位于冬季气温增暖不显著区域,其他地区寒潮暖期较冷期偏少为主,超强寒潮偏少中心主要位于黑龙江的东南部、吉林的东部、辽宁的东南部地区,其中辽宁抚顺新宾站偏少4.3 d。强寒潮、寒潮冷暖期差值空间分布形式与超强寒潮大致相同,暖期偏少,日数较大值依然分布在吉林东部和辽宁东北部地区;强寒潮暖期较冷期偏少,最大值出现在辽宁本溪站,为-5.3 d,寒潮的最大差值出现在吉林柳河站,为-4.3 d。
图8
图8
东北地区气候变暖前后寒潮日数差值的空间分布
Fig.8
Spatial distribution of number differences of cold wave days before and after climate warming: super-strong cold wave (a), strong cold wave (b) and cold wave (c)
3 结论
本文根据《寒潮等级》国家标准,对东北地区1961—2016年寒潮事件的气候变化特征进行了分析,结论如下:
(1)东北地区冬季三种类型寒潮日数空间分布相似,吉林东部长白山高海拔地区寒潮日数最多,三江平原受区域气候影响及小兴安岭和长白山对冷空气阻滞作用,寒潮发生日数最少,该结论与寒潮实际发生情况相吻合。
(2)1961—2016年东北地区冬季三种类型寒潮日数、站次均呈减少趋势;从年代际变化来看,三者均在20世纪60年代到70年代末期相对偏多,1980年开始进入一个相对偏少的时段,21世纪00年代中期以后有小幅度增加,但其幅度明显小于80年代减少幅度,即进入21世纪以来寒潮频次有所增加,但是长期下降趋势没有改变。
(3)东北地区冬季三种类型寒潮日数和站次存在明显的周期性变化,21世纪00年代前以3 a左右周期为主,00年代前后以5 a左右周期为主。
(4)1961—2016年东北大部地区冬季升温显著,检测到的突变时间为1981年,变暖后三种类型寒潮日数和站次明显减少,吉林东部和辽宁东北部减少最为明显。东北冬季气温突变时间为1981年,前人研究资料截止至2007年,东北冬季气温的突变时间为1986/1987年,资料的延长致使突变时间发生了漂移,新的气候突变时间与冬季气温主要影响环流因子的年代际转折可能存在一定的联系,也有待于未来进一步研究。
参考文献
View Option
[1]
IPCC Climate change 2014: impacts, adaptation, and vulnerability: contribution of working group II to the fifth assessment report of the intergovernmental panel on climate change [M]. Cambridge, UK : Cambridge University Press , 2014 .
[本文引用: 1]
[2]
Li Xinyi Xie Na Shi Juan et al Analysis of a cold wave weather process in Chengdu in March 2010
[J]. Meteorological and Environmental Research , 2011 , 2 (6 ): 1 -5 .
[本文引用: 1]
[3]
Tang Mengqi Zeng Gang Decadal variability of spring cold wave across Northeast China in the past 30 years and its possible causes
[J]. Climatic and Environmental Research , 2017 , 22 (4 ): 473 -486 .
[本文引用: 1]
唐孟琪 , 曾刚 近30多年中国东北地区春季寒潮的年代际变化及其可能原因
[J]. 气候与环境研究 , 2017 , 22 (4 ): 473 -486 .
[本文引用: 1]
[4]
Wang Zunya Ding Yihui Climate change of the cold wave frequency of China in the last 53 years and possible reasons
[J]. Chinese Journal of Atmospheric Sciences , 2006 (6 ): 1068 -1076 .
[本文引用: 1]
王遵娅 , 丁一汇 近53年中国寒潮的变化特征及其可能原因
[J]. 大气科学 , 2006 (6 ): 1068 -1076 .
[本文引用: 1]
[5]
Qian Weihong Zhang Weiwei Changes in cold wave events and warm winter in China during the last 46 years
[J]. Chinese Journal of Atmospheric Sciences , 2007 (6 ): 1266 -1278 .
钱维宏 , 张玮玮 我国近46年来的寒潮时空变化与冬季增暖
[J]. 大气科学 , 2007 (6 ): 1266 -1278 .
[6]
Ding Yihui Ma Xiaoqing Analysis of isentropic potential vorticity for a strong cold wave during 2004/2005 winter
[J]. Acta Meteorologica Sinica , 2008 , 22 (2 ): 129 -141 .
[7]
Yan Qi Tian Li Li Shuang et al Multiple-time scale variations and impact factors of regional cold air in Liaoning Province
[J]. Journal of Glaciology and Geocryology , 2016 , 38 (2 ): 379 -387 .
阎琦 , 田莉 , 李爽 , 等 辽宁区域性冷空气多时间尺度变化特征及影响因子
[J]. 冰川冻土 , 2016 , 38 (2 ): 379 -387 .
[8]
Ma Xiaoqing Analysis of strong cold waves in China during warm winter periods
[D]. Nanjing : Nanjing University of Information Science , 2007 .
马晓青 中国暖冬时期强寒潮事件的分析
[D]. 南京 : 南京信息工程大学 , 2007 .
[9]
Meng Xiangjun Wu Zhengfang Du Haibo et al Spatio-temporal characteristics of cold wave over Northeast China during 1961-2010
[J]. Journal of Arid Land Resources and Environment , 2013 , 27 (1 ): 142 -147 .
孟祥君 , 吴正方 , 杜海波 , 等 1961-2010年东北地区寒潮活动的时空特征分析
[J]. 干旱区资源与环境 , 2013 , 27 (1 ): 142 -147 .
[10]
Zhang Lin Junmei Lü Ding Minghu Impact of arctic extreme cyclones on cold spells in China during early 2015
[J]. Journal of Applied Meteorological Science , 2020 , 31 (3 ): 315 -327 .
张琳 , 吕俊梅 , 丁明虎 2015年初北极极端气旋对中国寒潮的影响
[J]. 应用气象学报 , 2020 , 31 (3 ): 315 -327 .
[11]
Bai Songzhu Habudula Boernan Xie Xiuqin The variation characteristics of cold wave in Altay Prefecture under climate warming background
[J]. Journal of Glaciology and Geocryology , 2015 , 37 (2 ): 387 -394 .
白松竹 , 博尔楠·哈不都拉 , 谢秀琴 气候变暖背景下阿勒泰地区寒潮活动变化特征
[J]. 冰川冻土 , 2015 , 37 (2 ): 387 -394 .
[12]
Li Shangfeng Gao Zongting Yang Xu et al Characteristics of temperature decline between two adjacent days and its interdecadal change during winter in Northeast China
[J]. Journal of Meteorology and Environment , 2019 , 35 (6 ): 77 -84 .
李尚锋 , 高枞亭 , 杨旭 . 等 . 中国东北冬季相邻两天降温特征及其年代际变化
[J]. 气象与环境学报 , 2019 , 35 (6 ): 77 -84 .
[13]
Jiang Yuan’an Yin Yizhou Fan Jing et al Various levels of cold air in Xinjiang region from 1961 through 2016: climatic characteristics and variation
[J]. Journal of Glaciology and Geocryology , 2018 , 40 (3 ): 448 -460 .
江远安 , 尹宜舟 , 樊静 , 等 1961-2016年新疆单站不同等级冷空气过程气候特征及变化
[J]. 冰川冻土 , 2018 , 40 (3 ): 448 -460 .
[14]
Li Wanrong Zhang Tao Temporal and spatial distribution characteristics of cold waves in eastern Hexi Corridor during
1960 -2017 [J]. Journal of Arid Meteorology , 2019 , 37 (5 ): 747 -753 .
李万荣 , 张弢 1960-2017年河西走廊东部寒潮时空变化特征
[J]. 干旱气象 , 2019 , 37 (5 ): 747 -753 .
[15]
Cai Bo Interdecadal variations of autumn cold surge paths over North China and its possible mechanism
[D]. Nanjing : Nanjing University of Information Science , 2019 .
蔡博 华北秋季寒潮路径的年代际变化特征及其可能机理
[D]. 南京 : 南京信息工程大学 , 2019 .
[16]
Habudula Boernan Huang Yijing Jiang Yuan’an et al Climate characteristics of frequency and intensity of cold wave in Altay during 1954-2016
[J]. Desert and Oasis Meteorology , 2019 , 13 (1 ): 79 -86 .
博尔楠·哈不都拉 , 黄迆静 , 江远安 , 等 1954-2016年阿勒泰市春季寒潮过程频数及强度气候特征
[J]. 沙漠与绿洲气象 , 2019 , 13 (1 ): 79 -86 .
[17]
Bai Hanbing Change of cold wave trajectory across North China and its possible mechanism from 1990 to 2011
[D]. Nanjing : Nanjing University of Information Science , 2018 .
[本文引用: 1]
白寒冰 1990-2011年影响我国华北地区的寒潮冷空气路径变化及其可能机理
[D]. 南京 : 南京信息工程大学 , 2018 .
[本文引用: 1]
[18]
Kang Zhiming Jin Ronghua Bao Yuanyuan Characteristic analysis of cold wave in China during the period of
1951 -2006 [J]. Plateau Meteorology , 2010 , 29 (2 ): 420 -428 .
[本文引用: 1]
康志明 , 金荣花 , 鲍媛媛 1951-2006年期间我国寒潮活动特征分析
[J]. 高原气象 , 2010 , 29 (2 ): 420 -428 .
[本文引用: 1]
[19]
Wei Fengying The characteristics of the variation of the cold wave in China under the background of climate warming
[J]. Progress in Natural Science , 2008 (3 ): 289 -295 .
魏凤英 气候变暖背景下我国寒潮灾害的变化特征
[J]. 自然科学进展 , 2008 (3 ): 289 -295 .
[20]
Huang Dan Research of tracks clustering and the variation of cold wave based on FMM algorithm
[D]. Nanjing : Nanjing University of Information Science , 2018 .
黄丹 基于FMM算法的寒潮路径分类及其变化规律研究
[D]. 南京 : 南京信息工程大学 , 2018 .
[21]
Zhou Xingyan Zhu Weijun Gu Cong Possible influence of the variation of the Northern Atlantic storm track on the activity of cold waves in China during winter
[J]. Chinese Journal of Atmospheric Sciences , 2015 , 39 (5 ): 978 -990 .
周星妍 , 朱伟军 , 顾聪 冬季北大西洋风暴轴异常对我国寒潮活动的可能影响
[J]. 大气科学 , 2015 , 39 (5 ): 978 -990 .
[22]
Zhu Chenyu Huang Fei Shi Yunhao et al Spatial-temporal pattern of the cold surge events in China in recent 50 years and its relationship with Arctic ice
[J]. Journal of Ocean University of China (Natural Science Edition) , 2014 , 44 (12 ): 12 -20 .
[本文引用: 1]
朱晨玉 , 黄菲 , 石运昊 , 等 中国近50年寒潮冷空气的时空特征及其与北极海冰的关系
[J]. 中国海洋大学学报(自然科学版) , 2014 , 44 (12 ): 12 -20 .
[本文引用: 1]
[23]
Mao Weiyi Chen Ying Climate characteristics of frequency and intensity of cold wave processes in Urumqi during
1951 -2015 [J]. Arid Meteorology , 2016 , 34 (3 ): 403 -411 .
[本文引用: 1]
毛炜峄 , 陈颖 1951-2015年乌鲁木齐市寒潮过程频数及强度气候特征
[J]. 干旱气象 , 2016 , 34 (3 ): 403 -411 .
[本文引用: 1]
[24]
Yao Yongming Yao Lei Deng Weitao Analysis of the frequency characteristics of the similar cold wave in the middle and lower reaches of the Yangtze River
[J]. Meteorological Monthly , 2011 , 37 (3 ): 339 -344 .
[本文引用: 1]
姚永明 , 姚雷 , 邓伟涛 长江中下游地区类寒潮发生频次的变化特征分析
[J]. 气象 , 2011 , 37 (3 ): 339 -344 .
[本文引用: 1]
[25]
Liu Xianfeng Zhu Xiufang Pan Yaozhong et al The spatial-temporal changes of cold surge in Inner Mongolia during recent 53 years
[J].Acta Geographica Sinica , 2014 , 69 (7 ): 1013 -1024 .
[本文引用: 1]
刘宪锋 , 朱秀芳 , 潘耀忠 , 等 近53年内蒙古寒潮时空变化特征及其影响因素
[J]. 地理学报 , 2014 , 69 (7 ): 1013 -1024 .
[本文引用: 1]
[26]
Grade of cold wave : Beijing : Standards Press of China , 2006 .
[本文引用: 1]
寒潮等级 : 北京 : 中国标准出版社 , 2017 .
[本文引用: 1]
[27]
Shi Neng Secular variation of winter atmospheric teleconnection pattern in the northern hemisphere and its relation with China climate change
[J]. Journal of Meteorology , 1996 , 54 (6 ): 675 -683 .
[本文引用: 2]
施能 北半球冬季大气环流遥相关的长期变化及其与我国气候变化的关系
[J]. 气象学报 , 1996 , 54 (6 ): 675 -683 .
[本文引用: 2]
[28]
Wei Fengying Modern climate statistical diagnosis and prediction technology [M]. Beijing : China Meteorological Press , 2007 : 214 -218 .
[本文引用: 1]
魏凤英 现代气候统计诊断与预测技术 [M]. 北京 : 气象出版社 , 2007 : 214 -218 .
[本文引用: 1]
[29]
Gu Junqiang Shi Neng Xue Genyuan Climate changes of precipitation and rainy days in Zhejiang Province in the past 40 years
[J]. Journal of Applied Meteorology , 2002 , 13 (3 ): 322 -329 .
[本文引用: 1]
顾骏强 , 施能 , 薛根元 近40年浙江省降水量、雨日的气候变化
[J]. 应用气象学报 , 2002 , 13 (3 ): 322 -329 .
[本文引用: 1]
[30]
Qiao Xuemei Liu Puxing The temporal and spatial characteristics and genesis of cold wave in northern China
[J]. Journal of Glaciology and Geocryology , 2020 , 42 (2 ): 357 -367 .
[本文引用: 1]
乔雪梅 , 刘普幸 中国北方地区寒潮时空特征及其成因分析
[J]. 冰川冻土 , 2020 , 42 (2 ): 357 -367 .
[本文引用: 1]
[31]
Ren Guoyu Feng Guolin Yan Zhongwei Progresses in observation studies of climate extremes and changes in mainland China
[J]. Climatic and Environmental Research , 2010 , 15 (4 ): 337 -353 .
[本文引用: 1]
任国玉 , 封国林 , 严中伟 中国极端气候变化观测研究回顾与展望
[J]. 气候与环境研究 , 2010 , 15 (4 ): 337 -353 .
[本文引用: 1]
[32]
Zhou Xiaoyu Zhao Chunyu Wang Ying et al Variation characteristics of extreme temperature events in Liaoning Province, 1961-2012
[J]. Journal of Glaciology and Geocryology , 2015 , 37 (4 ): 876 -887 .
[本文引用: 1]
周晓宇 , 赵春雨 , 王颖 , 等 1961-2012年辽宁省极端气温事件气候变化特征
[J]. 冰川冻土 , 2015 , 37 (4 ): 876 -887 .
[本文引用: 1]
[33]
Gao Feng Sui Bo Sun Hongyan et al Variation characteristics of winter air temperature and circulation field from 1951 to 2008 in the Northeast China
[J]. Journal of Meteorology and Environment , 2011 , 27 (4 ): 12 -16 .
[本文引用: 2]
高峰 , 隋波 , 孙鸿雁 , 等 1951-2008年东北地区冬季气温变化及环流场特征
[J]. 气象与环境学报 , 2011 , 27 (4 ): 12 -16 .
[本文引用: 2]
1
2014
... 气候系统变暖仍在持续,极端天气气候事件风险进一步加剧.20世纪50年代以来,观测到的许多变化在几十年乃至上千年都前所未有,主要表现在大气和海洋变暖、积雪减少、冰川萎缩、海平面上升、温室气体浓度增加[1 ] ,会导致极端气候事件发生得更加频繁.寒潮作为一种极端气候事件,是自极地或寒带的寒冷空气向中、低纬度的侵袭活动,在我国冬、春季频繁发生,造成气温急剧下降,并伴有大风和雨雪天气.不仅造成经济损失,也会给农业生产、交通运输和人体健康等带来严重的影响[2 -3 ] .长期以来,国内外众多学者针对寒潮天气过程,从冷空气源地和路径、寒潮机理、气候特征等方面进行了大量研究[4 -17 ] ,形成了比较系统和经典的寒潮理论.在气候变暖背景下,随着气象资料的积累和更新,研究发现中国寒潮频次和强度呈现新的变化特征[18 -22 ] ,而区域尺度寒潮变化特征各有不同.毛炜峄等[23 ] 分析了1951— 2015年乌鲁木齐市寒潮过程频数及强度气候特征,秋、冬、春季的寒潮过程频数大多在20世纪50年代最多.姚永明等[24 ] 研究发现长江中下游地区寒潮的发生随着全球变暖的气候趋势,总体频次减少,有明显的年代际特征.刘宪锋等[25 ] 揭示1960—2013年内蒙古单站寒潮频次总体呈下降趋势,而1991年之后呈增加趋势,寒潮主要受北极涛动(AO)、北大西洋涛动(NAO)、冷空气(CA)、亚洲极涡强度指数(APVII)和东亚大槽强度(CQ)控制. ...
Analysis of a cold wave weather process in Chengdu in March 2010
1
2011
... 气候系统变暖仍在持续,极端天气气候事件风险进一步加剧.20世纪50年代以来,观测到的许多变化在几十年乃至上千年都前所未有,主要表现在大气和海洋变暖、积雪减少、冰川萎缩、海平面上升、温室气体浓度增加[1 ] ,会导致极端气候事件发生得更加频繁.寒潮作为一种极端气候事件,是自极地或寒带的寒冷空气向中、低纬度的侵袭活动,在我国冬、春季频繁发生,造成气温急剧下降,并伴有大风和雨雪天气.不仅造成经济损失,也会给农业生产、交通运输和人体健康等带来严重的影响[2 -3 ] .长期以来,国内外众多学者针对寒潮天气过程,从冷空气源地和路径、寒潮机理、气候特征等方面进行了大量研究[4 -17 ] ,形成了比较系统和经典的寒潮理论.在气候变暖背景下,随着气象资料的积累和更新,研究发现中国寒潮频次和强度呈现新的变化特征[18 -22 ] ,而区域尺度寒潮变化特征各有不同.毛炜峄等[23 ] 分析了1951— 2015年乌鲁木齐市寒潮过程频数及强度气候特征,秋、冬、春季的寒潮过程频数大多在20世纪50年代最多.姚永明等[24 ] 研究发现长江中下游地区寒潮的发生随着全球变暖的气候趋势,总体频次减少,有明显的年代际特征.刘宪锋等[25 ] 揭示1960—2013年内蒙古单站寒潮频次总体呈下降趋势,而1991年之后呈增加趋势,寒潮主要受北极涛动(AO)、北大西洋涛动(NAO)、冷空气(CA)、亚洲极涡强度指数(APVII)和东亚大槽强度(CQ)控制. ...
近30多年中国东北地区春季寒潮的年代际变化及其可能原因
1
2017
... 气候系统变暖仍在持续,极端天气气候事件风险进一步加剧.20世纪50年代以来,观测到的许多变化在几十年乃至上千年都前所未有,主要表现在大气和海洋变暖、积雪减少、冰川萎缩、海平面上升、温室气体浓度增加[1 ] ,会导致极端气候事件发生得更加频繁.寒潮作为一种极端气候事件,是自极地或寒带的寒冷空气向中、低纬度的侵袭活动,在我国冬、春季频繁发生,造成气温急剧下降,并伴有大风和雨雪天气.不仅造成经济损失,也会给农业生产、交通运输和人体健康等带来严重的影响[2 -3 ] .长期以来,国内外众多学者针对寒潮天气过程,从冷空气源地和路径、寒潮机理、气候特征等方面进行了大量研究[4 -17 ] ,形成了比较系统和经典的寒潮理论.在气候变暖背景下,随着气象资料的积累和更新,研究发现中国寒潮频次和强度呈现新的变化特征[18 -22 ] ,而区域尺度寒潮变化特征各有不同.毛炜峄等[23 ] 分析了1951— 2015年乌鲁木齐市寒潮过程频数及强度气候特征,秋、冬、春季的寒潮过程频数大多在20世纪50年代最多.姚永明等[24 ] 研究发现长江中下游地区寒潮的发生随着全球变暖的气候趋势,总体频次减少,有明显的年代际特征.刘宪锋等[25 ] 揭示1960—2013年内蒙古单站寒潮频次总体呈下降趋势,而1991年之后呈增加趋势,寒潮主要受北极涛动(AO)、北大西洋涛动(NAO)、冷空气(CA)、亚洲极涡强度指数(APVII)和东亚大槽强度(CQ)控制. ...
近53年中国寒潮的变化特征及其可能原因
1
2006
... 气候系统变暖仍在持续,极端天气气候事件风险进一步加剧.20世纪50年代以来,观测到的许多变化在几十年乃至上千年都前所未有,主要表现在大气和海洋变暖、积雪减少、冰川萎缩、海平面上升、温室气体浓度增加[1 ] ,会导致极端气候事件发生得更加频繁.寒潮作为一种极端气候事件,是自极地或寒带的寒冷空气向中、低纬度的侵袭活动,在我国冬、春季频繁发生,造成气温急剧下降,并伴有大风和雨雪天气.不仅造成经济损失,也会给农业生产、交通运输和人体健康等带来严重的影响[2 -3 ] .长期以来,国内外众多学者针对寒潮天气过程,从冷空气源地和路径、寒潮机理、气候特征等方面进行了大量研究[4 -17 ] ,形成了比较系统和经典的寒潮理论.在气候变暖背景下,随着气象资料的积累和更新,研究发现中国寒潮频次和强度呈现新的变化特征[18 -22 ] ,而区域尺度寒潮变化特征各有不同.毛炜峄等[23 ] 分析了1951— 2015年乌鲁木齐市寒潮过程频数及强度气候特征,秋、冬、春季的寒潮过程频数大多在20世纪50年代最多.姚永明等[24 ] 研究发现长江中下游地区寒潮的发生随着全球变暖的气候趋势,总体频次减少,有明显的年代际特征.刘宪锋等[25 ] 揭示1960—2013年内蒙古单站寒潮频次总体呈下降趋势,而1991年之后呈增加趋势,寒潮主要受北极涛动(AO)、北大西洋涛动(NAO)、冷空气(CA)、亚洲极涡强度指数(APVII)和东亚大槽强度(CQ)控制. ...
我国近46年来的寒潮时空变化与冬季增暖
0
2007
我国近46年来的寒潮时空变化与冬季增暖
0
2007
Analysis of isentropic potential vorticity for a strong cold wave during 2004/2005 winter
0
2008
辽宁区域性冷空气多时间尺度变化特征及影响因子
0
2016
辽宁区域性冷空气多时间尺度变化特征及影响因子
0
2016
1961-2010年东北地区寒潮活动的时空特征分析
0
2013
1961-2010年东北地区寒潮活动的时空特征分析
0
2013
2015年初北极极端气旋对中国寒潮的影响
0
2020
2015年初北极极端气旋对中国寒潮的影响
0
2020
气候变暖背景下阿勒泰地区寒潮活动变化特征
0
2015
气候变暖背景下阿勒泰地区寒潮活动变化特征
0
2015
. 中国东北冬季相邻两天降温特征及其年代际变化
0
2019
. 中国东北冬季相邻两天降温特征及其年代际变化
0
2019
1961-2016年新疆单站不同等级冷空气过程气候特征及变化
0
2018
1961-2016年新疆单站不同等级冷空气过程气候特征及变化
0
2018
1960-2017年河西走廊东部寒潮时空变化特征
0
2019
1960-2017年河西走廊东部寒潮时空变化特征
0
2019
华北秋季寒潮路径的年代际变化特征及其可能机理
0
2019
华北秋季寒潮路径的年代际变化特征及其可能机理
0
2019
1954-2016年阿勒泰市春季寒潮过程频数及强度气候特征
0
2019
1954-2016年阿勒泰市春季寒潮过程频数及强度气候特征
0
2019
1990-2011年影响我国华北地区的寒潮冷空气路径变化及其可能机理
1
2018
... 气候系统变暖仍在持续,极端天气气候事件风险进一步加剧.20世纪50年代以来,观测到的许多变化在几十年乃至上千年都前所未有,主要表现在大气和海洋变暖、积雪减少、冰川萎缩、海平面上升、温室气体浓度增加[1 ] ,会导致极端气候事件发生得更加频繁.寒潮作为一种极端气候事件,是自极地或寒带的寒冷空气向中、低纬度的侵袭活动,在我国冬、春季频繁发生,造成气温急剧下降,并伴有大风和雨雪天气.不仅造成经济损失,也会给农业生产、交通运输和人体健康等带来严重的影响[2 -3 ] .长期以来,国内外众多学者针对寒潮天气过程,从冷空气源地和路径、寒潮机理、气候特征等方面进行了大量研究[4 -17 ] ,形成了比较系统和经典的寒潮理论.在气候变暖背景下,随着气象资料的积累和更新,研究发现中国寒潮频次和强度呈现新的变化特征[18 -22 ] ,而区域尺度寒潮变化特征各有不同.毛炜峄等[23 ] 分析了1951— 2015年乌鲁木齐市寒潮过程频数及强度气候特征,秋、冬、春季的寒潮过程频数大多在20世纪50年代最多.姚永明等[24 ] 研究发现长江中下游地区寒潮的发生随着全球变暖的气候趋势,总体频次减少,有明显的年代际特征.刘宪锋等[25 ] 揭示1960—2013年内蒙古单站寒潮频次总体呈下降趋势,而1991年之后呈增加趋势,寒潮主要受北极涛动(AO)、北大西洋涛动(NAO)、冷空气(CA)、亚洲极涡强度指数(APVII)和东亚大槽强度(CQ)控制. ...
1951-2006年期间我国寒潮活动特征分析
1
2010
... 气候系统变暖仍在持续,极端天气气候事件风险进一步加剧.20世纪50年代以来,观测到的许多变化在几十年乃至上千年都前所未有,主要表现在大气和海洋变暖、积雪减少、冰川萎缩、海平面上升、温室气体浓度增加[1 ] ,会导致极端气候事件发生得更加频繁.寒潮作为一种极端气候事件,是自极地或寒带的寒冷空气向中、低纬度的侵袭活动,在我国冬、春季频繁发生,造成气温急剧下降,并伴有大风和雨雪天气.不仅造成经济损失,也会给农业生产、交通运输和人体健康等带来严重的影响[2 -3 ] .长期以来,国内外众多学者针对寒潮天气过程,从冷空气源地和路径、寒潮机理、气候特征等方面进行了大量研究[4 -17 ] ,形成了比较系统和经典的寒潮理论.在气候变暖背景下,随着气象资料的积累和更新,研究发现中国寒潮频次和强度呈现新的变化特征[18 -22 ] ,而区域尺度寒潮变化特征各有不同.毛炜峄等[23 ] 分析了1951— 2015年乌鲁木齐市寒潮过程频数及强度气候特征,秋、冬、春季的寒潮过程频数大多在20世纪50年代最多.姚永明等[24 ] 研究发现长江中下游地区寒潮的发生随着全球变暖的气候趋势,总体频次减少,有明显的年代际特征.刘宪锋等[25 ] 揭示1960—2013年内蒙古单站寒潮频次总体呈下降趋势,而1991年之后呈增加趋势,寒潮主要受北极涛动(AO)、北大西洋涛动(NAO)、冷空气(CA)、亚洲极涡强度指数(APVII)和东亚大槽强度(CQ)控制. ...
气候变暖背景下我国寒潮灾害的变化特征
0
2008
气候变暖背景下我国寒潮灾害的变化特征
0
2008
基于FMM算法的寒潮路径分类及其变化规律研究
0
2018
基于FMM算法的寒潮路径分类及其变化规律研究
0
2018
冬季北大西洋风暴轴异常对我国寒潮活动的可能影响
0
2015
冬季北大西洋风暴轴异常对我国寒潮活动的可能影响
0
2015
中国近50年寒潮冷空气的时空特征及其与北极海冰的关系
1
2014
... 气候系统变暖仍在持续,极端天气气候事件风险进一步加剧.20世纪50年代以来,观测到的许多变化在几十年乃至上千年都前所未有,主要表现在大气和海洋变暖、积雪减少、冰川萎缩、海平面上升、温室气体浓度增加[1 ] ,会导致极端气候事件发生得更加频繁.寒潮作为一种极端气候事件,是自极地或寒带的寒冷空气向中、低纬度的侵袭活动,在我国冬、春季频繁发生,造成气温急剧下降,并伴有大风和雨雪天气.不仅造成经济损失,也会给农业生产、交通运输和人体健康等带来严重的影响[2 -3 ] .长期以来,国内外众多学者针对寒潮天气过程,从冷空气源地和路径、寒潮机理、气候特征等方面进行了大量研究[4 -17 ] ,形成了比较系统和经典的寒潮理论.在气候变暖背景下,随着气象资料的积累和更新,研究发现中国寒潮频次和强度呈现新的变化特征[18 -22 ] ,而区域尺度寒潮变化特征各有不同.毛炜峄等[23 ] 分析了1951— 2015年乌鲁木齐市寒潮过程频数及强度气候特征,秋、冬、春季的寒潮过程频数大多在20世纪50年代最多.姚永明等[24 ] 研究发现长江中下游地区寒潮的发生随着全球变暖的气候趋势,总体频次减少,有明显的年代际特征.刘宪锋等[25 ] 揭示1960—2013年内蒙古单站寒潮频次总体呈下降趋势,而1991年之后呈增加趋势,寒潮主要受北极涛动(AO)、北大西洋涛动(NAO)、冷空气(CA)、亚洲极涡强度指数(APVII)和东亚大槽强度(CQ)控制. ...
1951-2015年乌鲁木齐市寒潮过程频数及强度气候特征
1
2016
... 气候系统变暖仍在持续,极端天气气候事件风险进一步加剧.20世纪50年代以来,观测到的许多变化在几十年乃至上千年都前所未有,主要表现在大气和海洋变暖、积雪减少、冰川萎缩、海平面上升、温室气体浓度增加[1 ] ,会导致极端气候事件发生得更加频繁.寒潮作为一种极端气候事件,是自极地或寒带的寒冷空气向中、低纬度的侵袭活动,在我国冬、春季频繁发生,造成气温急剧下降,并伴有大风和雨雪天气.不仅造成经济损失,也会给农业生产、交通运输和人体健康等带来严重的影响[2 -3 ] .长期以来,国内外众多学者针对寒潮天气过程,从冷空气源地和路径、寒潮机理、气候特征等方面进行了大量研究[4 -17 ] ,形成了比较系统和经典的寒潮理论.在气候变暖背景下,随着气象资料的积累和更新,研究发现中国寒潮频次和强度呈现新的变化特征[18 -22 ] ,而区域尺度寒潮变化特征各有不同.毛炜峄等[23 ] 分析了1951— 2015年乌鲁木齐市寒潮过程频数及强度气候特征,秋、冬、春季的寒潮过程频数大多在20世纪50年代最多.姚永明等[24 ] 研究发现长江中下游地区寒潮的发生随着全球变暖的气候趋势,总体频次减少,有明显的年代际特征.刘宪锋等[25 ] 揭示1960—2013年内蒙古单站寒潮频次总体呈下降趋势,而1991年之后呈增加趋势,寒潮主要受北极涛动(AO)、北大西洋涛动(NAO)、冷空气(CA)、亚洲极涡强度指数(APVII)和东亚大槽强度(CQ)控制. ...
长江中下游地区类寒潮发生频次的变化特征分析
1
2011
... 气候系统变暖仍在持续,极端天气气候事件风险进一步加剧.20世纪50年代以来,观测到的许多变化在几十年乃至上千年都前所未有,主要表现在大气和海洋变暖、积雪减少、冰川萎缩、海平面上升、温室气体浓度增加[1 ] ,会导致极端气候事件发生得更加频繁.寒潮作为一种极端气候事件,是自极地或寒带的寒冷空气向中、低纬度的侵袭活动,在我国冬、春季频繁发生,造成气温急剧下降,并伴有大风和雨雪天气.不仅造成经济损失,也会给农业生产、交通运输和人体健康等带来严重的影响[2 -3 ] .长期以来,国内外众多学者针对寒潮天气过程,从冷空气源地和路径、寒潮机理、气候特征等方面进行了大量研究[4 -17 ] ,形成了比较系统和经典的寒潮理论.在气候变暖背景下,随着气象资料的积累和更新,研究发现中国寒潮频次和强度呈现新的变化特征[18 -22 ] ,而区域尺度寒潮变化特征各有不同.毛炜峄等[23 ] 分析了1951— 2015年乌鲁木齐市寒潮过程频数及强度气候特征,秋、冬、春季的寒潮过程频数大多在20世纪50年代最多.姚永明等[24 ] 研究发现长江中下游地区寒潮的发生随着全球变暖的气候趋势,总体频次减少,有明显的年代际特征.刘宪锋等[25 ] 揭示1960—2013年内蒙古单站寒潮频次总体呈下降趋势,而1991年之后呈增加趋势,寒潮主要受北极涛动(AO)、北大西洋涛动(NAO)、冷空气(CA)、亚洲极涡强度指数(APVII)和东亚大槽强度(CQ)控制. ...
近53年内蒙古寒潮时空变化特征及其影响因素
1
2014
... 气候系统变暖仍在持续,极端天气气候事件风险进一步加剧.20世纪50年代以来,观测到的许多变化在几十年乃至上千年都前所未有,主要表现在大气和海洋变暖、积雪减少、冰川萎缩、海平面上升、温室气体浓度增加[1 ] ,会导致极端气候事件发生得更加频繁.寒潮作为一种极端气候事件,是自极地或寒带的寒冷空气向中、低纬度的侵袭活动,在我国冬、春季频繁发生,造成气温急剧下降,并伴有大风和雨雪天气.不仅造成经济损失,也会给农业生产、交通运输和人体健康等带来严重的影响[2 -3 ] .长期以来,国内外众多学者针对寒潮天气过程,从冷空气源地和路径、寒潮机理、气候特征等方面进行了大量研究[4 -17 ] ,形成了比较系统和经典的寒潮理论.在气候变暖背景下,随着气象资料的积累和更新,研究发现中国寒潮频次和强度呈现新的变化特征[18 -22 ] ,而区域尺度寒潮变化特征各有不同.毛炜峄等[23 ] 分析了1951— 2015年乌鲁木齐市寒潮过程频数及强度气候特征,秋、冬、春季的寒潮过程频数大多在20世纪50年代最多.姚永明等[24 ] 研究发现长江中下游地区寒潮的发生随着全球变暖的气候趋势,总体频次减少,有明显的年代际特征.刘宪锋等[25 ] 揭示1960—2013年内蒙古单站寒潮频次总体呈下降趋势,而1991年之后呈增加趋势,寒潮主要受北极涛动(AO)、北大西洋涛动(NAO)、冷空气(CA)、亚洲极涡强度指数(APVII)和东亚大槽强度(CQ)控制. ...
1
2017
... 本文参照中华人民共和国国家标准《寒潮等级》[26 ] (GB/T 21987—2017),给出寒潮等级判定.寒潮:某地的日最低气温24小时内降温幅度≥8 ℃或48小时内降温幅度≥10 ℃,72小时内降温幅度≥12 ℃,而且该地日最低气温≤4 ℃的冷空气活动.强寒潮:某地的日最低气温24小时内降温幅度≥10 ℃或48小时内降温幅度≥12 ℃,72小时内降温幅度≥14 ℃,而且该地日最低气温≤2 ℃的冷空气活动.超强寒潮:某地的日最低气温24小时内降温幅度≥12 ℃或48小时内降温幅度≥14 ℃,72小时内降温幅度≥16 ℃,而且该地日最低气温≤0 ℃的冷空气活动.寒潮日定义为降温过程初终日之间(含初、终日)的天数,即各类寒潮造成的极端低温日数. ...
北半球冬季大气环流遥相关的长期变化及其与我国气候变化的关系
2
1996
... 采用线性倾向估计法分析寒潮的变化趋势,蒙特卡洛方法对空间变化趋势进行显著性检验[27 ] ,Mann-Kendell(M-K)检验寒潮的突变特征,Morlet小波[28 ] 分析方法进行周期分析. ...
... Mann-Kendall检验是一种非参数统计方法[27 ] ,假设时间序列数据(x 1 ,x 2 ,…,xn ),n 为样本数,M-K统计变量S 的计算公式为 ...
北半球冬季大气环流遥相关的长期变化及其与我国气候变化的关系
2
1996
... 采用线性倾向估计法分析寒潮的变化趋势,蒙特卡洛方法对空间变化趋势进行显著性检验[27 ] ,Mann-Kendell(M-K)检验寒潮的突变特征,Morlet小波[28 ] 分析方法进行周期分析. ...
... Mann-Kendall检验是一种非参数统计方法[27 ] ,假设时间序列数据(x 1 ,x 2 ,…,xn ),n 为样本数,M-K统计变量S 的计算公式为 ...
1
2007
... 采用线性倾向估计法分析寒潮的变化趋势,蒙特卡洛方法对空间变化趋势进行显著性检验[27 ] ,Mann-Kendell(M-K)检验寒潮的突变特征,Morlet小波[28 ] 分析方法进行周期分析. ...
1
2007
... 采用线性倾向估计法分析寒潮的变化趋势,蒙特卡洛方法对空间变化趋势进行显著性检验[27 ] ,Mann-Kendell(M-K)检验寒潮的突变特征,Morlet小波[28 ] 分析方法进行周期分析. ...
近40年浙江省降水量、雨日的气候变化
1
2002
... 采用相似系数定量表示两幅图的相似性,计算公式[29 ] 为 ...
近40年浙江省降水量、雨日的气候变化
1
2002
... 采用相似系数定量表示两幅图的相似性,计算公式[29 ] 为 ...
中国北方地区寒潮时空特征及其成因分析
1
2020
... 东北地区各站冬季平均气温与超强寒潮、强寒潮、寒潮出现日数相关程度较小,东北地区164站冬季平均气温与超级寒潮日数(图略)、强寒潮日数(图略)、寒潮日数关系的散点图(图1 )表明冬季平均气温偏低的偏冷地区与气温偏高的偏暖区,寒潮日数差异小.从东北地区1961—2016年寒潮出现总日数空间分布来看(图2 ),超强寒潮日数区域性较为明显,为4~530 d,其中黑龙江超强寒潮日数中部多,东西少,吉林东部多,西部少,辽宁东北部多,西南部少;高值中心位于吉林东南部靖宇(530 d),该结论与乔雪梅等[30 ] 研究基本一致,低值中心位于辽宁西部和南部、吉林西北部、黑龙江西部和东部部分地区,上述地区超强寒潮出现日数不足30 d,其中黑龙江齐齐哈尔地区甘南站超强寒潮日数为4 d;东北地区强寒潮、寒潮出现日数空间分布与超强寒潮日数相类似,强寒潮、寒潮日数以吉林东南部靖宇为高值中心,出现日数分别为900 d和1 392 d,黑龙江中部、辽宁东北部出现日数相对偏多,黑龙江、吉林西部出现日数相对较少,低值中心位于黑龙江西部甘南,出现日数分别为19 d和67 d.计算得到图2 (a)和图2 (b)、图2 (c)的相似系数为0.99和0.96,可见超级寒潮、强寒潮、寒潮相似性较高,表明超强寒潮偏多(少)的地区,强寒潮、寒潮同样偏多(少). ...
中国极端气候变化观测研究回顾与展望
1
2010
... 1961—2016年东北地区寒潮站次(超强寒潮、强寒潮、寒潮)均呈减少趋势(图4 ).超强寒潮、强寒潮、寒潮站次分别以32.9站次•(10a)-1 、43.3站次•(10a)-1 、51.7站次•(10a)-1 的速率减少,趋势系数分别为-0.386、-0.305、-0.235,超强寒潮和强寒潮减少速率通过了0.01、0.05显著性水平检验.从年代际变化来看,三者均在20世纪60年代到70年代末期相对偏多,1980年开始进入一个相对偏少的时段,2007年达到极端最少值,21世纪00年代中期以后有所增加,但是长期下降趋势没有改变[31 ] .其中,超强寒潮站次最少5年分别为2007年、2011年、1983年、1994年、2003年,均发生在20世纪80年代后,最多5年为1970年、2000年、1978年、1971年、1965年,大部分发生在20世纪80年代前. ...
1961-2012年辽宁省极端气温事件气候变化特征
1
2015
... 气温平均值的增加和气温变率的增加都会对极端气温事件产生影响[32 ] .气候变暖伴随着最高及最低气温的增温,最高气温和最低气温的平均值会发生改变,寒潮也会发生相应地改变,进而影响到寒潮出现的日数和站次.随着气候变暖,发现东北平均气温呈显著的增温趋势,分析1961—2016年东北冬季气温的空间变化趋势(图6 ),全区100%站点呈现增加趋势,66%的站点通过了0.05显著性水平检验,37%的站点通过了0.01显著性水平检验,15%的站点(黑龙江省2个站、吉林省8个站、辽宁省10个站)通过了0.001显著性水平检验,增温最显著区域主要位于吉林东南部、辽宁西部和辽宁东北部地区,其中吉林二道站和辽宁本溪站趋势系数0.55以上.黑龙江、吉林、辽宁分别有37%、35%、24%站点增温不显著,低值中心位于黑龙江西部(泰来站趋势系数0.09)和吉林西部地区(农安站趋势系数0.03). ...
1951-2008年东北地区冬季气温变化及环流场特征
2
2011
... 图7 给出1961—2016年东北地区冬季平均气温的Mann-Kendall突变检验.可见,UF曲线在1972年以后均大于0,且在1987年以后突破临界线,表明1972年以来东北地区冬季平均气温呈上升趋势,且1987年以后上升趋势显著.UF和UB曲线在1981年左右出现交点,且交点在临界线之间,说明1981年为东北地区冬季平均气温发生新突变的时间,该结论与前人基于1961—2007年东北气温资料计算结果不一致[33 ] .利用本文处理的冬季1961—2007年气温资料,得到突变点为1986/1987年,结论与已有研究相同[33 ] ,资料延长至2016年,突变点为1981年,东北地区冬季气温突变点发生漂移. ...
... [33 ],资料延长至2016年,突变点为1981年,东北地区冬季气温突变点发生漂移. ...


 甘公网安备 62010202000676号