川西螺髻山清水沟倒数第二次冰期以来的冰川规模与古气候重建
唐倩玉 , 1 , 张威 , 1 , 刘亮 1 , 柴乐 2 , 李亚鹏 1 , 张廉卿 3 , 孙波 1 , 张宏杰 1
1.辽宁师范大学 地理科学学院, 辽宁 大连 116029
2.东华理工大学 地球科学学院, 江西 南昌 330013
3.中国科学院 青藏高原研究所 青藏高原环境变化与地表过程重点实验室, 北京 100101
Glacier scale and paleoclimate reconstruction since Penultimate Glaciation in the Qingshui Valley, Luoji Mountain, western Sichuan
TANG Qianyu , 1 , ZHANG Wei , 1 , LIU Liang 1 , CHAI Le 2 , LI Yapeng 1 , ZHANG Lianqing 3 , SUN Bo 1 , ZHANG Hongjie 1
1.School of Geography,Liaoning Normal University,Dalian 116029,Liaoning,China
2.School of Earth Sciences,East China University of Technology,Nanchang 330013,China
3.Key Laboratory of Tibetan Environment Changes and Land Surface Processes,Institute of Tibetan Plateau Research,Chinese Academy of Sciences,Beijing 100101,China
通讯作者: 张威,教授,主要从事环境与灾害地貌研究. E-mail: zhangweilnu@163.com
编委: 武俊杰
收稿日期: 2020-10-25
修回日期: 2021-03-03
基金资助:
国家自然科学基金项目 . 42071013
Received: 2020-10-25
Revised: 2021-03-03
摘要
川西螺髻山清水沟保存着倒数第二次冰期(MIS 6)、末次冰期早期(MIS 4)和末次冰期晚期(MIS 2)较为完好的冰川沉积序列,该序列为螺髻山地区晚第四纪古环境重建提供了直接依据。基于野外地貌考察和冰川地貌特征确定出古冰川分布范围,计算古冰川物质平衡线高度(ELA),应用P-T模型和LR模型计算出各冰期时段的气温与降水。结果显示:清水沟MIS 6、MIS 4和MIS 2的冰川面积分别为3.44 km2 、2.22 km2 和1.20 km2 ,冰川体积分别为0.19 km3 、0.12 km3 和0.07 km3 。各期次的古ELA分别为3 132 m、3 776 m和3 927 m,相对于现代ELA分别下降了1 716 m、1 071 m和920 m。冰川规模受气温和降水的共同影响,MIS 6气温大幅下降(8~12 ℃)是导致该阶段冰川规模最大的原因;MIS 4降水为现在的80%左右,而气温下降幅度(6~7 ℃)小于倒数第二次冰期,冰川规模小于倒数第二次冰期;MIS 2降水仅为现在的60%~80%,降温幅度(4~8 ℃)也不大,因此该阶段冰川规模最小。
关键词:
螺髻山 物质平衡线高度 冰川体积 冰川纵剖面模型 古气候
Abstract
Luoji Mountain is located in the eastern margin of the Qinghai-Tibet Plateau and the central part of the Hengduan Mountains. The well-preserved Quaternary moraines in the Qingshui Valley exhibit great potential for reconstructing paleo-glacier extents and examining climate changes in the region. Three sets of moraines were successively preserved, from the cirques to the mouth of Qingshui Valley. These glacial moraines can be assigned to Penultimate Glaciation (MIS 6), early stage of Last Glaciation (MIS 4), and late stage of Last Glaciation (MIS 2). Guided by the Quaternary moraine features, this study used glacier reconstruction tools to reconstruct paleo-glacier surfaces and glacier equilibrium-line altitude (ELA) for three Quaternary glacial stages in the Qingshui Valley. Researchers previously considered modern terrain instead of ancient ice height when employing the accumulation area ratio (AAR) and area altitude balance ratio (AARB) methods to calculate the ELA, which resulted in an underestimation of the ELAs of ancient glaciers. In this study, the AAR and AARB methods were used to calculate the material balance line height during various periods after ancient glacier restoration to increase the ELA calculation accuracy. For 30 years, from 1990 to 2019, temperature and precipitation data from six weather stations of the National Meteorological Data Center demonstrated that the air temperature decline rate was 0.54 ℃·(100m)-1 . By combining this data with the precipitation-temperature and temperature lapse-rate models, we obtained the climate conditions of different ice ages. The primary findings are as follows: The surface heights of the glaciers were 2 125~3 826 m, 3 380~4 055 m, and 3 765~4 043 m, the glacier areas were 3.44 km2 , 2.22 km2 , and 1.20 km2 , and the glacier volumes were 0.19 km3 , 0.12 km3 , and 0.07 km3 during Penultimate Glaciation, early stage of Last Glaciation, and late stage of Last Glaciation, respectively. The ELAs of Penultimate Glaciation, early stage of Last Glaciation, and late stage of Last Glaciation were 3 132 m, 3 776 m, and 3 927 m, which were reduced by 1 716 m, 1 071 m, and 920 m, respectively, compared with the modern ELAs. Scale of the glacier was affected by both temperature and precipitation. The large drop (8~12 ℃) in temperature in MIS 6 was the cause of the largest glacier. The precipitation in MIS 4 was about 80% of the current value, but the temperature drop (6~7 ℃) was smaller than Penultimate Glacial Period, so the glacier scale was smaller than that of Penultimate Glacial Period. The precipitation in MIS 2 was only 60%~80% of the present, and the temperature drop (4~8 ℃) was not large, so the glacier scale was the smallest.
Keywords:
Luoji Mountain equilibrium-line altitude (ELA) glacier volume longitudinal profile model of glacier paleoclimate
本文引用格式
唐倩玉, 张威, 刘亮, 柴乐, 李亚鹏, 张廉卿, 孙波, 张宏杰. 川西螺髻山清水沟倒数第二次冰期以来的冰川规模与古气候重建 [J]. 冰川冻土 , 2021, 43(6): 1869-1877 doi:10.7522/j.issn.1000-0240.2021.0062
TANG Qianyu, ZHANG Wei, LIU Liang, CHAI Le, LI Yapeng, ZHANG Lianqing, SUN Bo, ZHANG Hongjie. Glacier scale and paleoclimate reconstruction since Penultimate Glaciation in the Qingshui Valley, Luoji Mountain, western Sichuan [J]. Journal of Glaciology and Geocryology
0 引言
第四纪全球气候的显著特征之一是冰期和间冰期交替,丰富的第四纪冰川作用遗迹为探讨第四纪期间的气候环境变化特征与形成机制提供了良好的载体[1 -2 ] ,第四纪也是人类出现和迅速发展的时代,研究这一时期的气候变化对探讨自然环境变化对人类的影响有重要意义。随着地貌与第四纪研究的不断深入,采用相应的数学模型,并辅助地理信息系统(geographic information system,简称GIS),第四纪冰川研究已经进入了定量化研究阶段[3 -10 ] 。尤其是根据古今冰川平衡线高度变化,定量化推算不同冰期时段的气温与降水,明确过去和现在气候变化的差异,可为未来气候变化趋势预测提供参考[11 -13 ] 。
螺髻山位于青藏高原东缘、横断山的中部,气候受东南季风和西南季风的共同影响,加上高大山体对气流的抬升作用使得这里降水充沛,11月至3月该地区受高空西风环流南支急流控制,以晴朗天气为主,降水少,4月东南季风和西南季风北上,雨季开始,9—10月印度洋暖湿气流更强烈的侵入成为年降水的第二个高峰,夏半年的降水量占全年的75%~90%[14 ] 。该区域是青藏高原东缘有明确古冰川地形而无现代冰川发育的地区之一[2 ] ,在第四纪期间经历了多次冰川作用,海拔2 500 m以上保留有序列齐全、对气候变化敏感的海洋性冰川遗迹。近年来,一些学者对螺髻山第四纪冰川地貌进行了深入考察与研究,进行了第四纪冰期系列划分并建立了绝对年代学框架[15 -17 ] (图1 )。依据不同期次的冰川遗迹,运用冰川纵剖面模型、积累区面积比率法(accumulation area ratio,简称AAR)和面积-高程平衡率法(area altitude balance ratio,简称AABR),以及气温与降水关系模型(简称P-T模型)、气温递减率模型(lapse-rate model,简称LR)等,可以获得不同阶段古冰川规模及冰川物质平衡线高度(equilibrium-line altitude,简称ELA),进而得到不同冰川作用期的气候环境演变特征。
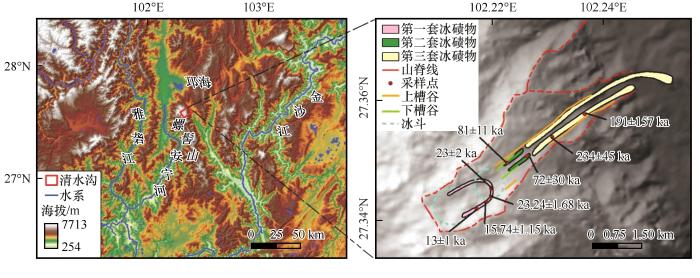
图1
图1
螺髻山清水沟地理位置与冰川地貌
Fig.1
Geographical location and glacial landforms of the Qingshui Valley, Luoji Mountain
1 研究区概况
清水沟谷地的第四纪冰川沉积物保存较好,从源区冰斗到沟谷谷口依次保存有三套冰碛物(图1 ),张威等[15 ] 对这三套冰碛物的测年结果显示:第一套冰碛物上采集两个电子自旋共振样品(electron spin resonance,简称ESR)测年结果为(13±1) ka和(23±2) ka,以及两个OSL(光释光)测年结果为(15.74±1.15) ka和(23.24±1.68) ka,因此根据相对地貌和测年结果可确定第一套冰碛物形成于末次冰期晚期,对应于海洋氧同位素阶段(marine oxygen isotope stage,简称MIS)2。第二套冰碛物分布于海拔3 400~3 550 m大海子冰坎下部,终碛与侧碛相连,部分终碛被后期流水冲开,第二套冰碛上的两个ESR测年结果为(72±30) ka和(81±11) ka,结合地貌可判断其形成于末次冰期早期(MIS 4)。第三套冰碛物的侧碛垄从海拔3 400 m延伸至海拔2 300 m,终碛堤位于清水沟西北2 200 m的山包上,横剖面呈月牙状堆积体,相对高度50 m[18 ] 。在冰碛垄的两个样品ESR年龄为(234±45) ka和(191±157) ka,结合地貌判断其形成于倒数第二次冰期(MIS 6)。倒数第二次冰期冰川从大海子冰斗(下层冰斗)向下游溢出形成了上槽谷,从海拔 3 740 m延伸到2 500 m左右,末次冰期早期形成了清水沟3 800 m左右的冰斗群以及下槽谷[19 ] 。
2 研究方法
2.1 冰川规模定量恢复方法
使用Pellitero等[20 ] 开发的冰川规模重建工具箱Glacier Reconstruction Tools(简称GLARE),恢复冰川表面高程时需要古冰川底部的地形数据和古冰川分布范围。倒数第二次冰期的冰川范围以下层冰斗后壁、上槽谷、侧碛垄以及谷口终碛为参考,末次冰期早期的冰川范围以上层冰斗后壁、下槽谷、侧碛垄为参考,末次冰期晚期的冰川范围以上冰斗附近的侧碛和终碛为参考。先沿着冰川中流线计算冰川厚度,之后插值至整个冰川分布范围,最终得到整条冰川的厚度。冰川纵剖面模型是根据冰川动力学方程建立的[21 ] 。
τ ρgh α (1)
式中:τ 为剪切应力;ρ 为冰川冰的密度;g 为重力加速度;h 为冰川的厚度;α 为冰川表面的坡度。
具体步骤为:①使用Flowline Creation工具,生成古冰川中流线;②使用Shear Stress工具中的Construct Interval Nodes得到中流线上的节点;③使用Shear Stress工具中的Define Shear Stress对节点的剪切应力进行赋值;④使用Glacier Reconstruction中的Flowline ice thickness tool得到流线上的冰川海拔高度;⑤考虑槽谷形态对冰川的影响,使用F因子中的Automatic ice thickness工具对流线上的冰川海拔高度进行校正;⑥使用Glacier Reconstruction中的Glacier surface interpolation输入中流线和冰川作用范围,选择克里金插值方法,得到冰面高程;⑦冰面高程与冰川底部地形相减可以得到冰川厚度;⑧通过得到的冰面高程可以在ArcGIS上计算冰川表面高程栅格数据的面积;⑨在ArcGIS上计算冰川厚度乘以冰川表面插值网格面积得出冰川体积。
2.2 冰川平衡线估算方法
ELA是指冰川上积累量与消融量相等的点连线的高度[22 -24 ] 。本文采用目前较为常用的AAR和AABR法来恢复清水沟古冰川物质平衡线高度。当冰川处于稳定状态时,冰川积累区面积与整个冰川面积的比值即为AAR值[25 ] ,古冰川ELA的计算参考Kern等[26 ] 提出的AAR值与冰川面积间的对数关系式。
AAR=0.0648×lnS (2)
AABR法是由Furbish等[27 ] 提出的根据冰川消融区和积累区的物质平衡梯度来计算冰川物质平衡线高度的方法,Rea[28 ] 在计算全球65条冰川的物质平衡时发现BR的平均值为1.75±0.71,因此本文参考此平均值计算清水沟的BR值。本文基于恢复后的古冰面高程计算不同时期的古ELA,可以使计算结果更为精确。
2.3 基于冰川平衡线变化的气候重建模型
(1)P-T模型
气温和降水是影响冰川ELA变化的重要因素[29 -30 ] ,因而现代冰川ELA处气温和降水的关系也被广泛地应用于气候重建[31 -32 ] 。古冰川运用P-T模型时要结合ELA的变化量及气温递减率,从而得到因为ELA位置的变化而产生的气温变化量。在假定古冰川前进时ELA和现代冰川ELA处气温和降水关系一致的基础上,结合气候代用指标得到降水的变化量,带入到P-T模型中得到气温变化量。然后将位置变化产生的气温变化量和降水波动产生的气温变化量相加,就是气温波动值[33 ] 。本文在恢复不同阶段古气候时参考了施雅风等[29 ] 的研究,建立了中国西部冰川年降水量P (mm)和年均温T (℃)之间的关系式。
T P (3)
(2)LR模型
在使用LR模型时要考虑温度递减率、积累梯度和积累量的变化[34 ] 。该模型应用ELA处冰川积累量与温度的转换系数f ,将由于ELA升降导致的降水变化量转化为相应的气温变化量[33 ] 。
T 2 -T 1 =∂T z 1 -ELA2 )-f c z 1 -ELA2 )-f c 1 -c 2 )(4)
式中:ELA1 和ELA2 分别为现代和冰期时的物质平衡线高度;T 1 为现代冰川ELA2 处的气温(℃);T 2 为冰期时古冰川ELA2 处的气温(℃);c 1 为现代冰川在ELA2 处的积累量(mm);c 2 为冰期时古冰川在ELA2 处的积累量(mm);f 为物质平衡线处冰川积累量与温度的转换系数(℃·mm-1 )。
3 结果与讨论
3.1 冰川规模估算
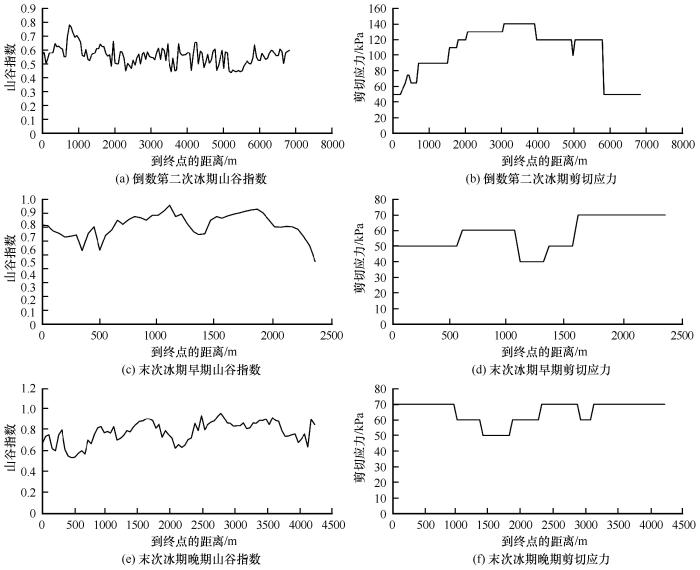
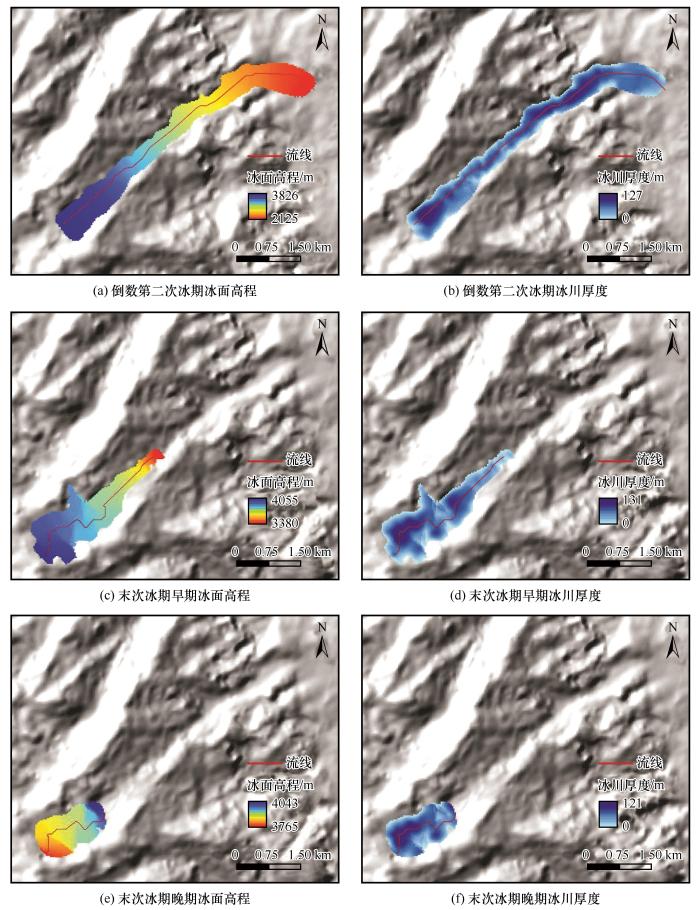
利用GLARE工具恢复螺髻山清水沟倒数第二次冰期的冰川山谷指数为0.45~0.87[图2 (a)],平均值为0.62;剪切应力范围为40~140 kPa[图2 (b)],平均值为102.10 kPa;冰川表面高程为2 125~3 826 m[图3 (a)],平均值为3 029 m,最大冰川厚度为127 m[图3 (b)],平均值为55 m,冰川表面积为3.44 km2 ,体积为0.19 km3 。恢复末次冰期早期的冰川山谷指数为0.53~0.96[图2 (c)],平均值为0.77;剪切应力范围为50~70 kPa[图2 (d)],平均值为64.65 kPa;冰川表面高程为3 380~4 055 m[图3 (c)],平均值为3 054 m,最大冰川厚度为131 m[图3 (d)],平均值为53 m,冰川表面积为2.22 km2 ,体积为0.12 km3 。末次冰期晚期的冰川山谷指数为0.49~0.95[图2 (e)],平均值为0.79;剪切应力范围为40~70 kPa[图2 (f)],平均值为57.71 kPa;冰川表面高程为3 765~4 043 m[图3 (e)],平均值为3 016 m,最大冰川厚度为121 m[图3 (f)],平均值为57 m,冰川表面积为1.20 km2 ,体积为0.07 km3 。
图2
图2
清水沟不同冰进时期的山谷指数和剪切应力
Fig.2
Shape index (a,c,e) and shear stress (b,d,f) of Penultimate Glaciation, early stage of Last Glaciation, and late stage of Last Glaciation in the Qingshui Valley
图3
图3
清水沟不同冰进时期的冰面高程和冰川厚度分布
Fig.3
Distribution of ice surface elevations (a, c, e) and glacier thickness (b, d, f) of Penultimate Glaciation, early stage of Last Glaciation, and late stage of Last Glaciation in the Qingshui Valley
测量的山谷指数在末次冰期晚期最大,末次冰期早期居中,倒数第二次冰期最小,这主要是因为靠近冰川源头受到的冰川侵蚀更强烈、持续时间也更长,使槽谷底部更趋近于“U”形[35 ] 。对于山谷冰川来说,剪切应力在50~150 kPa的范围内[36 ] ,恢复的各阶段冰川底部剪切应力平均值均在此范围内。研究区倒数第二次冰期以来冰川的面积和体积都不断减小,这种第四纪以来冰期规模逐渐减小的特点在中国山地冰川区具有普遍性[37 ] 。
3.2 不同时期冰川平衡线高度
将恢复出的冰川面积带入式(2),计算出倒数第二次冰期AAR值为0.56,末次冰期早期AAR值为0.53,末次冰期晚期AAR值为0.49,然后使用Pellitero等[20 ] 开发的ELA calculation工具输入AAR值和BR值可自动计算对应的ELA高度。从表1 看出,运用AABR法、AAR法,结合前人使用的冰斗底部高程法(CF)、末端至冰斗后壁比率法(MELM)、侧碛垄最大高度法(THAR)和TSAM法[18 ] 计算出清水沟倒数第二次冰期ELA平均值为3 132 m,末次冰期早期ELA平均值为3 776 m,末次冰期晚期ELA平均值为3 927 m。根据高晓昕[18 ] 计算的结果,螺髻山现代冰川平衡线高度为4 848 m,倒数第二次冰期相对于现代ELA下降1 716 m,末次冰期早期下降1 071 m,末次冰期晚期下降920 m。
3.3 古气候环境重建
收集了研究区附近的西昌、昭觉、木里、盐源、九龙和稻城这六个气象站1990—2019年每日的气温和降水数据(表2 ),所用的气象数据来自国家气象科学数据中心(http://data.cma.cn/ )的中国地面气候资料日值数据集(V3.0)。
对研究区附近气象站的多年平均气温T (℃)和海拔H (m),以及多年平均降水量P (mm)和海拔H (m)进行拟合。
T H R 2 =0.88(5)
P -6 H 2 -0.1884H R 2 =0.68(6)
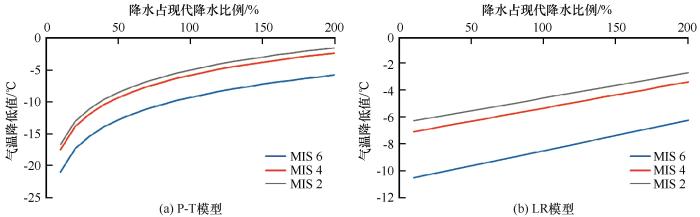
使用P-T模型对气温变化进行恢复的方法如下[33 ] :通过式(5)得到气温递减率为0.54 ℃·( 100m)-1 ,结合倒数第二次冰期ELA下降高度,先得出因为位置变化导致的气温变化为9.27 ℃;然后根据式(6)计算出现代ELA处的降水为512.38 mm,根据式(3)计算出现代ELA处的气温为-11.10 ℃,位于青藏高原东北部若尔盖盆地RM钻孔的孢粉分析结果[38 ] 显示,MIS 6年降水量为现在的60%~80%,因此在MIS 6时现代ELA处的降水为307.43~409.90 mm,使用式(3)得到ELA处的年均温为-13.70~-12.23 ℃,所以降水波动产生的气温变化量为1.13~2.59 ℃;位置和降水波动产生的气温变化量相加就是气温的波动值,因此得出在倒数第二次冰期时气温比现在低10~12 ℃。末次冰期早期和晚期的降水量分别为现在的80%左右和60%~80%[38 ] ,按照上述方法得到的计算结果如表3 所示。图4 (a)模拟了P-T模型不同冰进阶段年降水量占现代年降水量的比例由10%变化到200%,变化的步长为10%时的气候状况。
图4
图4
模型模拟结果
Fig.4
Simulation results of P-T (a) and LR (b) models
使用LR模型对气温变化进行恢复的方法见文献[39 ]。LR模型与P-T模型相比,还需要冰川积累梯度和不同阶段ELA的乘积,以及ELA处冰川积累量与温度的转换系数(f )。由式(6)可以得到冰川积累梯度和不同阶段ELA的乘积。根据Ohmura等[30 ] 提出的f 值,本文采用0.0029 ℃·mm-1 。降水比例与P-T模型设置为一致,将上述数据带入LR模型计算,结果如图4 (b)和表3 所示。
根据P-T模型和LR模型的结果(表3 ),可以看出:倒数第二次冰期气温降低值为8~12 ℃,这与根据冰楔假型恢复出的鄂尔多斯倒数第二次冰期时冻土边界附近的年均温比现在低10~15 ℃相符[40 ] ,该阶段降水仅为现在的60%~80%,所以气温大幅度的下降是导致该阶段冰川规模最大的原因;末次冰期早期气温降低值为6~7 ℃,与若尔盖盆地孢粉记录显示MIS 4阶段年平均气温比现在低4 ℃相差不大[38 ] ,该阶段降水为现在的80%左右,但是气温下降幅度小于倒数第二次冰期,因而冰川规模小于倒数第二次冰期;末次冰期晚期气温降低值为4~8 ℃,与若尔盖盆地孢粉记录显示MIS 2阶段的年平均气温比现在低5~6 ℃的情况一致[38 ] ,末次冰期晚期降水仅为现在的60%~80%,降温幅度也不大,因此该阶段冰川规模最小。
4 结论
螺髻山清水沟第四纪冰川规模与古环境重建的主要结论如下:
(1) 基于冰碛物的分布范围,利用冰川纵剖面模型恢复了古冰川的规模,清水沟倒数第二次冰期的冰川面积为3.44 km2 ,最大冰川厚度为127 m,冰川体积为0.19 km3 ;末次冰期早期的冰川面积为2.22 km2 ,最大冰川厚度为131 m,冰川体积为0.12 km3 ;末次冰期晚期的冰川面积为1.20 km2 ,最大冰川厚度为121 m,冰川体积为0.07 km3 。
(2) 运用AABR法和AAR法,并结合冰斗底部高程法(CF)、末端至冰斗后壁比率法(MELM)、侧碛垄最大高度法(THAR)和TSAM法恢复了古冰川平衡线高度,结果显示清水沟倒数第二次冰期ELA高度为3 132 m,末次冰期早期ELA高度为 3 776 m,末次冰期晚期ELA高度为3 927 m。
(3) 运用P-T模型和LR模型,结合气候代用指标,可以得到研究区倒数第二次冰期气温降低值为8~12 ℃,末次冰期早期气温降低值为6~7 ℃,末次冰期晚期气温降低值为4~8 ℃。
参考文献
View Option
[1]
Yu Beibei Timing and climate drivers of Quaternary glaciations in the Gongga Shan, eastern Tibetan Plateau
[D]. Lanzhou : Lanzhou University , 2018 .
[本文引用: 1]
于贝贝 贡嘎山地区古冰川演化序列及其气候驱动机制研究
[D]. 兰州 : 兰州大学 , 2018 .
[本文引用: 1]
[2]
Shi Yafeng Cui Zhijiu Su Zhen et al The Quaternary glaciations and environmental variations in China [M]. Shijiazhuang : Hebei Science and Technology Publishing House , 2006 : 127 .
[本文引用: 2]
施雅风 , 崔之久 , 苏珍 , 等 中国第四纪冰川与环境变化 [M]. 石家庄 : 河北科学技术出版社 , 2006 : 127 .
[本文引用: 2]
[3]
Xu Xiangke Climates during late Quaternary glacier advances: glacier-climate modeling in the Yingpu Valley, eastern Tibetan Plateau
[J]. Quaternary Science Reviews , 2014 , 101 : 18 -27 .
[本文引用: 1]
[4]
Ma Linglong Tian Lide Pu Jianchen et al Recent area and ice volume change of Kangwure Glacier in the middle of Himalayas
[J]. Chinese Science Bulletin , 2010 , 55 (20 ): 2088 -2096 .
[5]
Li Yanan Li Zhen Wang Ninglian Ice thickness sounded by ground penetrating radar on the Meikuang Glacier in the eastern Kunlun Mountains
[J]. Journal of Glaciology and Geocryology , 2018 , 40 (1 ): 38 -46 .
李亚楠 , 李真 , 王宁练 东昆仑山煤矿冰川雷达测厚及冰储量估算
[J]. 冰川冻土 , 2018 , 40 (1 ): 38 -46 .
[6]
Huang Tianjin Spatial-temporal changes of glacier thickness and lake level on the Qinghai-Tibetan Plateau
[D]. Beijing : University of Chinese Academy of Sciences , 2017 .
黄田进 青藏高原冰川厚度与湖泊水位的时空变化研究
[D]. 北京 : 中国科学院大学 , 2017 .
[7]
Gao Yongpeng Yao Xiaojun An Lina et al Change of ice volume in the Qilian Mountains during the period from 2000 to 2010
[J]. Arid Zone Research , 2018 , 35 (2 ): 325 -333 .
高永鹏 , 姚晓军 , 安丽娜 , 等 2000-2010年祁连山冰川冰储量变化
[J]. 干旱区研究 , 2018 , 35 (2 ): 325 -333 .
[8]
Wang Puyu Li Zhongqin Li Huilin
Ice volume changes and their characteristics for representative glacier against the background of climatic warming: a case study of Urumqi Glacier No .1 , Tianshan, China[J]. Journal of Natural Resources, 2011, 26 (7 ): 1189 -1198 .
王璞玉 , 李忠勤 , 李慧林 气候变暖背景下典型冰川储量变化及其特征: 以天山乌鲁木齐河源1号冰川为例
[J]. 自然资源学报 , 2011 , 26 (7 ): 1189 -1198 .
[9]
Wang Ninglian Yao Tandong Xu Baiqing et al Spatiotemporal pattern, trend, and influence of glacier change in Tibetan Plateau and surroundings under global warming
[J]. Bulletin of Chinese Academy of Sciences , 2019 , 34 (11 ): 1220 -1232 .
王宁练 , 姚檀栋 , 徐柏青 , 等 全球变暖背景下青藏高原及周边地区冰川变化的时空格局与趋势及影响
[J]. 中国科学院院刊 , 2019 , 34 (11 ): 1220 -1232 .
[10]
Sun Meiping Liu Shiyin Yao Xiaojun et al Glacier changes in the Qilian Mountains in the past half century: based on the revised first and second Chinese glacier inventory
[J]. Acta Geographica Sinica , 2015 , 70 (9 ): 1402 -1414 .
[本文引用: 1]
孙美平 , 刘时银 , 姚晓军 , 等 近50年来祁连山冰川变化: 基于中国第一、二次冰川编目数据
[J]. 地理学报 , 2015 , 70 (9 ): 1402 -1414 .
[本文引用: 1]
[11]
Kaur R Saikumar D Kulkarni A V et al Variations in snow cover and snowline altitude in Baspa Basin
[J]. Current Science , 2009 , 96 (9 ): 1255 -1258 .
[本文引用: 1]
[12]
Yang Yi Yang Taibao Climate variation and glacier response in the Bogda region, Tianshan Mountains
[J]. Progress in Geography , 2014 , 33 (10 ): 1387 -1396 .
何毅 , 杨太保 博格达峰地区气候变化特征及其对冰川变化的影响
[J]. 地理科学进展 , 2014 , 33 (10 ): 1387 -1396 .
[13]
Wu Hao Yu Xiaogan Xu Gang Response of glaciers in the source region of Yangtze River to global climate change
[J]. Geography and Territorial Research , 2001 (4 ): 1 -5 .
[本文引用: 1]
吴豪 , 虞孝感 , 许刚 长江源区冰川对全球气候变化的响应
[J]. 地理学与国土研究 , 2001 (4 ): 1 -5 .
[本文引用: 1]
[14]
Chinese Academy of Sciences. The Comprehensive Scientific Expedition to the Qinghai-Xizang Plateau Glaciers in the Hengduan Mountains [M]. Beijing : Science Press , 1996 : 161 .
[本文引用: 1]
中国科学院青藏高原综合科学考察队 横断山冰川 [M]. 北京 : 科学出版社 , 1996 : 161 .
[本文引用: 1]
[15]
Zhang Wei Liu Liang Chai Le et al Characteristics of Quaternary glaciations using ESR dating method in the Luoji Mountain, Sichuan Province
[J]. Quaternary Sciences , 2017 , 37 (2 ): 281 -292 .
[本文引用: 2]
张威 , 刘亮 , 柴乐 , 等 基于年代学证据的螺髻山第四纪冰川作用研究
[J]. 第四纪研究 , 2017 , 37 (2 ): 281 -292 .
[本文引用: 2]
[16]
He Daiwen Luoji Mountain Quaternary glacial landforms process
[D]. Dalian, Liaoning : Liaoning Normal University , 2015 .
何代文 螺髻山第四纪冰川地貌过程
[D]. 辽宁大连 : 辽宁师范大学 , 2015 .
[17]
Yu Yang The ancient glaciers research of climate and tectonic movement coupling relations of Luoji Mountain
[D]. Dalian, Liaoning : Liaoning Normal University , 2012 .
[本文引用: 1]
于洋 螺髻山古冰川发育与构造-气候演化的耦合关系
[D]. 辽宁大连 : 辽宁师范大学 , 2012 .
[本文引用: 1]
[18]
Gao Xiaoxin Study on the determination and influencing factor of ELA in western Sichuan of late Quaternary period
[D]. Dalian, Liaoning : Liaoning Normal University , 2017 .
[本文引用: 3]
高晓昕 川西晚第四纪冰川平衡线高度的确定及其影响因素探讨
[D]. 辽宁大连 : 辽宁师范大学 , 2017 .
[本文引用: 3]
[19]
Zhang Wei He Daiwen Liu Libo et al Evolution of glacial trough and influence factors of the Qingshui Valley in Luoji Mountain, Sichuan Province
[J]. Progress in Geography , 2014 , 33 (10 ): 1397 -1404 .
[本文引用: 1]
张威 , 何代文 , 刘丽波 , 等 四川螺髻山清水沟冰川槽谷演化及其影响因素
[J]. 地理科学进展 , 2014 , 33 (10 ): 1397 -1404 .
[本文引用: 1]
[20]
Pellitero R Rea B R Spagnolo M et al GlaRe, a GIS tool to reconstruct the 3D surface of palaeoglaciers
[J]. Computers & Geosciences , 2016 , 94 : 77 -85 .
[本文引用: 2]
[21]
Nye J F The mechanics of glacier flow
[J]. Journal of Glaciology , 1952 , 2 (12 ): 82 -93 .
[本文引用: 1]
[22]
Liu Jinhua Yi Chaolu Li Yingkui Reconstruction of the Neoglacial glacier in the Qiangyong Valley , Mt Kaluxung, South Tibet
[J]. Quaternary Sciences , 2018 , 38 (2 ): 348 -354 .
[本文引用: 1]
刘金花 , 易朝路 , 李英奎 藏南卡鲁雄峰枪勇冰川新冰期冰川发育探讨
[J]. 第四纪研究 , 2018 , 38 (2 ): 348 -354 .
[本文引用: 1]
[23]
Ju Yuanjiang Liu Gengnian Wei Xia Equilibrium line altitude of mountain glacier as a proxy of climate changes
[J]. Journal of Glaciology and Geocryology , 2007 , 29 (4 ): 613 -616 .
鞠远江 , 刘耕年 , 魏遐 山地冰川平衡线高度作为气候变化代用指标的讨论
[J]. 冰川冻土 , 2007 , 29 (4 ): 613 -616 .
[24]
Duan Keqin Yao Tandong Shi Peihong et al Simulation and prediction of equilibrium line altitude of glaciers in the eastern Tibetan Plateau
[J]. Scientia Sinica Terrae , 2017 , 47 (1 ): 104 -113 .
[本文引用: 1]
段克勤 , 姚檀栋 , 石培宏 , 等 青藏高原东部冰川平衡线高度的模拟及预测
[J]. 中国科学: 地球科学 , 2017 , 47 (1 ): 104 -113 .
[本文引用: 1]
[25]
Meier M F Post A S Recent variations in mass net budgets of glaciers in western North America
[C]// Variations of the regime of existing glaciers: IAHS publication No .58 . Wallingford, UK : International Association of Hydrological Sciences , 1962: 63 -77 .
[本文引用: 1]
[26]
Kern Z László P Size specific steady-state accumulation-area ratio: an improvement for equilibrium-line estimation of small palaeoglaciers
[J]. Quaternary Science Reviews , 2010 , 29 (19/20 ): 2781 -2787 .
[本文引用: 1]
[27]
Furbish D J Andrews J T The use of hypsometry to indicate long-term stability and response of valley glaciers to changes in mass transfer
[J]. Journal of Glaciology , 1984 , 30 (105 ): 199 -211 .
[本文引用: 1]
[28]
Rea B R Defining modern day area-altitude balance ratios (AABRs) and their use in glacier-climate reconstructions
[J]. Quaternary Science Reviews , 2009 , 28 (3/4 ): 237 -248 .
[本文引用: 1]
[29]
Shi Yafeng Huang Maohuan Ren Binghui An introduction to the glaciers in China [M]. Beijing : Science Press , 1988 .
[本文引用: 2]
施雅风 , 黄茂桓 , 任炳辉 中国冰川概论 [M]. 北京 : 科学出版社 , 1988 .
[本文引用: 2]
[30]
Ohmura A Kasser P Funk M Climate at the equilibrium line of glaciers
[J]. Journal of Glaciology , 1992 , 38 (130 ): 397 -411 .
[本文引用: 2]
[31]
Wang Jie Cui Hang Harbor J M et al Mid-MIS 3 climate inferred from reconstructing the Dalijia Shan ice cap, north-eastern Tibetan Plateau
[J]. Journal of Quaternary Science , 2015 , 30 (6 ): 558 -568 .
[本文引用: 1]
[32]
Zhou Shangzhe Wang Jie Xu Liubing et al Glacial advances in southeastern Tibet during late Quaternary and their implications for climatic changes
[J]. Quaternary International , 2010 , 218 (1/2 ): 58 -66 .
[本文引用: 1]
[33]
Cui Hang Cao Guangchao Chen Kelong et al A review on the reconstruction of palaeoclimate by glacial landform in the Tibetan Plateau and adjacent mountains
[J]. Journal of Glaciology and Geocryology , 2021 , 43 (1 ): 254 -262 .
[本文引用: 3]
崔航 , 曹广超 , 陈克龙 , 等 青藏高原及毗邻山地利用冰川地貌重建古气候的研究综述
[J]. 冰川冻土 , 2021 , 43 (1 ): 254 -262 .
[本文引用: 3]
[34]
Seltzer G O Climatic interpretation of alpine snowline variations on millennial time scales
[J]. Quaternary Research , 1994 , 41 (2 ): 154 -159 .
[本文引用: 1]
[35]
Vieira G Combined numerical and geomorphological reconstruction of the Serra da Estrela plateau icefield, Portugal
[J]. Geomorphology , 2008 , 97 (1/2 ): 190 -207 .
[本文引用: 1]
[36]
Paterson W S B The sliding velocity of Athabasca Glacier, Canada
[J]. Journal of Glaciology , 1970 , 9 (55 ): 55 -63 .
[本文引用: 1]
[37]
Cui Zhijiu Zhang Wei Discussion about the glacier extent and advance, retreat asynchrony during the last glaciation
[J]. Journal of Glaciology and Geocryology , 2003 , 25 (5 ): 510 -516 .
[本文引用: 1]
崔之久 , 张威 末次冰期冰川规模与冰川“异时”、“同时”问题的讨论
[J]. 冰川冻土 , 2003 , 25 (5 ): 510 -516 .
[本文引用: 1]
[38]
Shen Caiming Tang Lingyu Wang Sumin Vegetation and climate during the last 250000 years in Zoige zone
[J]. Acta Micropalaeontologica Sinica , 1996 (4 ): 373 -385 .
[本文引用: 4]
沈才明 , 唐领余 , 王苏民 若尔盖地区25万年以来的植被与气候
[J]. 微体古生物学报 , 1996 (4 ): 373 -385 .
[本文引用: 4]
[39]
Cui Hang Paleo-glaciations and paleoclimate reconstruction of the Qilian Shan
[D]. Lanzhou : Lanzhou University , 2017 .
[本文引用: 1]
崔航 祁连山地区古冰川演化序列及其古气候重建研究
[D]. 兰州 : 兰州大学 , 2017 .
[本文引用: 1]
[40]
Zhou Tian Pan Baotian Liu Xiuju et al The discovery of ice-wedge casts in Erdos: rebuilding the permafrost boundary during the Penultimate Glaciation in China
[J]. Journal of Glaciology and Geocryology , 2008 , 30 (1 ): 108 -112 .
[本文引用: 1]
周天 , 潘保田 , 刘秀菊 , 等 鄂尔多斯地区倒数第二次冰期冰楔假型的发现以及中国倒数第二次冰期多年冻土边界重建
[J]. 冰川冻土 , 2008 , 30 (1 ): 108 -112 .
[本文引用: 1]
贡嘎山地区古冰川演化序列及其气候驱动机制研究
1
2018
... 第四纪全球气候的显著特征之一是冰期和间冰期交替,丰富的第四纪冰川作用遗迹为探讨第四纪期间的气候环境变化特征与形成机制提供了良好的载体[1 -2 ] ,第四纪也是人类出现和迅速发展的时代,研究这一时期的气候变化对探讨自然环境变化对人类的影响有重要意义.随着地貌与第四纪研究的不断深入,采用相应的数学模型,并辅助地理信息系统(geographic information system,简称GIS),第四纪冰川研究已经进入了定量化研究阶段[3 -10 ] .尤其是根据古今冰川平衡线高度变化,定量化推算不同冰期时段的气温与降水,明确过去和现在气候变化的差异,可为未来气候变化趋势预测提供参考[11 -13 ] . ...
2
2006
... 第四纪全球气候的显著特征之一是冰期和间冰期交替,丰富的第四纪冰川作用遗迹为探讨第四纪期间的气候环境变化特征与形成机制提供了良好的载体[1 -2 ] ,第四纪也是人类出现和迅速发展的时代,研究这一时期的气候变化对探讨自然环境变化对人类的影响有重要意义.随着地貌与第四纪研究的不断深入,采用相应的数学模型,并辅助地理信息系统(geographic information system,简称GIS),第四纪冰川研究已经进入了定量化研究阶段[3 -10 ] .尤其是根据古今冰川平衡线高度变化,定量化推算不同冰期时段的气温与降水,明确过去和现在气候变化的差异,可为未来气候变化趋势预测提供参考[11 -13 ] . ...
... 螺髻山位于青藏高原东缘、横断山的中部,气候受东南季风和西南季风的共同影响,加上高大山体对气流的抬升作用使得这里降水充沛,11月至3月该地区受高空西风环流南支急流控制,以晴朗天气为主,降水少,4月东南季风和西南季风北上,雨季开始,9—10月印度洋暖湿气流更强烈的侵入成为年降水的第二个高峰,夏半年的降水量占全年的75%~90%[14 ] .该区域是青藏高原东缘有明确古冰川地形而无现代冰川发育的地区之一[2 ] ,在第四纪期间经历了多次冰川作用,海拔2 500 m以上保留有序列齐全、对气候变化敏感的海洋性冰川遗迹.近年来,一些学者对螺髻山第四纪冰川地貌进行了深入考察与研究,进行了第四纪冰期系列划分并建立了绝对年代学框架[15 -17 ] (图1 ).依据不同期次的冰川遗迹,运用冰川纵剖面模型、积累区面积比率法(accumulation area ratio,简称AAR)和面积-高程平衡率法(area altitude balance ratio,简称AABR),以及气温与降水关系模型(简称P-T模型)、气温递减率模型(lapse-rate model,简称LR)等,可以获得不同阶段古冰川规模及冰川物质平衡线高度(equilibrium-line altitude,简称ELA),进而得到不同冰川作用期的气候环境演变特征. ...
Climates during late Quaternary glacier advances: glacier-climate modeling in the Yingpu Valley, eastern Tibetan Plateau
1
2014
... 第四纪全球气候的显著特征之一是冰期和间冰期交替,丰富的第四纪冰川作用遗迹为探讨第四纪期间的气候环境变化特征与形成机制提供了良好的载体[1 -2 ] ,第四纪也是人类出现和迅速发展的时代,研究这一时期的气候变化对探讨自然环境变化对人类的影响有重要意义.随着地貌与第四纪研究的不断深入,采用相应的数学模型,并辅助地理信息系统(geographic information system,简称GIS),第四纪冰川研究已经进入了定量化研究阶段[3 -10 ] .尤其是根据古今冰川平衡线高度变化,定量化推算不同冰期时段的气温与降水,明确过去和现在气候变化的差异,可为未来气候变化趋势预测提供参考[11 -13 ] . ...
Recent area and ice volume change of Kangwure Glacier in the middle of Himalayas
0
2010
东昆仑山煤矿冰川雷达测厚及冰储量估算
0
2018
东昆仑山煤矿冰川雷达测厚及冰储量估算
0
2018
青藏高原冰川厚度与湖泊水位的时空变化研究
0
2017
青藏高原冰川厚度与湖泊水位的时空变化研究
0
2017
2000-2010年祁连山冰川冰储量变化
0
2018
2000-2010年祁连山冰川冰储量变化
0
2018
气候变暖背景下典型冰川储量变化及其特征: 以天山乌鲁木齐河源1号冰川为例
0
2011
气候变暖背景下典型冰川储量变化及其特征: 以天山乌鲁木齐河源1号冰川为例
0
2011
全球变暖背景下青藏高原及周边地区冰川变化的时空格局与趋势及影响
0
2019
全球变暖背景下青藏高原及周边地区冰川变化的时空格局与趋势及影响
0
2019
近50年来祁连山冰川变化: 基于中国第一、二次冰川编目数据
1
2015
... 第四纪全球气候的显著特征之一是冰期和间冰期交替,丰富的第四纪冰川作用遗迹为探讨第四纪期间的气候环境变化特征与形成机制提供了良好的载体[1 -2 ] ,第四纪也是人类出现和迅速发展的时代,研究这一时期的气候变化对探讨自然环境变化对人类的影响有重要意义.随着地貌与第四纪研究的不断深入,采用相应的数学模型,并辅助地理信息系统(geographic information system,简称GIS),第四纪冰川研究已经进入了定量化研究阶段[3 -10 ] .尤其是根据古今冰川平衡线高度变化,定量化推算不同冰期时段的气温与降水,明确过去和现在气候变化的差异,可为未来气候变化趋势预测提供参考[11 -13 ] . ...
Variations in snow cover and snowline altitude in Baspa Basin
1
2009
... 第四纪全球气候的显著特征之一是冰期和间冰期交替,丰富的第四纪冰川作用遗迹为探讨第四纪期间的气候环境变化特征与形成机制提供了良好的载体[1 -2 ] ,第四纪也是人类出现和迅速发展的时代,研究这一时期的气候变化对探讨自然环境变化对人类的影响有重要意义.随着地貌与第四纪研究的不断深入,采用相应的数学模型,并辅助地理信息系统(geographic information system,简称GIS),第四纪冰川研究已经进入了定量化研究阶段[3 -10 ] .尤其是根据古今冰川平衡线高度变化,定量化推算不同冰期时段的气温与降水,明确过去和现在气候变化的差异,可为未来气候变化趋势预测提供参考[11 -13 ] . ...
博格达峰地区气候变化特征及其对冰川变化的影响
0
2014
博格达峰地区气候变化特征及其对冰川变化的影响
0
2014
长江源区冰川对全球气候变化的响应
1
2001
... 第四纪全球气候的显著特征之一是冰期和间冰期交替,丰富的第四纪冰川作用遗迹为探讨第四纪期间的气候环境变化特征与形成机制提供了良好的载体[1 -2 ] ,第四纪也是人类出现和迅速发展的时代,研究这一时期的气候变化对探讨自然环境变化对人类的影响有重要意义.随着地貌与第四纪研究的不断深入,采用相应的数学模型,并辅助地理信息系统(geographic information system,简称GIS),第四纪冰川研究已经进入了定量化研究阶段[3 -10 ] .尤其是根据古今冰川平衡线高度变化,定量化推算不同冰期时段的气温与降水,明确过去和现在气候变化的差异,可为未来气候变化趋势预测提供参考[11 -13 ] . ...
1
1996
... 螺髻山位于青藏高原东缘、横断山的中部,气候受东南季风和西南季风的共同影响,加上高大山体对气流的抬升作用使得这里降水充沛,11月至3月该地区受高空西风环流南支急流控制,以晴朗天气为主,降水少,4月东南季风和西南季风北上,雨季开始,9—10月印度洋暖湿气流更强烈的侵入成为年降水的第二个高峰,夏半年的降水量占全年的75%~90%[14 ] .该区域是青藏高原东缘有明确古冰川地形而无现代冰川发育的地区之一[2 ] ,在第四纪期间经历了多次冰川作用,海拔2 500 m以上保留有序列齐全、对气候变化敏感的海洋性冰川遗迹.近年来,一些学者对螺髻山第四纪冰川地貌进行了深入考察与研究,进行了第四纪冰期系列划分并建立了绝对年代学框架[15 -17 ] (图1 ).依据不同期次的冰川遗迹,运用冰川纵剖面模型、积累区面积比率法(accumulation area ratio,简称AAR)和面积-高程平衡率法(area altitude balance ratio,简称AABR),以及气温与降水关系模型(简称P-T模型)、气温递减率模型(lapse-rate model,简称LR)等,可以获得不同阶段古冰川规模及冰川物质平衡线高度(equilibrium-line altitude,简称ELA),进而得到不同冰川作用期的气候环境演变特征. ...
基于年代学证据的螺髻山第四纪冰川作用研究
2
2017
... 螺髻山位于青藏高原东缘、横断山的中部,气候受东南季风和西南季风的共同影响,加上高大山体对气流的抬升作用使得这里降水充沛,11月至3月该地区受高空西风环流南支急流控制,以晴朗天气为主,降水少,4月东南季风和西南季风北上,雨季开始,9—10月印度洋暖湿气流更强烈的侵入成为年降水的第二个高峰,夏半年的降水量占全年的75%~90%[14 ] .该区域是青藏高原东缘有明确古冰川地形而无现代冰川发育的地区之一[2 ] ,在第四纪期间经历了多次冰川作用,海拔2 500 m以上保留有序列齐全、对气候变化敏感的海洋性冰川遗迹.近年来,一些学者对螺髻山第四纪冰川地貌进行了深入考察与研究,进行了第四纪冰期系列划分并建立了绝对年代学框架[15 -17 ] (图1 ).依据不同期次的冰川遗迹,运用冰川纵剖面模型、积累区面积比率法(accumulation area ratio,简称AAR)和面积-高程平衡率法(area altitude balance ratio,简称AABR),以及气温与降水关系模型(简称P-T模型)、气温递减率模型(lapse-rate model,简称LR)等,可以获得不同阶段古冰川规模及冰川物质平衡线高度(equilibrium-line altitude,简称ELA),进而得到不同冰川作用期的气候环境演变特征. ...
... 清水沟谷地的第四纪冰川沉积物保存较好,从源区冰斗到沟谷谷口依次保存有三套冰碛物(图1 ),张威等[15 ] 对这三套冰碛物的测年结果显示:第一套冰碛物上采集两个电子自旋共振样品(electron spin resonance,简称ESR)测年结果为(13±1) ka和(23±2) ka,以及两个OSL(光释光)测年结果为(15.74±1.15) ka和(23.24±1.68) ka,因此根据相对地貌和测年结果可确定第一套冰碛物形成于末次冰期晚期,对应于海洋氧同位素阶段(marine oxygen isotope stage,简称MIS)2.第二套冰碛物分布于海拔3 400~3 550 m大海子冰坎下部,终碛与侧碛相连,部分终碛被后期流水冲开,第二套冰碛上的两个ESR测年结果为(72±30) ka和(81±11) ka,结合地貌可判断其形成于末次冰期早期(MIS 4).第三套冰碛物的侧碛垄从海拔3 400 m延伸至海拔2 300 m,终碛堤位于清水沟西北2 200 m的山包上,横剖面呈月牙状堆积体,相对高度50 m[18 ] .在冰碛垄的两个样品ESR年龄为(234±45) ka和(191±157) ka,结合地貌判断其形成于倒数第二次冰期(MIS 6).倒数第二次冰期冰川从大海子冰斗(下层冰斗)向下游溢出形成了上槽谷,从海拔 3 740 m延伸到2 500 m左右,末次冰期早期形成了清水沟3 800 m左右的冰斗群以及下槽谷[19 ] . ...
螺髻山古冰川发育与构造-气候演化的耦合关系
1
2012
... 螺髻山位于青藏高原东缘、横断山的中部,气候受东南季风和西南季风的共同影响,加上高大山体对气流的抬升作用使得这里降水充沛,11月至3月该地区受高空西风环流南支急流控制,以晴朗天气为主,降水少,4月东南季风和西南季风北上,雨季开始,9—10月印度洋暖湿气流更强烈的侵入成为年降水的第二个高峰,夏半年的降水量占全年的75%~90%[14 ] .该区域是青藏高原东缘有明确古冰川地形而无现代冰川发育的地区之一[2 ] ,在第四纪期间经历了多次冰川作用,海拔2 500 m以上保留有序列齐全、对气候变化敏感的海洋性冰川遗迹.近年来,一些学者对螺髻山第四纪冰川地貌进行了深入考察与研究,进行了第四纪冰期系列划分并建立了绝对年代学框架[15 -17 ] (图1 ).依据不同期次的冰川遗迹,运用冰川纵剖面模型、积累区面积比率法(accumulation area ratio,简称AAR)和面积-高程平衡率法(area altitude balance ratio,简称AABR),以及气温与降水关系模型(简称P-T模型)、气温递减率模型(lapse-rate model,简称LR)等,可以获得不同阶段古冰川规模及冰川物质平衡线高度(equilibrium-line altitude,简称ELA),进而得到不同冰川作用期的气候环境演变特征. ...
川西晚第四纪冰川平衡线高度的确定及其影响因素探讨
3
2017
... 清水沟谷地的第四纪冰川沉积物保存较好,从源区冰斗到沟谷谷口依次保存有三套冰碛物(图1 ),张威等[15 ] 对这三套冰碛物的测年结果显示:第一套冰碛物上采集两个电子自旋共振样品(electron spin resonance,简称ESR)测年结果为(13±1) ka和(23±2) ka,以及两个OSL(光释光)测年结果为(15.74±1.15) ka和(23.24±1.68) ka,因此根据相对地貌和测年结果可确定第一套冰碛物形成于末次冰期晚期,对应于海洋氧同位素阶段(marine oxygen isotope stage,简称MIS)2.第二套冰碛物分布于海拔3 400~3 550 m大海子冰坎下部,终碛与侧碛相连,部分终碛被后期流水冲开,第二套冰碛上的两个ESR测年结果为(72±30) ka和(81±11) ka,结合地貌可判断其形成于末次冰期早期(MIS 4).第三套冰碛物的侧碛垄从海拔3 400 m延伸至海拔2 300 m,终碛堤位于清水沟西北2 200 m的山包上,横剖面呈月牙状堆积体,相对高度50 m[18 ] .在冰碛垄的两个样品ESR年龄为(234±45) ka和(191±157) ka,结合地貌判断其形成于倒数第二次冰期(MIS 6).倒数第二次冰期冰川从大海子冰斗(下层冰斗)向下游溢出形成了上槽谷,从海拔 3 740 m延伸到2 500 m左右,末次冰期早期形成了清水沟3 800 m左右的冰斗群以及下槽谷[19 ] . ...
... 将恢复出的冰川面积带入式(2) ,计算出倒数第二次冰期AAR值为0.56,末次冰期早期AAR值为0.53,末次冰期晚期AAR值为0.49,然后使用Pellitero等[20 ] 开发的ELA calculation工具输入AAR值和BR值可自动计算对应的ELA高度.从表1 看出,运用AABR法、AAR法,结合前人使用的冰斗底部高程法(CF)、末端至冰斗后壁比率法(MELM)、侧碛垄最大高度法(THAR)和TSAM法[18 ] 计算出清水沟倒数第二次冰期ELA平均值为3 132 m,末次冰期早期ELA平均值为3 776 m,末次冰期晚期ELA平均值为3 927 m.根据高晓昕[18 ] 计算的结果,螺髻山现代冰川平衡线高度为4 848 m,倒数第二次冰期相对于现代ELA下降1 716 m,末次冰期早期下降1 071 m,末次冰期晚期下降920 m. ...
... [18 ]计算的结果,螺髻山现代冰川平衡线高度为4 848 m,倒数第二次冰期相对于现代ELA下降1 716 m,末次冰期早期下降1 071 m,末次冰期晚期下降920 m. ...
四川螺髻山清水沟冰川槽谷演化及其影响因素
1
2014
... 清水沟谷地的第四纪冰川沉积物保存较好,从源区冰斗到沟谷谷口依次保存有三套冰碛物(图1 ),张威等[15 ] 对这三套冰碛物的测年结果显示:第一套冰碛物上采集两个电子自旋共振样品(electron spin resonance,简称ESR)测年结果为(13±1) ka和(23±2) ka,以及两个OSL(光释光)测年结果为(15.74±1.15) ka和(23.24±1.68) ka,因此根据相对地貌和测年结果可确定第一套冰碛物形成于末次冰期晚期,对应于海洋氧同位素阶段(marine oxygen isotope stage,简称MIS)2.第二套冰碛物分布于海拔3 400~3 550 m大海子冰坎下部,终碛与侧碛相连,部分终碛被后期流水冲开,第二套冰碛上的两个ESR测年结果为(72±30) ka和(81±11) ka,结合地貌可判断其形成于末次冰期早期(MIS 4).第三套冰碛物的侧碛垄从海拔3 400 m延伸至海拔2 300 m,终碛堤位于清水沟西北2 200 m的山包上,横剖面呈月牙状堆积体,相对高度50 m[18 ] .在冰碛垄的两个样品ESR年龄为(234±45) ka和(191±157) ka,结合地貌判断其形成于倒数第二次冰期(MIS 6).倒数第二次冰期冰川从大海子冰斗(下层冰斗)向下游溢出形成了上槽谷,从海拔 3 740 m延伸到2 500 m左右,末次冰期早期形成了清水沟3 800 m左右的冰斗群以及下槽谷[19 ] . ...
GlaRe, a GIS tool to reconstruct the 3D surface of palaeoglaciers
2
2016
... 使用Pellitero等[20 ] 开发的冰川规模重建工具箱Glacier Reconstruction Tools(简称GLARE),恢复冰川表面高程时需要古冰川底部的地形数据和古冰川分布范围.倒数第二次冰期的冰川范围以下层冰斗后壁、上槽谷、侧碛垄以及谷口终碛为参考,末次冰期早期的冰川范围以上层冰斗后壁、下槽谷、侧碛垄为参考,末次冰期晚期的冰川范围以上冰斗附近的侧碛和终碛为参考.先沿着冰川中流线计算冰川厚度,之后插值至整个冰川分布范围,最终得到整条冰川的厚度.冰川纵剖面模型是根据冰川动力学方程建立的[21 ] . ...
... 将恢复出的冰川面积带入式(2) ,计算出倒数第二次冰期AAR值为0.56,末次冰期早期AAR值为0.53,末次冰期晚期AAR值为0.49,然后使用Pellitero等[20 ] 开发的ELA calculation工具输入AAR值和BR值可自动计算对应的ELA高度.从表1 看出,运用AABR法、AAR法,结合前人使用的冰斗底部高程法(CF)、末端至冰斗后壁比率法(MELM)、侧碛垄最大高度法(THAR)和TSAM法[18 ] 计算出清水沟倒数第二次冰期ELA平均值为3 132 m,末次冰期早期ELA平均值为3 776 m,末次冰期晚期ELA平均值为3 927 m.根据高晓昕[18 ] 计算的结果,螺髻山现代冰川平衡线高度为4 848 m,倒数第二次冰期相对于现代ELA下降1 716 m,末次冰期早期下降1 071 m,末次冰期晚期下降920 m. ...
The mechanics of glacier flow
1
1952
... 使用Pellitero等[20 ] 开发的冰川规模重建工具箱Glacier Reconstruction Tools(简称GLARE),恢复冰川表面高程时需要古冰川底部的地形数据和古冰川分布范围.倒数第二次冰期的冰川范围以下层冰斗后壁、上槽谷、侧碛垄以及谷口终碛为参考,末次冰期早期的冰川范围以上层冰斗后壁、下槽谷、侧碛垄为参考,末次冰期晚期的冰川范围以上冰斗附近的侧碛和终碛为参考.先沿着冰川中流线计算冰川厚度,之后插值至整个冰川分布范围,最终得到整条冰川的厚度.冰川纵剖面模型是根据冰川动力学方程建立的[21 ] . ...
藏南卡鲁雄峰枪勇冰川新冰期冰川发育探讨
1
2018
... ELA是指冰川上积累量与消融量相等的点连线的高度[22 -24 ] .本文采用目前较为常用的AAR和AABR法来恢复清水沟古冰川物质平衡线高度.当冰川处于稳定状态时,冰川积累区面积与整个冰川面积的比值即为AAR值[25 ] ,古冰川ELA的计算参考Kern等[26 ] 提出的AAR值与冰川面积间的对数关系式. ...
藏南卡鲁雄峰枪勇冰川新冰期冰川发育探讨
1
2018
... ELA是指冰川上积累量与消融量相等的点连线的高度[22 -24 ] .本文采用目前较为常用的AAR和AABR法来恢复清水沟古冰川物质平衡线高度.当冰川处于稳定状态时,冰川积累区面积与整个冰川面积的比值即为AAR值[25 ] ,古冰川ELA的计算参考Kern等[26 ] 提出的AAR值与冰川面积间的对数关系式. ...
山地冰川平衡线高度作为气候变化代用指标的讨论
0
2007
山地冰川平衡线高度作为气候变化代用指标的讨论
0
2007
青藏高原东部冰川平衡线高度的模拟及预测
1
2017
... ELA是指冰川上积累量与消融量相等的点连线的高度[22 -24 ] .本文采用目前较为常用的AAR和AABR法来恢复清水沟古冰川物质平衡线高度.当冰川处于稳定状态时,冰川积累区面积与整个冰川面积的比值即为AAR值[25 ] ,古冰川ELA的计算参考Kern等[26 ] 提出的AAR值与冰川面积间的对数关系式. ...
青藏高原东部冰川平衡线高度的模拟及预测
1
2017
... ELA是指冰川上积累量与消融量相等的点连线的高度[22 -24 ] .本文采用目前较为常用的AAR和AABR法来恢复清水沟古冰川物质平衡线高度.当冰川处于稳定状态时,冰川积累区面积与整个冰川面积的比值即为AAR值[25 ] ,古冰川ELA的计算参考Kern等[26 ] 提出的AAR值与冰川面积间的对数关系式. ...
Recent variations in mass net budgets of glaciers in western North America
1
58
... ELA是指冰川上积累量与消融量相等的点连线的高度[22 -24 ] .本文采用目前较为常用的AAR和AABR法来恢复清水沟古冰川物质平衡线高度.当冰川处于稳定状态时,冰川积累区面积与整个冰川面积的比值即为AAR值[25 ] ,古冰川ELA的计算参考Kern等[26 ] 提出的AAR值与冰川面积间的对数关系式. ...
Size specific steady-state accumulation-area ratio: an improvement for equilibrium-line estimation of small palaeoglaciers
1
2010
... ELA是指冰川上积累量与消融量相等的点连线的高度[22 -24 ] .本文采用目前较为常用的AAR和AABR法来恢复清水沟古冰川物质平衡线高度.当冰川处于稳定状态时,冰川积累区面积与整个冰川面积的比值即为AAR值[25 ] ,古冰川ELA的计算参考Kern等[26 ] 提出的AAR值与冰川面积间的对数关系式. ...
The use of hypsometry to indicate long-term stability and response of valley glaciers to changes in mass transfer
1
1984
... AABR法是由Furbish等[27 ] 提出的根据冰川消融区和积累区的物质平衡梯度来计算冰川物质平衡线高度的方法,Rea[28 ] 在计算全球65条冰川的物质平衡时发现BR的平均值为1.75±0.71,因此本文参考此平均值计算清水沟的BR值.本文基于恢复后的古冰面高程计算不同时期的古ELA,可以使计算结果更为精确. ...
Defining modern day area-altitude balance ratios (AABRs) and their use in glacier-climate reconstructions
1
2009
... AABR法是由Furbish等[27 ] 提出的根据冰川消融区和积累区的物质平衡梯度来计算冰川物质平衡线高度的方法,Rea[28 ] 在计算全球65条冰川的物质平衡时发现BR的平均值为1.75±0.71,因此本文参考此平均值计算清水沟的BR值.本文基于恢复后的古冰面高程计算不同时期的古ELA,可以使计算结果更为精确. ...
2
1988
... 气温和降水是影响冰川ELA变化的重要因素[29 -30 ] ,因而现代冰川ELA处气温和降水的关系也被广泛地应用于气候重建[31 -32 ] .古冰川运用P-T模型时要结合ELA的变化量及气温递减率,从而得到因为ELA位置的变化而产生的气温变化量.在假定古冰川前进时ELA和现代冰川ELA处气温和降水关系一致的基础上,结合气候代用指标得到降水的变化量,带入到P-T模型中得到气温变化量.然后将位置变化产生的气温变化量和降水波动产生的气温变化量相加,就是气温波动值[33 ] .本文在恢复不同阶段古气候时参考了施雅风等[29 ] 的研究,建立了中国西部冰川年降水量P (mm)和年均温T (℃)之间的关系式. ...
... [29 ]的研究,建立了中国西部冰川年降水量P (mm)和年均温T (℃)之间的关系式. ...
Climate at the equilibrium line of glaciers
2
1992
... 气温和降水是影响冰川ELA变化的重要因素[29 -30 ] ,因而现代冰川ELA处气温和降水的关系也被广泛地应用于气候重建[31 -32 ] .古冰川运用P-T模型时要结合ELA的变化量及气温递减率,从而得到因为ELA位置的变化而产生的气温变化量.在假定古冰川前进时ELA和现代冰川ELA处气温和降水关系一致的基础上,结合气候代用指标得到降水的变化量,带入到P-T模型中得到气温变化量.然后将位置变化产生的气温变化量和降水波动产生的气温变化量相加,就是气温波动值[33 ] .本文在恢复不同阶段古气候时参考了施雅风等[29 ] 的研究,建立了中国西部冰川年降水量P (mm)和年均温T (℃)之间的关系式. ...
... 使用LR模型对气温变化进行恢复的方法见文献[39 ].LR模型与P-T模型相比,还需要冰川积累梯度和不同阶段ELA的乘积,以及ELA处冰川积累量与温度的转换系数(f ).由式(6) 可以得到冰川积累梯度和不同阶段ELA的乘积.根据Ohmura等[30 ] 提出的f 值,本文采用0.0029 ℃·mm-1 .降水比例与P-T模型设置为一致,将上述数据带入LR模型计算,结果如图4 (b)和表3 所示. ...
Mid-MIS 3 climate inferred from reconstructing the Dalijia Shan ice cap, north-eastern Tibetan Plateau
1
2015
... 气温和降水是影响冰川ELA变化的重要因素[29 -30 ] ,因而现代冰川ELA处气温和降水的关系也被广泛地应用于气候重建[31 -32 ] .古冰川运用P-T模型时要结合ELA的变化量及气温递减率,从而得到因为ELA位置的变化而产生的气温变化量.在假定古冰川前进时ELA和现代冰川ELA处气温和降水关系一致的基础上,结合气候代用指标得到降水的变化量,带入到P-T模型中得到气温变化量.然后将位置变化产生的气温变化量和降水波动产生的气温变化量相加,就是气温波动值[33 ] .本文在恢复不同阶段古气候时参考了施雅风等[29 ] 的研究,建立了中国西部冰川年降水量P (mm)和年均温T (℃)之间的关系式. ...
Glacial advances in southeastern Tibet during late Quaternary and their implications for climatic changes
1
2010
... 气温和降水是影响冰川ELA变化的重要因素[29 -30 ] ,因而现代冰川ELA处气温和降水的关系也被广泛地应用于气候重建[31 -32 ] .古冰川运用P-T模型时要结合ELA的变化量及气温递减率,从而得到因为ELA位置的变化而产生的气温变化量.在假定古冰川前进时ELA和现代冰川ELA处气温和降水关系一致的基础上,结合气候代用指标得到降水的变化量,带入到P-T模型中得到气温变化量.然后将位置变化产生的气温变化量和降水波动产生的气温变化量相加,就是气温波动值[33 ] .本文在恢复不同阶段古气候时参考了施雅风等[29 ] 的研究,建立了中国西部冰川年降水量P (mm)和年均温T (℃)之间的关系式. ...
青藏高原及毗邻山地利用冰川地貌重建古气候的研究综述
3
2021
... 气温和降水是影响冰川ELA变化的重要因素[29 -30 ] ,因而现代冰川ELA处气温和降水的关系也被广泛地应用于气候重建[31 -32 ] .古冰川运用P-T模型时要结合ELA的变化量及气温递减率,从而得到因为ELA位置的变化而产生的气温变化量.在假定古冰川前进时ELA和现代冰川ELA处气温和降水关系一致的基础上,结合气候代用指标得到降水的变化量,带入到P-T模型中得到气温变化量.然后将位置变化产生的气温变化量和降水波动产生的气温变化量相加,就是气温波动值[33 ] .本文在恢复不同阶段古气候时参考了施雅风等[29 ] 的研究,建立了中国西部冰川年降水量P (mm)和年均温T (℃)之间的关系式. ...
... 在使用LR模型时要考虑温度递减率、积累梯度和积累量的变化[34 ] .该模型应用ELA处冰川积累量与温度的转换系数f ,将由于ELA升降导致的降水变化量转化为相应的气温变化量[33 ] . ...
... 使用P-T模型对气温变化进行恢复的方法如下[33 ] :通过式(5) 得到气温递减率为0.54 ℃·( 100m)-1 ,结合倒数第二次冰期ELA下降高度,先得出因为位置变化导致的气温变化为9.27 ℃;然后根据式(6) 计算出现代ELA处的降水为512.38 mm,根据式(3) 计算出现代ELA处的气温为-11.10 ℃,位于青藏高原东北部若尔盖盆地RM钻孔的孢粉分析结果[38 ] 显示,MIS 6年降水量为现在的60%~80%,因此在MIS 6时现代ELA处的降水为307.43~409.90 mm,使用式(3) 得到ELA处的年均温为-13.70~-12.23 ℃,所以降水波动产生的气温变化量为1.13~2.59 ℃;位置和降水波动产生的气温变化量相加就是气温的波动值,因此得出在倒数第二次冰期时气温比现在低10~12 ℃.末次冰期早期和晚期的降水量分别为现在的80%左右和60%~80%[38 ] ,按照上述方法得到的计算结果如表3 所示.图4 (a)模拟了P-T模型不同冰进阶段年降水量占现代年降水量的比例由10%变化到200%,变化的步长为10%时的气候状况. ...
Climatic interpretation of alpine snowline variations on millennial time scales
1
1994
... 在使用LR模型时要考虑温度递减率、积累梯度和积累量的变化[34 ] .该模型应用ELA处冰川积累量与温度的转换系数f ,将由于ELA升降导致的降水变化量转化为相应的气温变化量[33 ] . ...
Combined numerical and geomorphological reconstruction of the Serra da Estrela plateau icefield, Portugal
1
2008
... 测量的山谷指数在末次冰期晚期最大,末次冰期早期居中,倒数第二次冰期最小,这主要是因为靠近冰川源头受到的冰川侵蚀更强烈、持续时间也更长,使槽谷底部更趋近于“U”形[35 ] .对于山谷冰川来说,剪切应力在50~150 kPa的范围内[36 ] ,恢复的各阶段冰川底部剪切应力平均值均在此范围内.研究区倒数第二次冰期以来冰川的面积和体积都不断减小,这种第四纪以来冰期规模逐渐减小的特点在中国山地冰川区具有普遍性[37 ] . ...
The sliding velocity of Athabasca Glacier, Canada
1
1970
... 测量的山谷指数在末次冰期晚期最大,末次冰期早期居中,倒数第二次冰期最小,这主要是因为靠近冰川源头受到的冰川侵蚀更强烈、持续时间也更长,使槽谷底部更趋近于“U”形[35 ] .对于山谷冰川来说,剪切应力在50~150 kPa的范围内[36 ] ,恢复的各阶段冰川底部剪切应力平均值均在此范围内.研究区倒数第二次冰期以来冰川的面积和体积都不断减小,这种第四纪以来冰期规模逐渐减小的特点在中国山地冰川区具有普遍性[37 ] . ...
末次冰期冰川规模与冰川“异时”、“同时”问题的讨论
1
2003
... 测量的山谷指数在末次冰期晚期最大,末次冰期早期居中,倒数第二次冰期最小,这主要是因为靠近冰川源头受到的冰川侵蚀更强烈、持续时间也更长,使槽谷底部更趋近于“U”形[35 ] .对于山谷冰川来说,剪切应力在50~150 kPa的范围内[36 ] ,恢复的各阶段冰川底部剪切应力平均值均在此范围内.研究区倒数第二次冰期以来冰川的面积和体积都不断减小,这种第四纪以来冰期规模逐渐减小的特点在中国山地冰川区具有普遍性[37 ] . ...
末次冰期冰川规模与冰川“异时”、“同时”问题的讨论
1
2003
... 测量的山谷指数在末次冰期晚期最大,末次冰期早期居中,倒数第二次冰期最小,这主要是因为靠近冰川源头受到的冰川侵蚀更强烈、持续时间也更长,使槽谷底部更趋近于“U”形[35 ] .对于山谷冰川来说,剪切应力在50~150 kPa的范围内[36 ] ,恢复的各阶段冰川底部剪切应力平均值均在此范围内.研究区倒数第二次冰期以来冰川的面积和体积都不断减小,这种第四纪以来冰期规模逐渐减小的特点在中国山地冰川区具有普遍性[37 ] . ...
若尔盖地区25万年以来的植被与气候
4
1996
... 使用P-T模型对气温变化进行恢复的方法如下[33 ] :通过式(5) 得到气温递减率为0.54 ℃·( 100m)-1 ,结合倒数第二次冰期ELA下降高度,先得出因为位置变化导致的气温变化为9.27 ℃;然后根据式(6) 计算出现代ELA处的降水为512.38 mm,根据式(3) 计算出现代ELA处的气温为-11.10 ℃,位于青藏高原东北部若尔盖盆地RM钻孔的孢粉分析结果[38 ] 显示,MIS 6年降水量为现在的60%~80%,因此在MIS 6时现代ELA处的降水为307.43~409.90 mm,使用式(3) 得到ELA处的年均温为-13.70~-12.23 ℃,所以降水波动产生的气温变化量为1.13~2.59 ℃;位置和降水波动产生的气温变化量相加就是气温的波动值,因此得出在倒数第二次冰期时气温比现在低10~12 ℃.末次冰期早期和晚期的降水量分别为现在的80%左右和60%~80%[38 ] ,按照上述方法得到的计算结果如表3 所示.图4 (a)模拟了P-T模型不同冰进阶段年降水量占现代年降水量的比例由10%变化到200%,变化的步长为10%时的气候状况. ...
... [38 ],按照上述方法得到的计算结果如表3 所示.图4 (a)模拟了P-T模型不同冰进阶段年降水量占现代年降水量的比例由10%变化到200%,变化的步长为10%时的气候状况. ...
... 根据P-T模型和LR模型的结果(表3 ),可以看出:倒数第二次冰期气温降低值为8~12 ℃,这与根据冰楔假型恢复出的鄂尔多斯倒数第二次冰期时冻土边界附近的年均温比现在低10~15 ℃相符[40 ] ,该阶段降水仅为现在的60%~80%,所以气温大幅度的下降是导致该阶段冰川规模最大的原因;末次冰期早期气温降低值为6~7 ℃,与若尔盖盆地孢粉记录显示MIS 4阶段年平均气温比现在低4 ℃相差不大[38 ] ,该阶段降水为现在的80%左右,但是气温下降幅度小于倒数第二次冰期,因而冰川规模小于倒数第二次冰期;末次冰期晚期气温降低值为4~8 ℃,与若尔盖盆地孢粉记录显示MIS 2阶段的年平均气温比现在低5~6 ℃的情况一致[38 ] ,末次冰期晚期降水仅为现在的60%~80%,降温幅度也不大,因此该阶段冰川规模最小. ...
... [38 ],末次冰期晚期降水仅为现在的60%~80%,降温幅度也不大,因此该阶段冰川规模最小. ...
祁连山地区古冰川演化序列及其古气候重建研究
1
2017
... 使用LR模型对气温变化进行恢复的方法见文献[39 ].LR模型与P-T模型相比,还需要冰川积累梯度和不同阶段ELA的乘积,以及ELA处冰川积累量与温度的转换系数(f ).由式(6) 可以得到冰川积累梯度和不同阶段ELA的乘积.根据Ohmura等[30 ] 提出的f 值,本文采用0.0029 ℃·mm-1 .降水比例与P-T模型设置为一致,将上述数据带入LR模型计算,结果如图4 (b)和表3 所示. ...
祁连山地区古冰川演化序列及其古气候重建研究
1
2017
... 使用LR模型对气温变化进行恢复的方法见文献[39 ].LR模型与P-T模型相比,还需要冰川积累梯度和不同阶段ELA的乘积,以及ELA处冰川积累量与温度的转换系数(f ).由式(6) 可以得到冰川积累梯度和不同阶段ELA的乘积.根据Ohmura等[30 ] 提出的f 值,本文采用0.0029 ℃·mm-1 .降水比例与P-T模型设置为一致,将上述数据带入LR模型计算,结果如图4 (b)和表3 所示. ...
鄂尔多斯地区倒数第二次冰期冰楔假型的发现以及中国倒数第二次冰期多年冻土边界重建
1
2008
... 根据P-T模型和LR模型的结果(表3 ),可以看出:倒数第二次冰期气温降低值为8~12 ℃,这与根据冰楔假型恢复出的鄂尔多斯倒数第二次冰期时冻土边界附近的年均温比现在低10~15 ℃相符[40 ] ,该阶段降水仅为现在的60%~80%,所以气温大幅度的下降是导致该阶段冰川规模最大的原因;末次冰期早期气温降低值为6~7 ℃,与若尔盖盆地孢粉记录显示MIS 4阶段年平均气温比现在低4 ℃相差不大[38 ] ,该阶段降水为现在的80%左右,但是气温下降幅度小于倒数第二次冰期,因而冰川规模小于倒数第二次冰期;末次冰期晚期气温降低值为4~8 ℃,与若尔盖盆地孢粉记录显示MIS 2阶段的年平均气温比现在低5~6 ℃的情况一致[38 ] ,末次冰期晚期降水仅为现在的60%~80%,降温幅度也不大,因此该阶段冰川规模最小. ...


 甘公网安备 62010202000676号