Assessment of past, present and future environmental changes on the Tibetan Plateau
1
2015
... 青藏高原作为第三极,其独特的冰冻圈地貌对全球变暖极其敏感,近50年来青藏高原气温以0.3~0.4 ℃·(10a)-1的速率上升,其增温速率是全球平均的2倍[1-2],即使在1998—2012年全球变暖停滞期[3],青藏高原地表气温仍持续升高[4-5].受高原变暖影响,出现了冰川退缩、冻土消融、湖泊扩张、极端天气气候事件频发、高原物种减少等现象[6-8].为进一步评估未来青藏高原气候环境的变化趋势,亟需对青藏高原未来的地表气温变化进行研究. ...
青藏高原环境变化科学评估: 过去、现在与未来
1
2015
... 青藏高原作为第三极,其独特的冰冻圈地貌对全球变暖极其敏感,近50年来青藏高原气温以0.3~0.4 ℃·(10a)-1的速率上升,其增温速率是全球平均的2倍[1-2],即使在1998—2012年全球变暖停滞期[3],青藏高原地表气温仍持续升高[4-5].受高原变暖影响,出现了冰川退缩、冻土消融、湖泊扩张、极端天气气候事件频发、高原物种减少等现象[6-8].为进一步评估未来青藏高原气候环境的变化趋势,亟需对青藏高原未来的地表气温变化进行研究. ...
Tibetan Plateau warming and precipitation changes in East Asia
1
2008
... 青藏高原作为第三极,其独特的冰冻圈地貌对全球变暖极其敏感,近50年来青藏高原气温以0.3~0.4 ℃·(10a)-1的速率上升,其增温速率是全球平均的2倍[1-2],即使在1998—2012年全球变暖停滞期[3],青藏高原地表气温仍持续升高[4-5].受高原变暖影响,出现了冰川退缩、冻土消融、湖泊扩张、极端天气气候事件频发、高原物种减少等现象[6-8].为进一步评估未来青藏高原气候环境的变化趋势,亟需对青藏高原未来的地表气温变化进行研究. ...
Reconciling controversies about the ‘global warming hiatus’
1
2017
... 青藏高原作为第三极,其独特的冰冻圈地貌对全球变暖极其敏感,近50年来青藏高原气温以0.3~0.4 ℃·(10a)-1的速率上升,其增温速率是全球平均的2倍[1-2],即使在1998—2012年全球变暖停滞期[3],青藏高原地表气温仍持续升高[4-5].受高原变暖影响,出现了冰川退缩、冻土消融、湖泊扩张、极端天气气候事件频发、高原物种减少等现象[6-8].为进一步评估未来青藏高原气候环境的变化趋势,亟需对青藏高原未来的地表气温变化进行研究. ...
Changes in air temperature over China in response to the recent global warming hiatus
1
2019
... 青藏高原作为第三极,其独特的冰冻圈地貌对全球变暖极其敏感,近50年来青藏高原气温以0.3~0.4 ℃·(10a)-1的速率上升,其增温速率是全球平均的2倍[1-2],即使在1998—2012年全球变暖停滞期[3],青藏高原地表气温仍持续升高[4-5].受高原变暖影响,出现了冰川退缩、冻土消融、湖泊扩张、极端天气气候事件频发、高原物种减少等现象[6-8].为进一步评估未来青藏高原气候环境的变化趋势,亟需对青藏高原未来的地表气温变化进行研究. ...
Does the climate warming hiatus exist over the Tibetan Plateau?
1
2015
... 青藏高原作为第三极,其独特的冰冻圈地貌对全球变暖极其敏感,近50年来青藏高原气温以0.3~0.4 ℃·(10a)-1的速率上升,其增温速率是全球平均的2倍[1-2],即使在1998—2012年全球变暖停滞期[3],青藏高原地表气温仍持续升高[4-5].受高原变暖影响,出现了冰川退缩、冻土消融、湖泊扩张、极端天气气候事件频发、高原物种减少等现象[6-8].为进一步评估未来青藏高原气候环境的变化趋势,亟需对青藏高原未来的地表气温变化进行研究. ...
Recent Third Pole’s rapid warming accompanies cryospheric melt and water cycle intensification and interactions between monsoon and environment: multi-disciplinary approach with observation, modeling and analysis
1
2019
... 青藏高原作为第三极,其独特的冰冻圈地貌对全球变暖极其敏感,近50年来青藏高原气温以0.3~0.4 ℃·(10a)-1的速率上升,其增温速率是全球平均的2倍[1-2],即使在1998—2012年全球变暖停滞期[3],青藏高原地表气温仍持续升高[4-5].受高原变暖影响,出现了冰川退缩、冻土消融、湖泊扩张、极端天气气候事件频发、高原物种减少等现象[6-8].为进一步评估未来青藏高原气候环境的变化趋势,亟需对青藏高原未来的地表气温变化进行研究. ...
Asian Water Tower change and its impacts
2019
Effects of changed Asian Water Tower on Tibetan Plateau ecosystem: a review
1
2019
... 青藏高原作为第三极,其独特的冰冻圈地貌对全球变暖极其敏感,近50年来青藏高原气温以0.3~0.4 ℃·(10a)-1的速率上升,其增温速率是全球平均的2倍[1-2],即使在1998—2012年全球变暖停滞期[3],青藏高原地表气温仍持续升高[4-5].受高原变暖影响,出现了冰川退缩、冻土消融、湖泊扩张、极端天气气候事件频发、高原物种减少等现象[6-8].为进一步评估未来青藏高原气候环境的变化趋势,亟需对青藏高原未来的地表气温变化进行研究. ...
“亚洲水塔”变化对青藏高原生态系统的影响
1
2019
... 青藏高原作为第三极,其独特的冰冻圈地貌对全球变暖极其敏感,近50年来青藏高原气温以0.3~0.4 ℃·(10a)-1的速率上升,其增温速率是全球平均的2倍[1-2],即使在1998—2012年全球变暖停滞期[3],青藏高原地表气温仍持续升高[4-5].受高原变暖影响,出现了冰川退缩、冻土消融、湖泊扩张、极端天气气候事件频发、高原物种减少等现象[6-8].为进一步评估未来青藏高原气候环境的变化趋势,亟需对青藏高原未来的地表气温变化进行研究. ...
Climatic warming in the Tibetan Plateau during recent decades
1
2000
... 已有研究利用观测数据、再分析资料等从不同角度研究了青藏高原过去的地表气温变化[9-11],发现青藏高原不同区域、不同海拔的升温速率和升温幅度差异明显[12-13].同时,基于模式模拟也对青藏高原地表气温在不同情景下的变化进行了大量研究[14-18].1995年发起的国际耦合模式比较计划(Coupled Model Intercomparison Project, CMIP)提供了历史时期以及不同碳排放情景下未来气候变化的模拟结果,这为全球气候变化研究提供了大量的基础数据[19-20].分析2012年发布的CMIP5模式数据发现,CMIP5模式对青藏高原地表气温的模拟存在不同程度的冷偏差,并且多模式集合平均的模拟效果要优于大多数单个模式[18,21-22];同时也对青藏高原未来的地表气温变化进行了预估[23-25],研究表明青藏高原区域平均地表气温在21世纪早期(2016—2035年)、中期(2046—2065年)和末期(2081—2100年)在典型浓度路径(representative concentration pathway, RCP)4.5情景下,相对于1986—2005年,将分别升高1.1 ℃、2.1 ℃和2.7 ℃.受复杂的升温机制影响,在全球平均温度较工业化前升温1.5 ℃和2 ℃的情况下,青藏高原受变暖影响的时间将比全球平均提早约10年,即高原升温幅度要大于全球平均水平[12]. ...
Temporal and spatial characteristics and possible cause research of Qinghai-Tibetan Plateau warming from 1980 to 2016
2020
1980—2016年青藏高原变暖时空特征及其可能影响原因
2020
Quantitative analysis of surface warming amplification over the Tibetan Plateau after the late 1990s using surface energy balance equation
1
2017
... 已有研究利用观测数据、再分析资料等从不同角度研究了青藏高原过去的地表气温变化[9-11],发现青藏高原不同区域、不同海拔的升温速率和升温幅度差异明显[12-13].同时,基于模式模拟也对青藏高原地表气温在不同情景下的变化进行了大量研究[14-18].1995年发起的国际耦合模式比较计划(Coupled Model Intercomparison Project, CMIP)提供了历史时期以及不同碳排放情景下未来气候变化的模拟结果,这为全球气候变化研究提供了大量的基础数据[19-20].分析2012年发布的CMIP5模式数据发现,CMIP5模式对青藏高原地表气温的模拟存在不同程度的冷偏差,并且多模式集合平均的模拟效果要优于大多数单个模式[18,21-22];同时也对青藏高原未来的地表气温变化进行了预估[23-25],研究表明青藏高原区域平均地表气温在21世纪早期(2016—2035年)、中期(2046—2065年)和末期(2081—2100年)在典型浓度路径(representative concentration pathway, RCP)4.5情景下,相对于1986—2005年,将分别升高1.1 ℃、2.1 ℃和2.7 ℃.受复杂的升温机制影响,在全球平均温度较工业化前升温1.5 ℃和2 ℃的情况下,青藏高原受变暖影响的时间将比全球平均提早约10年,即高原升温幅度要大于全球平均水平[12]. ...
Robust elevation dependency warming over the Tibetan Plateau under global warming of 1.5 ℃ and 2 ℃
3
2019
... 已有研究利用观测数据、再分析资料等从不同角度研究了青藏高原过去的地表气温变化[9-11],发现青藏高原不同区域、不同海拔的升温速率和升温幅度差异明显[12-13].同时,基于模式模拟也对青藏高原地表气温在不同情景下的变化进行了大量研究[14-18].1995年发起的国际耦合模式比较计划(Coupled Model Intercomparison Project, CMIP)提供了历史时期以及不同碳排放情景下未来气候变化的模拟结果,这为全球气候变化研究提供了大量的基础数据[19-20].分析2012年发布的CMIP5模式数据发现,CMIP5模式对青藏高原地表气温的模拟存在不同程度的冷偏差,并且多模式集合平均的模拟效果要优于大多数单个模式[18,21-22];同时也对青藏高原未来的地表气温变化进行了预估[23-25],研究表明青藏高原区域平均地表气温在21世纪早期(2016—2035年)、中期(2046—2065年)和末期(2081—2100年)在典型浓度路径(representative concentration pathway, RCP)4.5情景下,相对于1986—2005年,将分别升高1.1 ℃、2.1 ℃和2.7 ℃.受复杂的升温机制影响,在全球平均温度较工业化前升温1.5 ℃和2 ℃的情况下,青藏高原受变暖影响的时间将比全球平均提早约10年,即高原升温幅度要大于全球平均水平[12]. ...
... [12]. ...
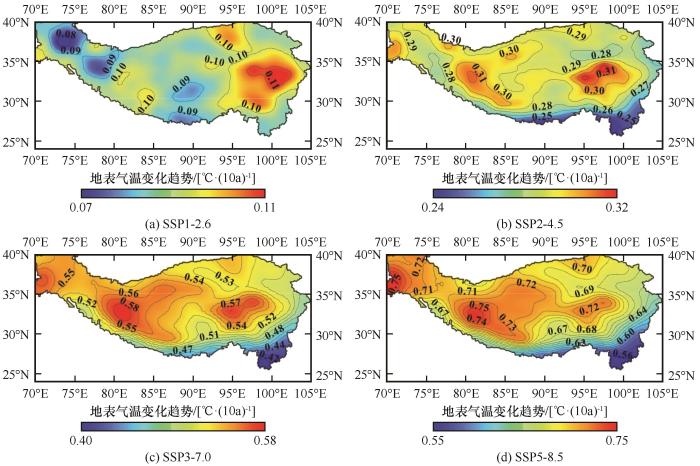
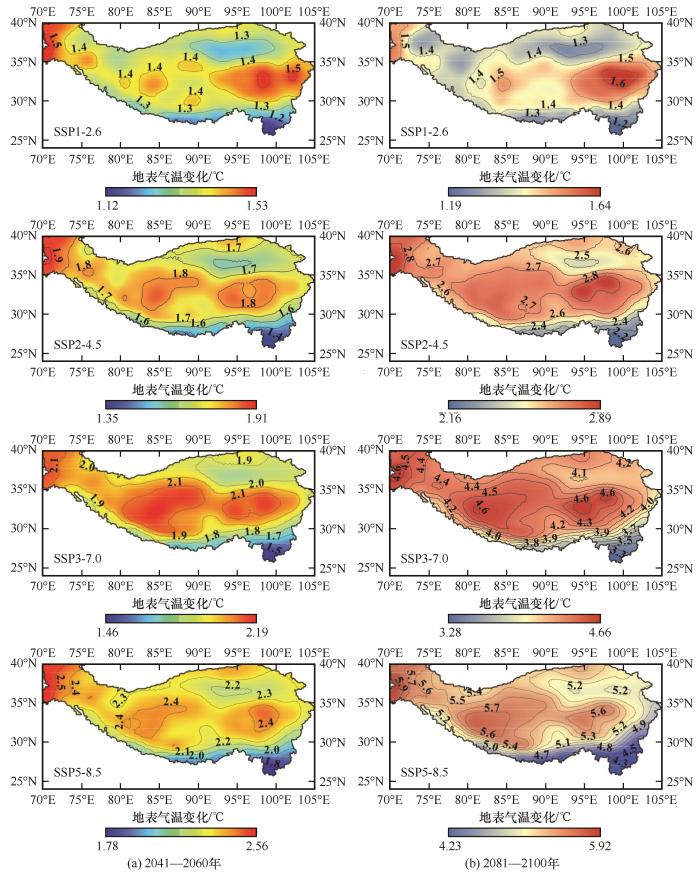
... 利用多模式集合平均模拟结果,分析了2015—2100年青藏高原年均地表气温的时空变化,得出在4种SSP情景下地表气温均呈增温趋势,且排放情景越高,增温幅度越大.由于各情景模拟的排放和辐射强迫不同,2015—2100年间青藏高原在不同情景下的线性增温趋势差异较大,在SSP1-2.6、SSP2-4.5、SSP3-7.0和SSP5-8.5情景下,增温趋势分别为0.10 ℃·(10a)-1、0.29 ℃·(10a)-1、0.53 ℃·(10a)-1和0.69 ℃·(10a)-1.除SSP1-2.6情景外,其余情景下青藏高原的升温速率均要高于IPCC全球升温1.5 ℃特别报告指出的全球目前近0.2 ℃每10年的升温幅度[40].相对于1995—2014年参考时段,到本世纪中期(2041—2060年),青藏高原区域年平均地表气温将分别增加1.37 ℃、1.72 ℃、1.98 ℃和2.30 ℃,而到本世纪末期(2081—2100年),平均气温将分别增加1.42 ℃、2.65 ℃、4.28 ℃和5.38 ℃.不同情景下高原增温趋势和增温幅度存在明显的差异,但帕米尔高原、藏北高原中西部和巴颜喀拉山区都为三个升温中心,且增温趋势最小的区域都集中于藏东南地区.目前认为出现三个升温中心的原因可能与复杂地形、海拔高度、冰雪覆盖率有关,另外巴颜喀拉山区出现升温中心可能还与人类活动影响有关,已有研究也表明高原西北部和南部高海拔地区增温明显[12,41].今后将对升温原因与机制进行详细探究. ...
Climate change characteristics in Qinghai-Tibetan Plateau during 1961—2010
1
2019
... 已有研究利用观测数据、再分析资料等从不同角度研究了青藏高原过去的地表气温变化[9-11],发现青藏高原不同区域、不同海拔的升温速率和升温幅度差异明显[12-13].同时,基于模式模拟也对青藏高原地表气温在不同情景下的变化进行了大量研究[14-18].1995年发起的国际耦合模式比较计划(Coupled Model Intercomparison Project, CMIP)提供了历史时期以及不同碳排放情景下未来气候变化的模拟结果,这为全球气候变化研究提供了大量的基础数据[19-20].分析2012年发布的CMIP5模式数据发现,CMIP5模式对青藏高原地表气温的模拟存在不同程度的冷偏差,并且多模式集合平均的模拟效果要优于大多数单个模式[18,21-22];同时也对青藏高原未来的地表气温变化进行了预估[23-25],研究表明青藏高原区域平均地表气温在21世纪早期(2016—2035年)、中期(2046—2065年)和末期(2081—2100年)在典型浓度路径(representative concentration pathway, RCP)4.5情景下,相对于1986—2005年,将分别升高1.1 ℃、2.1 ℃和2.7 ℃.受复杂的升温机制影响,在全球平均温度较工业化前升温1.5 ℃和2 ℃的情况下,青藏高原受变暖影响的时间将比全球平均提早约10年,即高原升温幅度要大于全球平均水平[12]. ...
1961—2010年青藏高原气候变化特征分析
1
2019
... 已有研究利用观测数据、再分析资料等从不同角度研究了青藏高原过去的地表气温变化[9-11],发现青藏高原不同区域、不同海拔的升温速率和升温幅度差异明显[12-13].同时,基于模式模拟也对青藏高原地表气温在不同情景下的变化进行了大量研究[14-18].1995年发起的国际耦合模式比较计划(Coupled Model Intercomparison Project, CMIP)提供了历史时期以及不同碳排放情景下未来气候变化的模拟结果,这为全球气候变化研究提供了大量的基础数据[19-20].分析2012年发布的CMIP5模式数据发现,CMIP5模式对青藏高原地表气温的模拟存在不同程度的冷偏差,并且多模式集合平均的模拟效果要优于大多数单个模式[18,21-22];同时也对青藏高原未来的地表气温变化进行了预估[23-25],研究表明青藏高原区域平均地表气温在21世纪早期(2016—2035年)、中期(2046—2065年)和末期(2081—2100年)在典型浓度路径(representative concentration pathway, RCP)4.5情景下,相对于1986—2005年,将分别升高1.1 ℃、2.1 ℃和2.7 ℃.受复杂的升温机制影响,在全球平均温度较工业化前升温1.5 ℃和2 ℃的情况下,青藏高原受变暖影响的时间将比全球平均提早约10年,即高原升温幅度要大于全球平均水平[12]. ...
Assessment of CMIP5 GCM simulation performance for temperature projection in the Tibetan Plateau
1
2019
... 已有研究利用观测数据、再分析资料等从不同角度研究了青藏高原过去的地表气温变化[9-11],发现青藏高原不同区域、不同海拔的升温速率和升温幅度差异明显[12-13].同时,基于模式模拟也对青藏高原地表气温在不同情景下的变化进行了大量研究[14-18].1995年发起的国际耦合模式比较计划(Coupled Model Intercomparison Project, CMIP)提供了历史时期以及不同碳排放情景下未来气候变化的模拟结果,这为全球气候变化研究提供了大量的基础数据[19-20].分析2012年发布的CMIP5模式数据发现,CMIP5模式对青藏高原地表气温的模拟存在不同程度的冷偏差,并且多模式集合平均的模拟效果要优于大多数单个模式[18,21-22];同时也对青藏高原未来的地表气温变化进行了预估[23-25],研究表明青藏高原区域平均地表气温在21世纪早期(2016—2035年)、中期(2046—2065年)和末期(2081—2100年)在典型浓度路径(representative concentration pathway, RCP)4.5情景下,相对于1986—2005年,将分别升高1.1 ℃、2.1 ℃和2.7 ℃.受复杂的升温机制影响,在全球平均温度较工业化前升温1.5 ℃和2 ℃的情况下,青藏高原受变暖影响的时间将比全球平均提早约10年,即高原升温幅度要大于全球平均水平[12]. ...
An overview of projected climate and environmental changes across the Tibetan Plateau in the 21st century
2015
青藏高原21世纪气候和环境变化预估研究进展
2015
Rapid warming in the Tibetan Plateau from observations and CMIP5 models in recent decades
2016
Simulation of temperature extremes in the Tibetan Plateau from CMIP5 models and comparison with gridded observations
2018
Understanding the surface temperature cold bias in CMIP5 AGCMs over the Tibetan Plateau
2
2017
... 已有研究利用观测数据、再分析资料等从不同角度研究了青藏高原过去的地表气温变化[9-11],发现青藏高原不同区域、不同海拔的升温速率和升温幅度差异明显[12-13].同时,基于模式模拟也对青藏高原地表气温在不同情景下的变化进行了大量研究[14-18].1995年发起的国际耦合模式比较计划(Coupled Model Intercomparison Project, CMIP)提供了历史时期以及不同碳排放情景下未来气候变化的模拟结果,这为全球气候变化研究提供了大量的基础数据[19-20].分析2012年发布的CMIP5模式数据发现,CMIP5模式对青藏高原地表气温的模拟存在不同程度的冷偏差,并且多模式集合平均的模拟效果要优于大多数单个模式[18,21-22];同时也对青藏高原未来的地表气温变化进行了预估[23-25],研究表明青藏高原区域平均地表气温在21世纪早期(2016—2035年)、中期(2046—2065年)和末期(2081—2100年)在典型浓度路径(representative concentration pathway, RCP)4.5情景下,相对于1986—2005年,将分别升高1.1 ℃、2.1 ℃和2.7 ℃.受复杂的升温机制影响,在全球平均温度较工业化前升温1.5 ℃和2 ℃的情况下,青藏高原受变暖影响的时间将比全球平均提早约10年,即高原升温幅度要大于全球平均水平[12]. ...
... [18,21-22];同时也对青藏高原未来的地表气温变化进行了预估[23-25],研究表明青藏高原区域平均地表气温在21世纪早期(2016—2035年)、中期(2046—2065年)和末期(2081—2100年)在典型浓度路径(representative concentration pathway, RCP)4.5情景下,相对于1986—2005年,将分别升高1.1 ℃、2.1 ℃和2.7 ℃.受复杂的升温机制影响,在全球平均温度较工业化前升温1.5 ℃和2 ℃的情况下,青藏高原受变暖影响的时间将比全球平均提早约10年,即高原升温幅度要大于全球平均水平[12]. ...
Progress on the projections of future climate change with various emission scenarios
1
2009
... 已有研究利用观测数据、再分析资料等从不同角度研究了青藏高原过去的地表气温变化[9-11],发现青藏高原不同区域、不同海拔的升温速率和升温幅度差异明显[12-13].同时,基于模式模拟也对青藏高原地表气温在不同情景下的变化进行了大量研究[14-18].1995年发起的国际耦合模式比较计划(Coupled Model Intercomparison Project, CMIP)提供了历史时期以及不同碳排放情景下未来气候变化的模拟结果,这为全球气候变化研究提供了大量的基础数据[19-20].分析2012年发布的CMIP5模式数据发现,CMIP5模式对青藏高原地表气温的模拟存在不同程度的冷偏差,并且多模式集合平均的模拟效果要优于大多数单个模式[18,21-22];同时也对青藏高原未来的地表气温变化进行了预估[23-25],研究表明青藏高原区域平均地表气温在21世纪早期(2016—2035年)、中期(2046—2065年)和末期(2081—2100年)在典型浓度路径(representative concentration pathway, RCP)4.5情景下,相对于1986—2005年,将分别升高1.1 ℃、2.1 ℃和2.7 ℃.受复杂的升温机制影响,在全球平均温度较工业化前升温1.5 ℃和2 ℃的情况下,青藏高原受变暖影响的时间将比全球平均提早约10年,即高原升温幅度要大于全球平均水平[12]. ...
未来不同排放情景下气候变化预估研究进展
1
2009
... 已有研究利用观测数据、再分析资料等从不同角度研究了青藏高原过去的地表气温变化[9-11],发现青藏高原不同区域、不同海拔的升温速率和升温幅度差异明显[12-13].同时,基于模式模拟也对青藏高原地表气温在不同情景下的变化进行了大量研究[14-18].1995年发起的国际耦合模式比较计划(Coupled Model Intercomparison Project, CMIP)提供了历史时期以及不同碳排放情景下未来气候变化的模拟结果,这为全球气候变化研究提供了大量的基础数据[19-20].分析2012年发布的CMIP5模式数据发现,CMIP5模式对青藏高原地表气温的模拟存在不同程度的冷偏差,并且多模式集合平均的模拟效果要优于大多数单个模式[18,21-22];同时也对青藏高原未来的地表气温变化进行了预估[23-25],研究表明青藏高原区域平均地表气温在21世纪早期(2016—2035年)、中期(2046—2065年)和末期(2081—2100年)在典型浓度路径(representative concentration pathway, RCP)4.5情景下,相对于1986—2005年,将分别升高1.1 ℃、2.1 ℃和2.7 ℃.受复杂的升温机制影响,在全球平均温度较工业化前升温1.5 ℃和2 ℃的情况下,青藏高原受变暖影响的时间将比全球平均提早约10年,即高原升温幅度要大于全球平均水平[12]. ...
Development of climate and earth system models in China: past achievements and new CMIP6 results
1
2020
... 已有研究利用观测数据、再分析资料等从不同角度研究了青藏高原过去的地表气温变化[9-11],发现青藏高原不同区域、不同海拔的升温速率和升温幅度差异明显[12-13].同时,基于模式模拟也对青藏高原地表气温在不同情景下的变化进行了大量研究[14-18].1995年发起的国际耦合模式比较计划(Coupled Model Intercomparison Project, CMIP)提供了历史时期以及不同碳排放情景下未来气候变化的模拟结果,这为全球气候变化研究提供了大量的基础数据[19-20].分析2012年发布的CMIP5模式数据发现,CMIP5模式对青藏高原地表气温的模拟存在不同程度的冷偏差,并且多模式集合平均的模拟效果要优于大多数单个模式[18,21-22];同时也对青藏高原未来的地表气温变化进行了预估[23-25],研究表明青藏高原区域平均地表气温在21世纪早期(2016—2035年)、中期(2046—2065年)和末期(2081—2100年)在典型浓度路径(representative concentration pathway, RCP)4.5情景下,相对于1986—2005年,将分别升高1.1 ℃、2.1 ℃和2.7 ℃.受复杂的升温机制影响,在全球平均温度较工业化前升温1.5 ℃和2 ℃的情况下,青藏高原受变暖影响的时间将比全球平均提早约10年,即高原升温幅度要大于全球平均水平[12]. ...
Evaluation of the global climate models in the CMIP5 over the Tibetan Plateau
1
2013
... 已有研究利用观测数据、再分析资料等从不同角度研究了青藏高原过去的地表气温变化[9-11],发现青藏高原不同区域、不同海拔的升温速率和升温幅度差异明显[12-13].同时,基于模式模拟也对青藏高原地表气温在不同情景下的变化进行了大量研究[14-18].1995年发起的国际耦合模式比较计划(Coupled Model Intercomparison Project, CMIP)提供了历史时期以及不同碳排放情景下未来气候变化的模拟结果,这为全球气候变化研究提供了大量的基础数据[19-20].分析2012年发布的CMIP5模式数据发现,CMIP5模式对青藏高原地表气温的模拟存在不同程度的冷偏差,并且多模式集合平均的模拟效果要优于大多数单个模式[18,21-22];同时也对青藏高原未来的地表气温变化进行了预估[23-25],研究表明青藏高原区域平均地表气温在21世纪早期(2016—2035年)、中期(2046—2065年)和末期(2081—2100年)在典型浓度路径(representative concentration pathway, RCP)4.5情景下,相对于1986—2005年,将分别升高1.1 ℃、2.1 ℃和2.7 ℃.受复杂的升温机制影响,在全球平均温度较工业化前升温1.5 ℃和2 ℃的情况下,青藏高原受变暖影响的时间将比全球平均提早约10年,即高原升温幅度要大于全球平均水平[12]. ...
Evaluation of CMIP5 models over the Qinghai-Tibetan Plateau
2
2014
... 已有研究利用观测数据、再分析资料等从不同角度研究了青藏高原过去的地表气温变化[9-11],发现青藏高原不同区域、不同海拔的升温速率和升温幅度差异明显[12-13].同时,基于模式模拟也对青藏高原地表气温在不同情景下的变化进行了大量研究[14-18].1995年发起的国际耦合模式比较计划(Coupled Model Intercomparison Project, CMIP)提供了历史时期以及不同碳排放情景下未来气候变化的模拟结果,这为全球气候变化研究提供了大量的基础数据[19-20].分析2012年发布的CMIP5模式数据发现,CMIP5模式对青藏高原地表气温的模拟存在不同程度的冷偏差,并且多模式集合平均的模拟效果要优于大多数单个模式[18,21-22];同时也对青藏高原未来的地表气温变化进行了预估[23-25],研究表明青藏高原区域平均地表气温在21世纪早期(2016—2035年)、中期(2046—2065年)和末期(2081—2100年)在典型浓度路径(representative concentration pathway, RCP)4.5情景下,相对于1986—2005年,将分别升高1.1 ℃、2.1 ℃和2.7 ℃.受复杂的升温机制影响,在全球平均温度较工业化前升温1.5 ℃和2 ℃的情况下,青藏高原受变暖影响的时间将比全球平均提早约10年,即高原升温幅度要大于全球平均水平[12]. ...
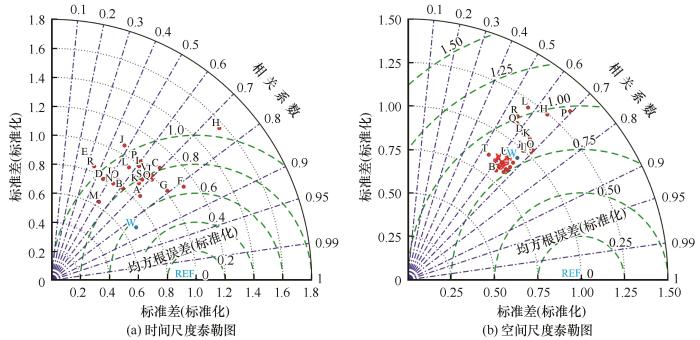
... 在对CMIP6模式模拟的青藏高原历史时期(1961—2014年)地表气温数据进行评估时,采用双线性插值法将各模式数据插值到气象站所在经纬度站点上,比较模式数据与观测数据,以评估其模拟能力.具体是在标准化的泰勒图[22,37]上,绘出模式模拟数据与观测数据在时间和空间尺度上的标准差、均方根误差和相关系数,以此直观反映模式对青藏高原历史时期年均地表气温时空变化的模拟能力. ...
CMIP5全球气候模式对青藏高原地区气候模拟能力评估
2
2014
... 已有研究利用观测数据、再分析资料等从不同角度研究了青藏高原过去的地表气温变化[9-11],发现青藏高原不同区域、不同海拔的升温速率和升温幅度差异明显[12-13].同时,基于模式模拟也对青藏高原地表气温在不同情景下的变化进行了大量研究[14-18].1995年发起的国际耦合模式比较计划(Coupled Model Intercomparison Project, CMIP)提供了历史时期以及不同碳排放情景下未来气候变化的模拟结果,这为全球气候变化研究提供了大量的基础数据[19-20].分析2012年发布的CMIP5模式数据发现,CMIP5模式对青藏高原地表气温的模拟存在不同程度的冷偏差,并且多模式集合平均的模拟效果要优于大多数单个模式[18,21-22];同时也对青藏高原未来的地表气温变化进行了预估[23-25],研究表明青藏高原区域平均地表气温在21世纪早期(2016—2035年)、中期(2046—2065年)和末期(2081—2100年)在典型浓度路径(representative concentration pathway, RCP)4.5情景下,相对于1986—2005年,将分别升高1.1 ℃、2.1 ℃和2.7 ℃.受复杂的升温机制影响,在全球平均温度较工业化前升温1.5 ℃和2 ℃的情况下,青藏高原受变暖影响的时间将比全球平均提早约10年,即高原升温幅度要大于全球平均水平[12]. ...
... 在对CMIP6模式模拟的青藏高原历史时期(1961—2014年)地表气温数据进行评估时,采用双线性插值法将各模式数据插值到气象站所在经纬度站点上,比较模式数据与观测数据,以评估其模拟能力.具体是在标准化的泰勒图[22,37]上,绘出模式模拟数据与观测数据在时间和空间尺度上的标准差、均方根误差和相关系数,以此直观反映模式对青藏高原历史时期年均地表气温时空变化的模拟能力. ...
Climate change projection on the Tibetan Plateau: results of CMIP5 models
2
2015
... 已有研究利用观测数据、再分析资料等从不同角度研究了青藏高原过去的地表气温变化[9-11],发现青藏高原不同区域、不同海拔的升温速率和升温幅度差异明显[12-13].同时,基于模式模拟也对青藏高原地表气温在不同情景下的变化进行了大量研究[14-18].1995年发起的国际耦合模式比较计划(Coupled Model Intercomparison Project, CMIP)提供了历史时期以及不同碳排放情景下未来气候变化的模拟结果,这为全球气候变化研究提供了大量的基础数据[19-20].分析2012年发布的CMIP5模式数据发现,CMIP5模式对青藏高原地表气温的模拟存在不同程度的冷偏差,并且多模式集合平均的模拟效果要优于大多数单个模式[18,21-22];同时也对青藏高原未来的地表气温变化进行了预估[23-25],研究表明青藏高原区域平均地表气温在21世纪早期(2016—2035年)、中期(2046—2065年)和末期(2081—2100年)在典型浓度路径(representative concentration pathway, RCP)4.5情景下,相对于1986—2005年,将分别升高1.1 ℃、2.1 ℃和2.7 ℃.受复杂的升温机制影响,在全球平均温度较工业化前升温1.5 ℃和2 ℃的情况下,青藏高原受变暖影响的时间将比全球平均提早约10年,即高原升温幅度要大于全球平均水平[12]. ...
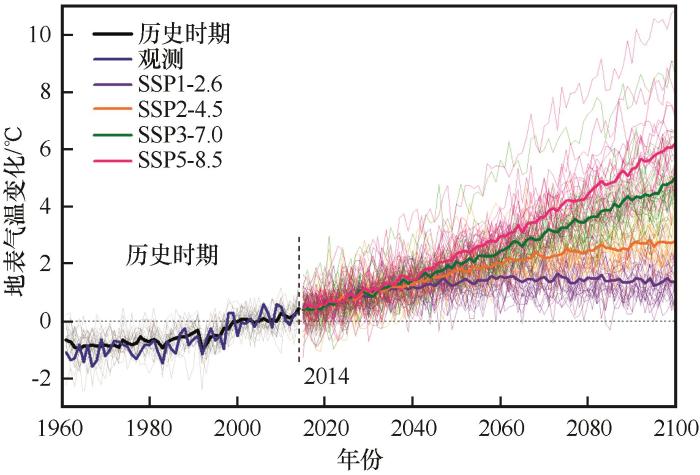
... CMIP6模拟的青藏高原未来地表气温变化空间特征,与CMIP5模拟结果相似[41].CMIP5模拟的青藏高原区域平均地表气温在RCP4.5情景下到21世纪中期和末期(相对于1986—2005年)将分别升温2.1 ℃(2046—2065年)和2.7 ℃(2081—2100年)[23].SSP2-4.5作为RCP4.5情景的延续,与此对应在SSP2-4.5情景下,相对于1986—2005年,到2046—2065年和2081—2100年间将分别升温2.25 ℃和3.02 ℃,分别比CMIP5在RCP4.5情景下的模拟结果高出约0.15 ℃和约0.32 ℃.说明CMIP6模式基于人为排放和土地利用变化基础上新的共享社会经济路径情景较CMIP5典型浓度路径情景,在分辨率提高、物理参数化方案改进后,尽管对青藏高原的气温模拟仍存在一定的偏差[27,34],但对青藏高原未来升温趋势的模拟更加精细,同时青藏高原在CMIP6情景较CMIP5情景的未来升温趋势将加大.目前本文还并未能从物理机制角度详细探究原因.另外,IPCC报告指出1986—2005年期间的全球平均温度比工业革命前(1850—1900年)已经高出约0.61 ℃[42],要想实现《巴黎协定》提出的与工业革命前相比将全球平均升温幅度控制在2 ℃以内,并争取限定在1.5 ℃以内[43]的目标,从目前到本世纪末只剩约1.39 ℃和约0.89 ℃的升温空间.从目前研究的升温趋势(图4)来看,CMIP6模拟的青藏高原地表气温在SSP1-2.6、SSP2-4.5、SSP3-7.0和SSP5-8.5情景下,相对于1986—2005年,在2041—2060年和2081—2100年两个时间段,将分别升高1.73 ℃、2.09 ℃、2.35 ℃、2.67 ℃和1.78 ℃、3.02 ℃、4.65 ℃、5.75 ℃,远超大约1.39 ℃和0.89 ℃升温空间.因此,无论在哪种情景下,到本世纪中期青藏高原温度都将较工业革命前超过2 ℃升温阈值,这对以冰冻圈为主要地貌特征的青藏高原而言,势必造成冰川的加速融化[44-45],以及更频繁的极端天气气候事件[46]. ...
青藏高原未来气候变化预估: CMIP5模式结果
2
2015
... 已有研究利用观测数据、再分析资料等从不同角度研究了青藏高原过去的地表气温变化[9-11],发现青藏高原不同区域、不同海拔的升温速率和升温幅度差异明显[12-13].同时,基于模式模拟也对青藏高原地表气温在不同情景下的变化进行了大量研究[14-18].1995年发起的国际耦合模式比较计划(Coupled Model Intercomparison Project, CMIP)提供了历史时期以及不同碳排放情景下未来气候变化的模拟结果,这为全球气候变化研究提供了大量的基础数据[19-20].分析2012年发布的CMIP5模式数据发现,CMIP5模式对青藏高原地表气温的模拟存在不同程度的冷偏差,并且多模式集合平均的模拟效果要优于大多数单个模式[18,21-22];同时也对青藏高原未来的地表气温变化进行了预估[23-25],研究表明青藏高原区域平均地表气温在21世纪早期(2016—2035年)、中期(2046—2065年)和末期(2081—2100年)在典型浓度路径(representative concentration pathway, RCP)4.5情景下,相对于1986—2005年,将分别升高1.1 ℃、2.1 ℃和2.7 ℃.受复杂的升温机制影响,在全球平均温度较工业化前升温1.5 ℃和2 ℃的情况下,青藏高原受变暖影响的时间将比全球平均提早约10年,即高原升温幅度要大于全球平均水平[12]. ...
... CMIP6模拟的青藏高原未来地表气温变化空间特征,与CMIP5模拟结果相似[41].CMIP5模拟的青藏高原区域平均地表气温在RCP4.5情景下到21世纪中期和末期(相对于1986—2005年)将分别升温2.1 ℃(2046—2065年)和2.7 ℃(2081—2100年)[23].SSP2-4.5作为RCP4.5情景的延续,与此对应在SSP2-4.5情景下,相对于1986—2005年,到2046—2065年和2081—2100年间将分别升温2.25 ℃和3.02 ℃,分别比CMIP5在RCP4.5情景下的模拟结果高出约0.15 ℃和约0.32 ℃.说明CMIP6模式基于人为排放和土地利用变化基础上新的共享社会经济路径情景较CMIP5典型浓度路径情景,在分辨率提高、物理参数化方案改进后,尽管对青藏高原的气温模拟仍存在一定的偏差[27,34],但对青藏高原未来升温趋势的模拟更加精细,同时青藏高原在CMIP6情景较CMIP5情景的未来升温趋势将加大.目前本文还并未能从物理机制角度详细探究原因.另外,IPCC报告指出1986—2005年期间的全球平均温度比工业革命前(1850—1900年)已经高出约0.61 ℃[42],要想实现《巴黎协定》提出的与工业革命前相比将全球平均升温幅度控制在2 ℃以内,并争取限定在1.5 ℃以内[43]的目标,从目前到本世纪末只剩约1.39 ℃和约0.89 ℃的升温空间.从目前研究的升温趋势(图4)来看,CMIP6模拟的青藏高原地表气温在SSP1-2.6、SSP2-4.5、SSP3-7.0和SSP5-8.5情景下,相对于1986—2005年,在2041—2060年和2081—2100年两个时间段,将分别升高1.73 ℃、2.09 ℃、2.35 ℃、2.67 ℃和1.78 ℃、3.02 ℃、4.65 ℃、5.75 ℃,远超大约1.39 ℃和0.89 ℃升温空间.因此,无论在哪种情景下,到本世纪中期青藏高原温度都将较工业革命前超过2 ℃升温阈值,这对以冰冻圈为主要地貌特征的青藏高原而言,势必造成冰川的加速融化[44-45],以及更频繁的极端天气气候事件[46]. ...
Double-nested dynamical downscaling experiments over the Tibetan Plateau and their projection of climate change under two RCPs scenarios
2013
The near-term, mid-term and long-term projections of temperature and precipitation changes over the Tibetan Plateau and the sources of uncertainties
1
2020
... 已有研究利用观测数据、再分析资料等从不同角度研究了青藏高原过去的地表气温变化[9-11],发现青藏高原不同区域、不同海拔的升温速率和升温幅度差异明显[12-13].同时,基于模式模拟也对青藏高原地表气温在不同情景下的变化进行了大量研究[14-18].1995年发起的国际耦合模式比较计划(Coupled Model Intercomparison Project, CMIP)提供了历史时期以及不同碳排放情景下未来气候变化的模拟结果,这为全球气候变化研究提供了大量的基础数据[19-20].分析2012年发布的CMIP5模式数据发现,CMIP5模式对青藏高原地表气温的模拟存在不同程度的冷偏差,并且多模式集合平均的模拟效果要优于大多数单个模式[18,21-22];同时也对青藏高原未来的地表气温变化进行了预估[23-25],研究表明青藏高原区域平均地表气温在21世纪早期(2016—2035年)、中期(2046—2065年)和末期(2081—2100年)在典型浓度路径(representative concentration pathway, RCP)4.5情景下,相对于1986—2005年,将分别升高1.1 ℃、2.1 ℃和2.7 ℃.受复杂的升温机制影响,在全球平均温度较工业化前升温1.5 ℃和2 ℃的情况下,青藏高原受变暖影响的时间将比全球平均提早约10年,即高原升温幅度要大于全球平均水平[12]. ...
青藏高原气温和降水近期、中期与长期变化的预估及其不确定性来源
1
2020
... 已有研究利用观测数据、再分析资料等从不同角度研究了青藏高原过去的地表气温变化[9-11],发现青藏高原不同区域、不同海拔的升温速率和升温幅度差异明显[12-13].同时,基于模式模拟也对青藏高原地表气温在不同情景下的变化进行了大量研究[14-18].1995年发起的国际耦合模式比较计划(Coupled Model Intercomparison Project, CMIP)提供了历史时期以及不同碳排放情景下未来气候变化的模拟结果,这为全球气候变化研究提供了大量的基础数据[19-20].分析2012年发布的CMIP5模式数据发现,CMIP5模式对青藏高原地表气温的模拟存在不同程度的冷偏差,并且多模式集合平均的模拟效果要优于大多数单个模式[18,21-22];同时也对青藏高原未来的地表气温变化进行了预估[23-25],研究表明青藏高原区域平均地表气温在21世纪早期(2016—2035年)、中期(2046—2065年)和末期(2081—2100年)在典型浓度路径(representative concentration pathway, RCP)4.5情景下,相对于1986—2005年,将分别升高1.1 ℃、2.1 ℃和2.7 ℃.受复杂的升温机制影响,在全球平均温度较工业化前升温1.5 ℃和2 ℃的情况下,青藏高原受变暖影响的时间将比全球平均提早约10年,即高原升温幅度要大于全球平均水平[12]. ...
Overview of the Coupled Model Intercomparison Project Phase
2
2019
... 相比于CMIP5,2019年发布的CMIP6模式模拟效果有了显著提高[26-28].CMIP6最大的特色在于其包含了23个由世界各国专家自行组织和设计的模式比较子计划(CMIP6-endorsed MIPs),其中情景模式比较计划(ScenarioMIP)是CMIP6最重要的子计划之一[29],该子计划延续了CMIP5的典型浓度路径(RCP)情景,在不同共享社会经济路径(shared socioeconomic pathway, SSP)可能发生的能源结构所产生的人为排放及土地利用变化的基础上,设计了不同SSP与辐射强迫组合的新情景预估试验,以此来预估在不同排放情景与不同政策措施控制下未来全球气候所发生的不同变化[26,30-32].因此,无论从模式的改进,还是对未来情景的设计上,CMIP6模拟结果更符合实际. ...
... [26,30-32].因此,无论从模式的改进,还是对未来情景的设计上,CMIP6模拟结果更符合实际. ...
第六次国际耦合模式比较计划(CMIP6)评述
2
2019
... 相比于CMIP5,2019年发布的CMIP6模式模拟效果有了显著提高[26-28].CMIP6最大的特色在于其包含了23个由世界各国专家自行组织和设计的模式比较子计划(CMIP6-endorsed MIPs),其中情景模式比较计划(ScenarioMIP)是CMIP6最重要的子计划之一[29],该子计划延续了CMIP5的典型浓度路径(RCP)情景,在不同共享社会经济路径(shared socioeconomic pathway, SSP)可能发生的能源结构所产生的人为排放及土地利用变化的基础上,设计了不同SSP与辐射强迫组合的新情景预估试验,以此来预估在不同排放情景与不同政策措施控制下未来全球气候所发生的不同变化[26,30-32].因此,无论从模式的改进,还是对未来情景的设计上,CMIP6模拟结果更符合实际. ...
... [26,30-32].因此,无论从模式的改进,还是对未来情景的设计上,CMIP6模拟结果更符合实际. ...
Evaluation of CMIP6 for historical temperature and precipitation over the Tibetan Plateau and its comparison with CMIP5
1
2020
... CMIP6模拟的青藏高原未来地表气温变化空间特征,与CMIP5模拟结果相似[41].CMIP5模拟的青藏高原区域平均地表气温在RCP4.5情景下到21世纪中期和末期(相对于1986—2005年)将分别升温2.1 ℃(2046—2065年)和2.7 ℃(2081—2100年)[23].SSP2-4.5作为RCP4.5情景的延续,与此对应在SSP2-4.5情景下,相对于1986—2005年,到2046—2065年和2081—2100年间将分别升温2.25 ℃和3.02 ℃,分别比CMIP5在RCP4.5情景下的模拟结果高出约0.15 ℃和约0.32 ℃.说明CMIP6模式基于人为排放和土地利用变化基础上新的共享社会经济路径情景较CMIP5典型浓度路径情景,在分辨率提高、物理参数化方案改进后,尽管对青藏高原的气温模拟仍存在一定的偏差[27,34],但对青藏高原未来升温趋势的模拟更加精细,同时青藏高原在CMIP6情景较CMIP5情景的未来升温趋势将加大.目前本文还并未能从物理机制角度详细探究原因.另外,IPCC报告指出1986—2005年期间的全球平均温度比工业革命前(1850—1900年)已经高出约0.61 ℃[42],要想实现《巴黎协定》提出的与工业革命前相比将全球平均升温幅度控制在2 ℃以内,并争取限定在1.5 ℃以内[43]的目标,从目前到本世纪末只剩约1.39 ℃和约0.89 ℃的升温空间.从目前研究的升温趋势(图4)来看,CMIP6模拟的青藏高原地表气温在SSP1-2.6、SSP2-4.5、SSP3-7.0和SSP5-8.5情景下,相对于1986—2005年,在2041—2060年和2081—2100年两个时间段,将分别升高1.73 ℃、2.09 ℃、2.35 ℃、2.67 ℃和1.78 ℃、3.02 ℃、4.65 ℃、5.75 ℃,远超大约1.39 ℃和0.89 ℃升温空间.因此,无论在哪种情景下,到本世纪中期青藏高原温度都将较工业革命前超过2 ℃升温阈值,这对以冰冻圈为主要地貌特征的青藏高原而言,势必造成冰川的加速融化[44-45],以及更频繁的极端天气气候事件[46]. ...
Differences between CMIP6 and CMIP5 models in simulating climate over China and the East Asian monsoon
1
2020
... 相比于CMIP5,2019年发布的CMIP6模式模拟效果有了显著提高[26-28].CMIP6最大的特色在于其包含了23个由世界各国专家自行组织和设计的模式比较子计划(CMIP6-endorsed MIPs),其中情景模式比较计划(ScenarioMIP)是CMIP6最重要的子计划之一[29],该子计划延续了CMIP5的典型浓度路径(RCP)情景,在不同共享社会经济路径(shared socioeconomic pathway, SSP)可能发生的能源结构所产生的人为排放及土地利用变化的基础上,设计了不同SSP与辐射强迫组合的新情景预估试验,以此来预估在不同排放情景与不同政策措施控制下未来全球气候所发生的不同变化[26,30-32].因此,无论从模式的改进,还是对未来情景的设计上,CMIP6模拟结果更符合实际. ...
The scenario model intercomparison project (ScenarioMIP) for CMIP6
3
2016
... 相比于CMIP5,2019年发布的CMIP6模式模拟效果有了显著提高[26-28].CMIP6最大的特色在于其包含了23个由世界各国专家自行组织和设计的模式比较子计划(CMIP6-endorsed MIPs),其中情景模式比较计划(ScenarioMIP)是CMIP6最重要的子计划之一[29],该子计划延续了CMIP5的典型浓度路径(RCP)情景,在不同共享社会经济路径(shared socioeconomic pathway, SSP)可能发生的能源结构所产生的人为排放及土地利用变化的基础上,设计了不同SSP与辐射强迫组合的新情景预估试验,以此来预估在不同排放情景与不同政策措施控制下未来全球气候所发生的不同变化[26,30-32].因此,无论从模式的改进,还是对未来情景的设计上,CMIP6模拟结果更符合实际. ...
... 本研究采用CMIP6中的22个地球/气候系统模式(表1,详见https://esgf-node.llnl.gov/projects/cmip6/)模拟的距离地面2 m的气温(near-surface air temperature, 简称地表气温)逐月数据,模式评估时间段为1961—2014年,未来模拟时间段为2015—2100年.未来时段的研究选取情景模式比较计划中的Tier-1核心试验,包括SSP1-2.6、SSP2-4.5、SSP3-7.0和SSP5-8.5四种不同的共享社会经济路径预估情景,不同情景代表着不同共享社会经济路径与不同辐射强迫的组合(表2)[29,35]. ...
... 情景模式比较计划中未来时段情景试验描述(据参考文献[29,35]修改) ...
Overview of the Coupled Model Intercomparison Project Phase 6 (CMIP6) experimental design and organization
1
2016
... 相比于CMIP5,2019年发布的CMIP6模式模拟效果有了显著提高[26-28].CMIP6最大的特色在于其包含了23个由世界各国专家自行组织和设计的模式比较子计划(CMIP6-endorsed MIPs),其中情景模式比较计划(ScenarioMIP)是CMIP6最重要的子计划之一[29],该子计划延续了CMIP5的典型浓度路径(RCP)情景,在不同共享社会经济路径(shared socioeconomic pathway, SSP)可能发生的能源结构所产生的人为排放及土地利用变化的基础上,设计了不同SSP与辐射强迫组合的新情景预估试验,以此来预估在不同排放情景与不同政策措施控制下未来全球气候所发生的不同变化[26,30-32].因此,无论从模式的改进,还是对未来情景的设计上,CMIP6模拟结果更符合实际. ...
The detection of the CMIP5 climate model to see the development of CMIP6 earth system models
2018
从检验CMIP5气候模式看CMIP6地球系统模式的发展
2018
Decadal climate prediction: scientific frontier and challenge
1
2017
... 相比于CMIP5,2019年发布的CMIP6模式模拟效果有了显著提高[26-28].CMIP6最大的特色在于其包含了23个由世界各国专家自行组织和设计的模式比较子计划(CMIP6-endorsed MIPs),其中情景模式比较计划(ScenarioMIP)是CMIP6最重要的子计划之一[29],该子计划延续了CMIP5的典型浓度路径(RCP)情景,在不同共享社会经济路径(shared socioeconomic pathway, SSP)可能发生的能源结构所产生的人为排放及土地利用变化的基础上,设计了不同SSP与辐射强迫组合的新情景预估试验,以此来预估在不同排放情景与不同政策措施控制下未来全球气候所发生的不同变化[26,30-32].因此,无论从模式的改进,还是对未来情景的设计上,CMIP6模拟结果更符合实际. ...
年代际气候预测问题: 科学前沿与挑战
1
2017
... 相比于CMIP5,2019年发布的CMIP6模式模拟效果有了显著提高[26-28].CMIP6最大的特色在于其包含了23个由世界各国专家自行组织和设计的模式比较子计划(CMIP6-endorsed MIPs),其中情景模式比较计划(ScenarioMIP)是CMIP6最重要的子计划之一[29],该子计划延续了CMIP5的典型浓度路径(RCP)情景,在不同共享社会经济路径(shared socioeconomic pathway, SSP)可能发生的能源结构所产生的人为排放及土地利用变化的基础上,设计了不同SSP与辐射强迫组合的新情景预估试验,以此来预估在不同排放情景与不同政策措施控制下未来全球气候所发生的不同变化[26,30-32].因此,无论从模式的改进,还是对未来情景的设计上,CMIP6模拟结果更符合实际. ...
Global land monsoon precipitation changes in CMIP6 projections
1
2020
... 目前利用CMIP6模式数据对青藏高原气候变化的相关研究还处于起步阶段[33-34],缺乏在不同SSP情景下CMIP6数据所表征的青藏高原未来地表气温时空变化的研究.为此,本文采用已发布的CMIP6情景模式比较计划中的22个地球/气候系统模式数据,首先对青藏高原历史时期(1961—2014年)年均地表气温变化的模拟效果进行评估,然后对整个青藏高原在21世纪中期(2041—2060年)和末期(2081—2100年)的升温速率和升温幅度进行预估,并研究其未来地表气温变化的空间规律,为制定减缓策略提供科学依据. ...
Does CMIP6 inspire more confidence in simulating climate extremes over China?
2
2020
... 目前利用CMIP6模式数据对青藏高原气候变化的相关研究还处于起步阶段[33-34],缺乏在不同SSP情景下CMIP6数据所表征的青藏高原未来地表气温时空变化的研究.为此,本文采用已发布的CMIP6情景模式比较计划中的22个地球/气候系统模式数据,首先对青藏高原历史时期(1961—2014年)年均地表气温变化的模拟效果进行评估,然后对整个青藏高原在21世纪中期(2041—2060年)和末期(2081—2100年)的升温速率和升温幅度进行预估,并研究其未来地表气温变化的空间规律,为制定减缓策略提供科学依据. ...
... CMIP6模拟的青藏高原未来地表气温变化空间特征,与CMIP5模拟结果相似[41].CMIP5模拟的青藏高原区域平均地表气温在RCP4.5情景下到21世纪中期和末期(相对于1986—2005年)将分别升温2.1 ℃(2046—2065年)和2.7 ℃(2081—2100年)[23].SSP2-4.5作为RCP4.5情景的延续,与此对应在SSP2-4.5情景下,相对于1986—2005年,到2046—2065年和2081—2100年间将分别升温2.25 ℃和3.02 ℃,分别比CMIP5在RCP4.5情景下的模拟结果高出约0.15 ℃和约0.32 ℃.说明CMIP6模式基于人为排放和土地利用变化基础上新的共享社会经济路径情景较CMIP5典型浓度路径情景,在分辨率提高、物理参数化方案改进后,尽管对青藏高原的气温模拟仍存在一定的偏差[27,34],但对青藏高原未来升温趋势的模拟更加精细,同时青藏高原在CMIP6情景较CMIP5情景的未来升温趋势将加大.目前本文还并未能从物理机制角度详细探究原因.另外,IPCC报告指出1986—2005年期间的全球平均温度比工业革命前(1850—1900年)已经高出约0.61 ℃[42],要想实现《巴黎协定》提出的与工业革命前相比将全球平均升温幅度控制在2 ℃以内,并争取限定在1.5 ℃以内[43]的目标,从目前到本世纪末只剩约1.39 ℃和约0.89 ℃的升温空间.从目前研究的升温趋势(图4)来看,CMIP6模拟的青藏高原地表气温在SSP1-2.6、SSP2-4.5、SSP3-7.0和SSP5-8.5情景下,相对于1986—2005年,在2041—2060年和2081—2100年两个时间段,将分别升高1.73 ℃、2.09 ℃、2.35 ℃、2.67 ℃和1.78 ℃、3.02 ℃、4.65 ℃、5.75 ℃,远超大约1.39 ℃和0.89 ℃升温空间.因此,无论在哪种情景下,到本世纪中期青藏高原温度都将较工业革命前超过2 ℃升温阈值,这对以冰冻圈为主要地貌特征的青藏高原而言,势必造成冰川的加速融化[44-45],以及更频繁的极端天气气候事件[46]. ...
Short commentary on CMIP6 Scenario Model Intercomparison Project (ScenarioMIP)
2
2019
... 本研究采用CMIP6中的22个地球/气候系统模式(表1,详见https://esgf-node.llnl.gov/projects/cmip6/)模拟的距离地面2 m的气温(near-surface air temperature, 简称地表气温)逐月数据,模式评估时间段为1961—2014年,未来模拟时间段为2015—2100年.未来时段的研究选取情景模式比较计划中的Tier-1核心试验,包括SSP1-2.6、SSP2-4.5、SSP3-7.0和SSP5-8.5四种不同的共享社会经济路径预估情景,不同情景代表着不同共享社会经济路径与不同辐射强迫的组合(表2)[29,35]. ...
... 情景模式比较计划中未来时段情景试验描述(据参考文献[29,35]修改) ...
CMIP6情景模式比较计划(ScenarioMIP)概况与评述
2
2019
... 本研究采用CMIP6中的22个地球/气候系统模式(表1,详见https://esgf-node.llnl.gov/projects/cmip6/)模拟的距离地面2 m的气温(near-surface air temperature, 简称地表气温)逐月数据,模式评估时间段为1961—2014年,未来模拟时间段为2015—2100年.未来时段的研究选取情景模式比较计划中的Tier-1核心试验,包括SSP1-2.6、SSP2-4.5、SSP3-7.0和SSP5-8.5四种不同的共享社会经济路径预估情景,不同情景代表着不同共享社会经济路径与不同辐射强迫的组合(表2)[29,35]. ...
... 情景模式比较计划中未来时段情景试验描述(据参考文献[29,35]修改) ...
A gridded daily observation dataset over China region and comparison with the other datasets
1
2013
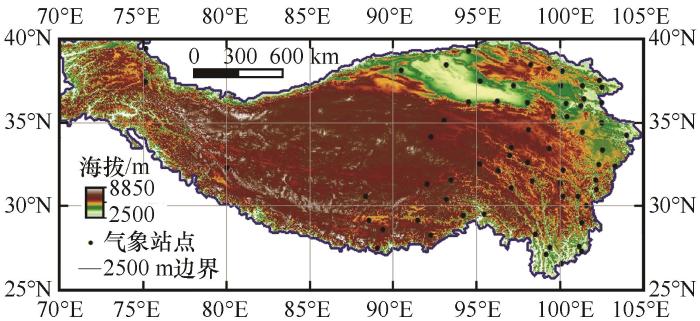
... 作为模式评估参考的观测数据,通过对比我国气象站点观测数据与地面气温月值0.5°×0.5°格点数据集(V2.0),对CMIP6模式数据的评估效果较为一致.另外,考虑到我国格点化气象数据集在青藏高原西部存在的较大不确定性[36],以及本文所选研究区范围超出了国界,因此,本研究采用国家气象信息中心提供的地面气候资料月值数据集(https://data.cma.cn/),从中选取青藏高原范围内1961—2014年数据完整的66个气象站月平均地表气温数据(以下简称观测数据),以此来评估CMIP6历史时期的模拟性能. ...
一套格点化的中国区域逐日观测资料及与其它资料的对比
1
2013
... 作为模式评估参考的观测数据,通过对比我国气象站点观测数据与地面气温月值0.5°×0.5°格点数据集(V2.0),对CMIP6模式数据的评估效果较为一致.另外,考虑到我国格点化气象数据集在青藏高原西部存在的较大不确定性[36],以及本文所选研究区范围超出了国界,因此,本研究采用国家气象信息中心提供的地面气候资料月值数据集(https://data.cma.cn/),从中选取青藏高原范围内1961—2014年数据完整的66个气象站月平均地表气温数据(以下简称观测数据),以此来评估CMIP6历史时期的模拟性能. ...
Taylor K E, Summarizing multiple aspects of model performance in a single diagram
1
2001
... 在对CMIP6模式模拟的青藏高原历史时期(1961—2014年)地表气温数据进行评估时,采用双线性插值法将各模式数据插值到气象站所在经纬度站点上,比较模式数据与观测数据,以评估其模拟能力.具体是在标准化的泰勒图[22,37]上,绘出模式模拟数据与观测数据在时间和空间尺度上的标准差、均方根误差和相关系数,以此直观反映模式对青藏高原历史时期年均地表气温时空变化的模拟能力. ...
Insights from CMIP6 for Australia’s future climate
1
2020
... 在对未来时段的研究中,由于不同模式分辨率不同,为了直观展现青藏高原地表气温的空间分布情况,同时为便于对各模式之间的相互比较,以及进行多模式集合平均,采用双线性插值法将各模式数据统一插值到0.5°×0.5°的经纬网格上,共计 1 214个格点.然后采用一元线性回归方法计算不同时段的空间升温趋势和升温幅度,并运用t检验法对升温趋势进行显著性检验.此外,为对比不同时段的变化幅度,综合青藏高原气候变化的特点,以及现有CMIP6的相关研究[38-39],本文选取1995—2014年作为参考时间段. ...
Future changes in precipitation over Central Asia based on CMIP6 projections
1
2020
... 在对未来时段的研究中,由于不同模式分辨率不同,为了直观展现青藏高原地表气温的空间分布情况,同时为便于对各模式之间的相互比较,以及进行多模式集合平均,采用双线性插值法将各模式数据统一插值到0.5°×0.5°的经纬网格上,共计 1 214个格点.然后采用一元线性回归方法计算不同时段的空间升温趋势和升温幅度,并运用t检验法对升温趋势进行显著性检验.此外,为对比不同时段的变化幅度,综合青藏高原气候变化的特点,以及现有CMIP6的相关研究[38-39],本文选取1995—2014年作为参考时间段. ...
Global warming of 1.5 ℃: an IPCC special report on the impacts of global warming of 1
1
2018
... 利用多模式集合平均模拟结果,分析了2015—2100年青藏高原年均地表气温的时空变化,得出在4种SSP情景下地表气温均呈增温趋势,且排放情景越高,增温幅度越大.由于各情景模拟的排放和辐射强迫不同,2015—2100年间青藏高原在不同情景下的线性增温趋势差异较大,在SSP1-2.6、SSP2-4.5、SSP3-7.0和SSP5-8.5情景下,增温趋势分别为0.10 ℃·(10a)-1、0.29 ℃·(10a)-1、0.53 ℃·(10a)-1和0.69 ℃·(10a)-1.除SSP1-2.6情景外,其余情景下青藏高原的升温速率均要高于IPCC全球升温1.5 ℃特别报告指出的全球目前近0.2 ℃每10年的升温幅度[40].相对于1995—2014年参考时段,到本世纪中期(2041—2060年),青藏高原区域年平均地表气温将分别增加1.37 ℃、1.72 ℃、1.98 ℃和2.30 ℃,而到本世纪末期(2081—2100年),平均气温将分别增加1.42 ℃、2.65 ℃、4.28 ℃和5.38 ℃.不同情景下高原增温趋势和增温幅度存在明显的差异,但帕米尔高原、藏北高原中西部和巴颜喀拉山区都为三个升温中心,且增温趋势最小的区域都集中于藏东南地区.目前认为出现三个升温中心的原因可能与复杂地形、海拔高度、冰雪覆盖率有关,另外巴颜喀拉山区出现升温中心可能还与人类活动影响有关,已有研究也表明高原西北部和南部高海拔地区增温明显[12,41].今后将对升温原因与机制进行详细探究. ...
Temperature change on the Tibetan Plateau under the global warming of 1.5 ℃ and 2 ℃
2
2019
... 利用多模式集合平均模拟结果,分析了2015—2100年青藏高原年均地表气温的时空变化,得出在4种SSP情景下地表气温均呈增温趋势,且排放情景越高,增温幅度越大.由于各情景模拟的排放和辐射强迫不同,2015—2100年间青藏高原在不同情景下的线性增温趋势差异较大,在SSP1-2.6、SSP2-4.5、SSP3-7.0和SSP5-8.5情景下,增温趋势分别为0.10 ℃·(10a)-1、0.29 ℃·(10a)-1、0.53 ℃·(10a)-1和0.69 ℃·(10a)-1.除SSP1-2.6情景外,其余情景下青藏高原的升温速率均要高于IPCC全球升温1.5 ℃特别报告指出的全球目前近0.2 ℃每10年的升温幅度[40].相对于1995—2014年参考时段,到本世纪中期(2041—2060年),青藏高原区域年平均地表气温将分别增加1.37 ℃、1.72 ℃、1.98 ℃和2.30 ℃,而到本世纪末期(2081—2100年),平均气温将分别增加1.42 ℃、2.65 ℃、4.28 ℃和5.38 ℃.不同情景下高原增温趋势和增温幅度存在明显的差异,但帕米尔高原、藏北高原中西部和巴颜喀拉山区都为三个升温中心,且增温趋势最小的区域都集中于藏东南地区.目前认为出现三个升温中心的原因可能与复杂地形、海拔高度、冰雪覆盖率有关,另外巴颜喀拉山区出现升温中心可能还与人类活动影响有关,已有研究也表明高原西北部和南部高海拔地区增温明显[12,41].今后将对升温原因与机制进行详细探究. ...
... CMIP6模拟的青藏高原未来地表气温变化空间特征,与CMIP5模拟结果相似[41].CMIP5模拟的青藏高原区域平均地表气温在RCP4.5情景下到21世纪中期和末期(相对于1986—2005年)将分别升温2.1 ℃(2046—2065年)和2.7 ℃(2081—2100年)[23].SSP2-4.5作为RCP4.5情景的延续,与此对应在SSP2-4.5情景下,相对于1986—2005年,到2046—2065年和2081—2100年间将分别升温2.25 ℃和3.02 ℃,分别比CMIP5在RCP4.5情景下的模拟结果高出约0.15 ℃和约0.32 ℃.说明CMIP6模式基于人为排放和土地利用变化基础上新的共享社会经济路径情景较CMIP5典型浓度路径情景,在分辨率提高、物理参数化方案改进后,尽管对青藏高原的气温模拟仍存在一定的偏差[27,34],但对青藏高原未来升温趋势的模拟更加精细,同时青藏高原在CMIP6情景较CMIP5情景的未来升温趋势将加大.目前本文还并未能从物理机制角度详细探究原因.另外,IPCC报告指出1986—2005年期间的全球平均温度比工业革命前(1850—1900年)已经高出约0.61 ℃[42],要想实现《巴黎协定》提出的与工业革命前相比将全球平均升温幅度控制在2 ℃以内,并争取限定在1.5 ℃以内[43]的目标,从目前到本世纪末只剩约1.39 ℃和约0.89 ℃的升温空间.从目前研究的升温趋势(图4)来看,CMIP6模拟的青藏高原地表气温在SSP1-2.6、SSP2-4.5、SSP3-7.0和SSP5-8.5情景下,相对于1986—2005年,在2041—2060年和2081—2100年两个时间段,将分别升高1.73 ℃、2.09 ℃、2.35 ℃、2.67 ℃和1.78 ℃、3.02 ℃、4.65 ℃、5.75 ℃,远超大约1.39 ℃和0.89 ℃升温空间.因此,无论在哪种情景下,到本世纪中期青藏高原温度都将较工业革命前超过2 ℃升温阈值,这对以冰冻圈为主要地貌特征的青藏高原而言,势必造成冰川的加速融化[44-45],以及更频繁的极端天气气候事件[46]. ...
全球变暖1.5 ℃和2 ℃阈值时青藏高原气温的变化特征
2
2019
... 利用多模式集合平均模拟结果,分析了2015—2100年青藏高原年均地表气温的时空变化,得出在4种SSP情景下地表气温均呈增温趋势,且排放情景越高,增温幅度越大.由于各情景模拟的排放和辐射强迫不同,2015—2100年间青藏高原在不同情景下的线性增温趋势差异较大,在SSP1-2.6、SSP2-4.5、SSP3-7.0和SSP5-8.5情景下,增温趋势分别为0.10 ℃·(10a)-1、0.29 ℃·(10a)-1、0.53 ℃·(10a)-1和0.69 ℃·(10a)-1.除SSP1-2.6情景外,其余情景下青藏高原的升温速率均要高于IPCC全球升温1.5 ℃特别报告指出的全球目前近0.2 ℃每10年的升温幅度[40].相对于1995—2014年参考时段,到本世纪中期(2041—2060年),青藏高原区域年平均地表气温将分别增加1.37 ℃、1.72 ℃、1.98 ℃和2.30 ℃,而到本世纪末期(2081—2100年),平均气温将分别增加1.42 ℃、2.65 ℃、4.28 ℃和5.38 ℃.不同情景下高原增温趋势和增温幅度存在明显的差异,但帕米尔高原、藏北高原中西部和巴颜喀拉山区都为三个升温中心,且增温趋势最小的区域都集中于藏东南地区.目前认为出现三个升温中心的原因可能与复杂地形、海拔高度、冰雪覆盖率有关,另外巴颜喀拉山区出现升温中心可能还与人类活动影响有关,已有研究也表明高原西北部和南部高海拔地区增温明显[12,41].今后将对升温原因与机制进行详细探究. ...
... CMIP6模拟的青藏高原未来地表气温变化空间特征,与CMIP5模拟结果相似[41].CMIP5模拟的青藏高原区域平均地表气温在RCP4.5情景下到21世纪中期和末期(相对于1986—2005年)将分别升温2.1 ℃(2046—2065年)和2.7 ℃(2081—2100年)[23].SSP2-4.5作为RCP4.5情景的延续,与此对应在SSP2-4.5情景下,相对于1986—2005年,到2046—2065年和2081—2100年间将分别升温2.25 ℃和3.02 ℃,分别比CMIP5在RCP4.5情景下的模拟结果高出约0.15 ℃和约0.32 ℃.说明CMIP6模式基于人为排放和土地利用变化基础上新的共享社会经济路径情景较CMIP5典型浓度路径情景,在分辨率提高、物理参数化方案改进后,尽管对青藏高原的气温模拟仍存在一定的偏差[27,34],但对青藏高原未来升温趋势的模拟更加精细,同时青藏高原在CMIP6情景较CMIP5情景的未来升温趋势将加大.目前本文还并未能从物理机制角度详细探究原因.另外,IPCC报告指出1986—2005年期间的全球平均温度比工业革命前(1850—1900年)已经高出约0.61 ℃[42],要想实现《巴黎协定》提出的与工业革命前相比将全球平均升温幅度控制在2 ℃以内,并争取限定在1.5 ℃以内[43]的目标,从目前到本世纪末只剩约1.39 ℃和约0.89 ℃的升温空间.从目前研究的升温趋势(图4)来看,CMIP6模拟的青藏高原地表气温在SSP1-2.6、SSP2-4.5、SSP3-7.0和SSP5-8.5情景下,相对于1986—2005年,在2041—2060年和2081—2100年两个时间段,将分别升高1.73 ℃、2.09 ℃、2.35 ℃、2.67 ℃和1.78 ℃、3.02 ℃、4.65 ℃、5.75 ℃,远超大约1.39 ℃和0.89 ℃升温空间.因此,无论在哪种情景下,到本世纪中期青藏高原温度都将较工业革命前超过2 ℃升温阈值,这对以冰冻圈为主要地貌特征的青藏高原而言,势必造成冰川的加速融化[44-45],以及更频繁的极端天气气候事件[46]. ...
1
2014
... CMIP6模拟的青藏高原未来地表气温变化空间特征,与CMIP5模拟结果相似[41].CMIP5模拟的青藏高原区域平均地表气温在RCP4.5情景下到21世纪中期和末期(相对于1986—2005年)将分别升温2.1 ℃(2046—2065年)和2.7 ℃(2081—2100年)[23].SSP2-4.5作为RCP4.5情景的延续,与此对应在SSP2-4.5情景下,相对于1986—2005年,到2046—2065年和2081—2100年间将分别升温2.25 ℃和3.02 ℃,分别比CMIP5在RCP4.5情景下的模拟结果高出约0.15 ℃和约0.32 ℃.说明CMIP6模式基于人为排放和土地利用变化基础上新的共享社会经济路径情景较CMIP5典型浓度路径情景,在分辨率提高、物理参数化方案改进后,尽管对青藏高原的气温模拟仍存在一定的偏差[27,34],但对青藏高原未来升温趋势的模拟更加精细,同时青藏高原在CMIP6情景较CMIP5情景的未来升温趋势将加大.目前本文还并未能从物理机制角度详细探究原因.另外,IPCC报告指出1986—2005年期间的全球平均温度比工业革命前(1850—1900年)已经高出约0.61 ℃[42],要想实现《巴黎协定》提出的与工业革命前相比将全球平均升温幅度控制在2 ℃以内,并争取限定在1.5 ℃以内[43]的目标,从目前到本世纪末只剩约1.39 ℃和约0.89 ℃的升温空间.从目前研究的升温趋势(图4)来看,CMIP6模拟的青藏高原地表气温在SSP1-2.6、SSP2-4.5、SSP3-7.0和SSP5-8.5情景下,相对于1986—2005年,在2041—2060年和2081—2100年两个时间段,将分别升高1.73 ℃、2.09 ℃、2.35 ℃、2.67 ℃和1.78 ℃、3.02 ℃、4.65 ℃、5.75 ℃,远超大约1.39 ℃和0.89 ℃升温空间.因此,无论在哪种情景下,到本世纪中期青藏高原温度都将较工业革命前超过2 ℃升温阈值,这对以冰冻圈为主要地貌特征的青藏高原而言,势必造成冰川的加速融化[44-45],以及更频繁的极端天气气候事件[46]. ...
Adoption of the Paris agreement: proposal by the president
1
2015
... CMIP6模拟的青藏高原未来地表气温变化空间特征,与CMIP5模拟结果相似[41].CMIP5模拟的青藏高原区域平均地表气温在RCP4.5情景下到21世纪中期和末期(相对于1986—2005年)将分别升温2.1 ℃(2046—2065年)和2.7 ℃(2081—2100年)[23].SSP2-4.5作为RCP4.5情景的延续,与此对应在SSP2-4.5情景下,相对于1986—2005年,到2046—2065年和2081—2100年间将分别升温2.25 ℃和3.02 ℃,分别比CMIP5在RCP4.5情景下的模拟结果高出约0.15 ℃和约0.32 ℃.说明CMIP6模式基于人为排放和土地利用变化基础上新的共享社会经济路径情景较CMIP5典型浓度路径情景,在分辨率提高、物理参数化方案改进后,尽管对青藏高原的气温模拟仍存在一定的偏差[27,34],但对青藏高原未来升温趋势的模拟更加精细,同时青藏高原在CMIP6情景较CMIP5情景的未来升温趋势将加大.目前本文还并未能从物理机制角度详细探究原因.另外,IPCC报告指出1986—2005年期间的全球平均温度比工业革命前(1850—1900年)已经高出约0.61 ℃[42],要想实现《巴黎协定》提出的与工业革命前相比将全球平均升温幅度控制在2 ℃以内,并争取限定在1.5 ℃以内[43]的目标,从目前到本世纪末只剩约1.39 ℃和约0.89 ℃的升温空间.从目前研究的升温趋势(图4)来看,CMIP6模拟的青藏高原地表气温在SSP1-2.6、SSP2-4.5、SSP3-7.0和SSP5-8.5情景下,相对于1986—2005年,在2041—2060年和2081—2100年两个时间段,将分别升高1.73 ℃、2.09 ℃、2.35 ℃、2.67 ℃和1.78 ℃、3.02 ℃、4.65 ℃、5.75 ℃,远超大约1.39 ℃和0.89 ℃升温空间.因此,无论在哪种情景下,到本世纪中期青藏高原温度都将较工业革命前超过2 ℃升温阈值,这对以冰冻圈为主要地貌特征的青藏高原而言,势必造成冰川的加速融化[44-45],以及更频繁的极端天气气候事件[46]. ...
The future changes of Chinese cryospheric hydrology and their impacts on water security in arid areas
1
2020
... CMIP6模拟的青藏高原未来地表气温变化空间特征,与CMIP5模拟结果相似[41].CMIP5模拟的青藏高原区域平均地表气温在RCP4.5情景下到21世纪中期和末期(相对于1986—2005年)将分别升温2.1 ℃(2046—2065年)和2.7 ℃(2081—2100年)[23].SSP2-4.5作为RCP4.5情景的延续,与此对应在SSP2-4.5情景下,相对于1986—2005年,到2046—2065年和2081—2100年间将分别升温2.25 ℃和3.02 ℃,分别比CMIP5在RCP4.5情景下的模拟结果高出约0.15 ℃和约0.32 ℃.说明CMIP6模式基于人为排放和土地利用变化基础上新的共享社会经济路径情景较CMIP5典型浓度路径情景,在分辨率提高、物理参数化方案改进后,尽管对青藏高原的气温模拟仍存在一定的偏差[27,34],但对青藏高原未来升温趋势的模拟更加精细,同时青藏高原在CMIP6情景较CMIP5情景的未来升温趋势将加大.目前本文还并未能从物理机制角度详细探究原因.另外,IPCC报告指出1986—2005年期间的全球平均温度比工业革命前(1850—1900年)已经高出约0.61 ℃[42],要想实现《巴黎协定》提出的与工业革命前相比将全球平均升温幅度控制在2 ℃以内,并争取限定在1.5 ℃以内[43]的目标,从目前到本世纪末只剩约1.39 ℃和约0.89 ℃的升温空间.从目前研究的升温趋势(图4)来看,CMIP6模拟的青藏高原地表气温在SSP1-2.6、SSP2-4.5、SSP3-7.0和SSP5-8.5情景下,相对于1986—2005年,在2041—2060年和2081—2100年两个时间段,将分别升高1.73 ℃、2.09 ℃、2.35 ℃、2.67 ℃和1.78 ℃、3.02 ℃、4.65 ℃、5.75 ℃,远超大约1.39 ℃和0.89 ℃升温空间.因此,无论在哪种情景下,到本世纪中期青藏高原温度都将较工业革命前超过2 ℃升温阈值,这对以冰冻圈为主要地貌特征的青藏高原而言,势必造成冰川的加速融化[44-45],以及更频繁的极端天气气候事件[46]. ...
中国冰冻圈水文未来变化及其对干旱区水安全的影响
1
2020
... CMIP6模拟的青藏高原未来地表气温变化空间特征,与CMIP5模拟结果相似[41].CMIP5模拟的青藏高原区域平均地表气温在RCP4.5情景下到21世纪中期和末期(相对于1986—2005年)将分别升温2.1 ℃(2046—2065年)和2.7 ℃(2081—2100年)[23].SSP2-4.5作为RCP4.5情景的延续,与此对应在SSP2-4.5情景下,相对于1986—2005年,到2046—2065年和2081—2100年间将分别升温2.25 ℃和3.02 ℃,分别比CMIP5在RCP4.5情景下的模拟结果高出约0.15 ℃和约0.32 ℃.说明CMIP6模式基于人为排放和土地利用变化基础上新的共享社会经济路径情景较CMIP5典型浓度路径情景,在分辨率提高、物理参数化方案改进后,尽管对青藏高原的气温模拟仍存在一定的偏差[27,34],但对青藏高原未来升温趋势的模拟更加精细,同时青藏高原在CMIP6情景较CMIP5情景的未来升温趋势将加大.目前本文还并未能从物理机制角度详细探究原因.另外,IPCC报告指出1986—2005年期间的全球平均温度比工业革命前(1850—1900年)已经高出约0.61 ℃[42],要想实现《巴黎协定》提出的与工业革命前相比将全球平均升温幅度控制在2 ℃以内,并争取限定在1.5 ℃以内[43]的目标,从目前到本世纪末只剩约1.39 ℃和约0.89 ℃的升温空间.从目前研究的升温趋势(图4)来看,CMIP6模拟的青藏高原地表气温在SSP1-2.6、SSP2-4.5、SSP3-7.0和SSP5-8.5情景下,相对于1986—2005年,在2041—2060年和2081—2100年两个时间段,将分别升高1.73 ℃、2.09 ℃、2.35 ℃、2.67 ℃和1.78 ℃、3.02 ℃、4.65 ℃、5.75 ℃,远超大约1.39 ℃和0.89 ℃升温空间.因此,无论在哪种情景下,到本世纪中期青藏高原温度都将较工业革命前超过2 ℃升温阈值,这对以冰冻圈为主要地貌特征的青藏高原而言,势必造成冰川的加速融化[44-45],以及更频繁的极端天气气候事件[46]. ...
Simulation and prediction of equilibrium line altitude of glaciers in the eastern Tibetan Plateau
1
2017
... CMIP6模拟的青藏高原未来地表气温变化空间特征,与CMIP5模拟结果相似[41].CMIP5模拟的青藏高原区域平均地表气温在RCP4.5情景下到21世纪中期和末期(相对于1986—2005年)将分别升温2.1 ℃(2046—2065年)和2.7 ℃(2081—2100年)[23].SSP2-4.5作为RCP4.5情景的延续,与此对应在SSP2-4.5情景下,相对于1986—2005年,到2046—2065年和2081—2100年间将分别升温2.25 ℃和3.02 ℃,分别比CMIP5在RCP4.5情景下的模拟结果高出约0.15 ℃和约0.32 ℃.说明CMIP6模式基于人为排放和土地利用变化基础上新的共享社会经济路径情景较CMIP5典型浓度路径情景,在分辨率提高、物理参数化方案改进后,尽管对青藏高原的气温模拟仍存在一定的偏差[27,34],但对青藏高原未来升温趋势的模拟更加精细,同时青藏高原在CMIP6情景较CMIP5情景的未来升温趋势将加大.目前本文还并未能从物理机制角度详细探究原因.另外,IPCC报告指出1986—2005年期间的全球平均温度比工业革命前(1850—1900年)已经高出约0.61 ℃[42],要想实现《巴黎协定》提出的与工业革命前相比将全球平均升温幅度控制在2 ℃以内,并争取限定在1.5 ℃以内[43]的目标,从目前到本世纪末只剩约1.39 ℃和约0.89 ℃的升温空间.从目前研究的升温趋势(图4)来看,CMIP6模拟的青藏高原地表气温在SSP1-2.6、SSP2-4.5、SSP3-7.0和SSP5-8.5情景下,相对于1986—2005年,在2041—2060年和2081—2100年两个时间段,将分别升高1.73 ℃、2.09 ℃、2.35 ℃、2.67 ℃和1.78 ℃、3.02 ℃、4.65 ℃、5.75 ℃,远超大约1.39 ℃和0.89 ℃升温空间.因此,无论在哪种情景下,到本世纪中期青藏高原温度都将较工业革命前超过2 ℃升温阈值,这对以冰冻圈为主要地貌特征的青藏高原而言,势必造成冰川的加速融化[44-45],以及更频繁的极端天气气候事件[46]. ...
青藏高原东部冰川平衡线高度的模拟及预测
1
2017
... CMIP6模拟的青藏高原未来地表气温变化空间特征,与CMIP5模拟结果相似[41].CMIP5模拟的青藏高原区域平均地表气温在RCP4.5情景下到21世纪中期和末期(相对于1986—2005年)将分别升温2.1 ℃(2046—2065年)和2.7 ℃(2081—2100年)[23].SSP2-4.5作为RCP4.5情景的延续,与此对应在SSP2-4.5情景下,相对于1986—2005年,到2046—2065年和2081—2100年间将分别升温2.25 ℃和3.02 ℃,分别比CMIP5在RCP4.5情景下的模拟结果高出约0.15 ℃和约0.32 ℃.说明CMIP6模式基于人为排放和土地利用变化基础上新的共享社会经济路径情景较CMIP5典型浓度路径情景,在分辨率提高、物理参数化方案改进后,尽管对青藏高原的气温模拟仍存在一定的偏差[27,34],但对青藏高原未来升温趋势的模拟更加精细,同时青藏高原在CMIP6情景较CMIP5情景的未来升温趋势将加大.目前本文还并未能从物理机制角度详细探究原因.另外,IPCC报告指出1986—2005年期间的全球平均温度比工业革命前(1850—1900年)已经高出约0.61 ℃[42],要想实现《巴黎协定》提出的与工业革命前相比将全球平均升温幅度控制在2 ℃以内,并争取限定在1.5 ℃以内[43]的目标,从目前到本世纪末只剩约1.39 ℃和约0.89 ℃的升温空间.从目前研究的升温趋势(图4)来看,CMIP6模拟的青藏高原地表气温在SSP1-2.6、SSP2-4.5、SSP3-7.0和SSP5-8.5情景下,相对于1986—2005年,在2041—2060年和2081—2100年两个时间段,将分别升高1.73 ℃、2.09 ℃、2.35 ℃、2.67 ℃和1.78 ℃、3.02 ℃、4.65 ℃、5.75 ℃,远超大约1.39 ℃和0.89 ℃升温空间.因此,无论在哪种情景下,到本世纪中期青藏高原温度都将较工业革命前超过2 ℃升温阈值,这对以冰冻圈为主要地貌特征的青藏高原而言,势必造成冰川的加速融化[44-45],以及更频繁的极端天气气候事件[46]. ...
Mean and extreme climate on the Qinghai-Tibetan Plateau with a 2 ℃ global warming
1
2015
... CMIP6模拟的青藏高原未来地表气温变化空间特征,与CMIP5模拟结果相似[41].CMIP5模拟的青藏高原区域平均地表气温在RCP4.5情景下到21世纪中期和末期(相对于1986—2005年)将分别升温2.1 ℃(2046—2065年)和2.7 ℃(2081—2100年)[23].SSP2-4.5作为RCP4.5情景的延续,与此对应在SSP2-4.5情景下,相对于1986—2005年,到2046—2065年和2081—2100年间将分别升温2.25 ℃和3.02 ℃,分别比CMIP5在RCP4.5情景下的模拟结果高出约0.15 ℃和约0.32 ℃.说明CMIP6模式基于人为排放和土地利用变化基础上新的共享社会经济路径情景较CMIP5典型浓度路径情景,在分辨率提高、物理参数化方案改进后,尽管对青藏高原的气温模拟仍存在一定的偏差[27,34],但对青藏高原未来升温趋势的模拟更加精细,同时青藏高原在CMIP6情景较CMIP5情景的未来升温趋势将加大.目前本文还并未能从物理机制角度详细探究原因.另外,IPCC报告指出1986—2005年期间的全球平均温度比工业革命前(1850—1900年)已经高出约0.61 ℃[42],要想实现《巴黎协定》提出的与工业革命前相比将全球平均升温幅度控制在2 ℃以内,并争取限定在1.5 ℃以内[43]的目标,从目前到本世纪末只剩约1.39 ℃和约0.89 ℃的升温空间.从目前研究的升温趋势(图4)来看,CMIP6模拟的青藏高原地表气温在SSP1-2.6、SSP2-4.5、SSP3-7.0和SSP5-8.5情景下,相对于1986—2005年,在2041—2060年和2081—2100年两个时间段,将分别升高1.73 ℃、2.09 ℃、2.35 ℃、2.67 ℃和1.78 ℃、3.02 ℃、4.65 ℃、5.75 ℃,远超大约1.39 ℃和0.89 ℃升温空间.因此,无论在哪种情景下,到本世纪中期青藏高原温度都将较工业革命前超过2 ℃升温阈值,这对以冰冻圈为主要地貌特征的青藏高原而言,势必造成冰川的加速融化[44-45],以及更频繁的极端天气气候事件[46]. ...
2 ℃全球变暖背景下青藏高原平均气候和极端气候事件变化
1
2015
... CMIP6模拟的青藏高原未来地表气温变化空间特征,与CMIP5模拟结果相似[41].CMIP5模拟的青藏高原区域平均地表气温在RCP4.5情景下到21世纪中期和末期(相对于1986—2005年)将分别升温2.1 ℃(2046—2065年)和2.7 ℃(2081—2100年)[23].SSP2-4.5作为RCP4.5情景的延续,与此对应在SSP2-4.5情景下,相对于1986—2005年,到2046—2065年和2081—2100年间将分别升温2.25 ℃和3.02 ℃,分别比CMIP5在RCP4.5情景下的模拟结果高出约0.15 ℃和约0.32 ℃.说明CMIP6模式基于人为排放和土地利用变化基础上新的共享社会经济路径情景较CMIP5典型浓度路径情景,在分辨率提高、物理参数化方案改进后,尽管对青藏高原的气温模拟仍存在一定的偏差[27,34],但对青藏高原未来升温趋势的模拟更加精细,同时青藏高原在CMIP6情景较CMIP5情景的未来升温趋势将加大.目前本文还并未能从物理机制角度详细探究原因.另外,IPCC报告指出1986—2005年期间的全球平均温度比工业革命前(1850—1900年)已经高出约0.61 ℃[42],要想实现《巴黎协定》提出的与工业革命前相比将全球平均升温幅度控制在2 ℃以内,并争取限定在1.5 ℃以内[43]的目标,从目前到本世纪末只剩约1.39 ℃和约0.89 ℃的升温空间.从目前研究的升温趋势(图4)来看,CMIP6模拟的青藏高原地表气温在SSP1-2.6、SSP2-4.5、SSP3-7.0和SSP5-8.5情景下,相对于1986—2005年,在2041—2060年和2081—2100年两个时间段,将分别升高1.73 ℃、2.09 ℃、2.35 ℃、2.67 ℃和1.78 ℃、3.02 ℃、4.65 ℃、5.75 ℃,远超大约1.39 ℃和0.89 ℃升温空间.因此,无论在哪种情景下,到本世纪中期青藏高原温度都将较工业革命前超过2 ℃升温阈值,这对以冰冻圈为主要地貌特征的青藏高原而言,势必造成冰川的加速融化[44-45],以及更频繁的极端天气气候事件[46]. ...


 甘公网安备 62010202000676号