2
2006
... 冰川对气候变化非常敏感[1],青藏高原是地球上除南北两极外冰川发育最广泛的区域[2].末次冰盛期(Last Glacial Maximum, LGM)发生在距今18~24 ka[3],期间全球大范围降温,两极以及山地冰川大规模扩张.根据古冰川作用形成的地貌能够定量重建古冰川的范围、冰储量和平衡线高度(equilibrium-line altitude, ELA)等参数.将其与现代冰川的相关参数进行对比,尤其是平衡线高度的变化,能够进一步应用冰川气候模型可以直接地定量地重建冰期时的气候条件,最终可以和湖泊孢粉记录等气候代用指标[4-11]以及大气环流模型[12-15]的结果互相对比验证.这也是研究冰期时古气候的一种重要思路,对了解高原上冰川-气候相互作用机制有重要的意义. ...
... 从10Be年龄来说,巴松措流域冰川约在19~20 ka达到现在湖出口的位置,而派山谷的冰碛10Be年代学结果显示冰川前进发生在末次冰盛期早期(~23 ka),恰好为古里雅冰芯连续记录显示的LGM最低温所出现的时段[53],两地区的气温和降水组合体现了青藏高原东南地区具体到LGM不同阶段的气候状况(图5~6).另外,张廉卿等[59]对念青唐古拉山西段冰川的研究发现平衡线高度变化主要受气候因素的影响,两地均在印度季风控制区,相对来说派山谷更靠近高原边缘,相比巴松措受到印度季风的影响更大,降水更加充沛,平衡线高度上升快.本研究的结果也支持了前人的工作,即从高原边缘到内部,从东南到西北LGM期间的逐渐减小[1].除气候因素外,两地冰川的范围以及冰底地形的复杂性都有很大不同,尤其是研究区位于东喜马拉雅构造结,地形复杂陡峻,这些因素也会对平衡线高度变化量造成一定的影响.总的来说,气温降低是该地区LGM时期ELA下降的主要原因,即在气候干燥(冰川积累量减少)的情况下,足够的低温增加了积累区面积并减少了冰川的消融[60],使冰川净积累增加,从而导致该时期冰川发生大规模冰进. ...
Different glacier status with atmospheric circulations in Tibetan Plateau and surroundings
1
2012
... 冰川对气候变化非常敏感[1],青藏高原是地球上除南北两极外冰川发育最广泛的区域[2].末次冰盛期(Last Glacial Maximum, LGM)发生在距今18~24 ka[3],期间全球大范围降温,两极以及山地冰川大规模扩张.根据古冰川作用形成的地貌能够定量重建古冰川的范围、冰储量和平衡线高度(equilibrium-line altitude, ELA)等参数.将其与现代冰川的相关参数进行对比,尤其是平衡线高度的变化,能够进一步应用冰川气候模型可以直接地定量地重建冰期时的气候条件,最终可以和湖泊孢粉记录等气候代用指标[4-11]以及大气环流模型[12-15]的结果互相对比验证.这也是研究冰期时古气候的一种重要思路,对了解高原上冰川-气候相互作用机制有重要的意义. ...
Environmental processes of the ice age: land, oceans, glaciers (EPILOG)
1
2001
... 冰川对气候变化非常敏感[1],青藏高原是地球上除南北两极外冰川发育最广泛的区域[2].末次冰盛期(Last Glacial Maximum, LGM)发生在距今18~24 ka[3],期间全球大范围降温,两极以及山地冰川大规模扩张.根据古冰川作用形成的地貌能够定量重建古冰川的范围、冰储量和平衡线高度(equilibrium-line altitude, ELA)等参数.将其与现代冰川的相关参数进行对比,尤其是平衡线高度的变化,能够进一步应用冰川气候模型可以直接地定量地重建冰期时的气候条件,最终可以和湖泊孢粉记录等气候代用指标[4-11]以及大气环流模型[12-15]的结果互相对比验证.这也是研究冰期时古气候的一种重要思路,对了解高原上冰川-气候相互作用机制有重要的意义. ...
A similar to 30,000-year record of environmental changes inferred from Lake Chen Co, Southern Tibet
1
2009
... 冰川对气候变化非常敏感[1],青藏高原是地球上除南北两极外冰川发育最广泛的区域[2].末次冰盛期(Last Glacial Maximum, LGM)发生在距今18~24 ka[3],期间全球大范围降温,两极以及山地冰川大规模扩张.根据古冰川作用形成的地貌能够定量重建古冰川的范围、冰储量和平衡线高度(equilibrium-line altitude, ELA)等参数.将其与现代冰川的相关参数进行对比,尤其是平衡线高度的变化,能够进一步应用冰川气候模型可以直接地定量地重建冰期时的气候条件,最终可以和湖泊孢粉记录等气候代用指标[4-11]以及大气环流模型[12-15]的结果互相对比验证.这也是研究冰期时古气候的一种重要思路,对了解高原上冰川-气候相互作用机制有重要的意义. ...
Interplay between the westerlies and Asian monsoon recorded in Lake Qinghai sediments since 32 ka
0
2012
Implications of diverse sedimentation patterns in Hala Lake, Qinghai Province, China for reconstructing Late Quaternary climate
0
2012
Paleoclimatic changes on the southern Tibetan Plateau over the past 19,000 years recorded in Lake Pumoyum Co, and their implications for the southwest monsoon evolution
0
2014
Climate change on the Tibetan Plateau in response to shifting atmospheric circulation since the LGM
0
2015
Lake Qinghai sediment geochemistry linked to hydroclimate variability since the last glacial
0
2015
Late glacial and Holocene vegetation and climate variations at Lake Tangra Yumco, central Tibetan Plateau
0
2019
Westerly jet stream controlled climate change mode since the Last Glacial Maximum in the northern Qinghai-Tibet Plateau
1
2020
... 冰川对气候变化非常敏感[1],青藏高原是地球上除南北两极外冰川发育最广泛的区域[2].末次冰盛期(Last Glacial Maximum, LGM)发生在距今18~24 ka[3],期间全球大范围降温,两极以及山地冰川大规模扩张.根据古冰川作用形成的地貌能够定量重建古冰川的范围、冰储量和平衡线高度(equilibrium-line altitude, ELA)等参数.将其与现代冰川的相关参数进行对比,尤其是平衡线高度的变化,能够进一步应用冰川气候模型可以直接地定量地重建冰期时的气候条件,最终可以和湖泊孢粉记录等气候代用指标[4-11]以及大气环流模型[12-15]的结果互相对比验证.这也是研究冰期时古气候的一种重要思路,对了解高原上冰川-气候相互作用机制有重要的意义. ...
Last glacial maximum climate over China from PMIP simulations
1
2011
... 冰川对气候变化非常敏感[1],青藏高原是地球上除南北两极外冰川发育最广泛的区域[2].末次冰盛期(Last Glacial Maximum, LGM)发生在距今18~24 ka[3],期间全球大范围降温,两极以及山地冰川大规模扩张.根据古冰川作用形成的地貌能够定量重建古冰川的范围、冰储量和平衡线高度(equilibrium-line altitude, ELA)等参数.将其与现代冰川的相关参数进行对比,尤其是平衡线高度的变化,能够进一步应用冰川气候模型可以直接地定量地重建冰期时的气候条件,最终可以和湖泊孢粉记录等气候代用指标[4-11]以及大气环流模型[12-15]的结果互相对比验证.这也是研究冰期时古气候的一种重要思路,对了解高原上冰川-气候相互作用机制有重要的意义. ...
Simulated impact of the Tibetan Glacier Expansion on the Eurasian Climate and Glacial Surface Mass Balance during the Last Glacial Maximum
0
2020
Seasonal variation of the Westerly Jet over Asia in the Last Glacial Maximum: role of the Tibetan Plateau heating
1
2021
... 以上通过LR和P-T模型计算得到了LGM时期两地可能的气候情景,这些气温和降水组合有助于评估其他气候代用指标的定量重建结果.由海登湖和仁错的高分辨率孢粉记录可知,青藏高原东南地区LGM期间与现在相比,7月气温降低了2~5 ℃,年降水量减少60%[54].25次古气候模拟比较计划(Paleoclimate Modelling Intercomparison Project, PMIP)的平均值显示LGM时期研究区年平均气温约比现代低4.0~4.5 ℃,年降水量相对现代减少约15%[14],本研究重建的LGM时期的气温与孢粉记录和PMIP模拟结果相差不大.Xu等[56]通过重建念青唐古拉山脉西段东南坡LGM时期的冰川规模,得到当时比现代气温低2.9~4.6 ℃.Chen等[57]计算得到青藏高原东南帕隆藏布流域五条冰川LGM时期的平均为917 m,并重建得到当时的夏季气温至少比现在低6.3 ℃.Zhou等[58]重建得到波堆藏布LGM时期的约为600 m,重建得到LGM时期气温比现在低6.6 ℃左右,这与本研究所重建的派山谷地区的和气温下降值很相似,但很明显,巴松措流域LGM时期的、气温变化相比以上偏小,这可能是因为重建的两个流域的冰川发生在LGM时期内不同的阶段,但整体来看,两地LGM气温下降值的重建结果均处于以往研究所重建得到的气温下降值的范围内. ...
Globally resolved surface temperatures since the Last Glacial Maximum
1
2021
... 冰川对气候变化非常敏感[1],青藏高原是地球上除南北两极外冰川发育最广泛的区域[2].末次冰盛期(Last Glacial Maximum, LGM)发生在距今18~24 ka[3],期间全球大范围降温,两极以及山地冰川大规模扩张.根据古冰川作用形成的地貌能够定量重建古冰川的范围、冰储量和平衡线高度(equilibrium-line altitude, ELA)等参数.将其与现代冰川的相关参数进行对比,尤其是平衡线高度的变化,能够进一步应用冰川气候模型可以直接地定量地重建冰期时的气候条件,最终可以和湖泊孢粉记录等气候代用指标[4-11]以及大气环流模型[12-15]的结果互相对比验证.这也是研究冰期时古气候的一种重要思路,对了解高原上冰川-气候相互作用机制有重要的意义. ...
Quick ice mass loss and abrupt retreat of the maritime glaciers in the Kangri Karpo Mountains, southeast Tibetan Plateau
1
2008
... 青藏高原东南部是高原上海洋型冰川发育最广泛的地区之一[16],主要受印度季风控制[17],是了解印度季风与冰川变化关系的关键区域.Hu等[18-19]通过10Be暴露测年方法测得了青藏高原东南地区巴松措流域与南迦巴瓦峰附近的派山谷冰川作用的时间.另外,在巴松措流域,Hu等[18]还应用光释光(OSL)测年技术测定了冰碛物的年代.其中,10Be暴露测年法所测得的是冰川形成该规模的最小年代,而OSL法测得的是冰碛物的沉积年代,Hu等[18]综合判定此次冰川作用发生在LGM时期,并根据侧碛-终碛等地貌大致限定了LGM冰川作用的范围,并估算了当时的ELA.由于大多情况下冰川地貌存在缺失或者后期地质改造而退化的情况[20],而冰川平衡剖面模型仅需要部分保存下来的地貌证据即可完成对古冰川规模的重建,因此最好将这些地貌、地形证据与数值模型方法相结合用于古冰川的重建工作[21].对于稳定态冰川的模拟,冰川纵剖面模型与高阶冰流模型运行结果极其相似[22],而且所需参数少且易于获得,运算简单快捷.因此,近年来冰川平衡纵剖面模型在对青藏高原范围内的古冰川重建方面受到了广泛的应用[23-32].本文将以前人的10Be测年结果为年代学基础,应用冰川平衡纵剖面模型结合有关地貌证据,定量重建这两条冰川在LGM时期的范围、冰储量和ELA等参数,由此进一步恢复该地区LGM时期的气候条件. ...
青藏高原东南部岗日嘎布地区冰川严重损耗与退缩
1
2008
... 青藏高原东南部是高原上海洋型冰川发育最广泛的地区之一[16],主要受印度季风控制[17],是了解印度季风与冰川变化关系的关键区域.Hu等[18-19]通过10Be暴露测年方法测得了青藏高原东南地区巴松措流域与南迦巴瓦峰附近的派山谷冰川作用的时间.另外,在巴松措流域,Hu等[18]还应用光释光(OSL)测年技术测定了冰碛物的年代.其中,10Be暴露测年法所测得的是冰川形成该规模的最小年代,而OSL法测得的是冰碛物的沉积年代,Hu等[18]综合判定此次冰川作用发生在LGM时期,并根据侧碛-终碛等地貌大致限定了LGM冰川作用的范围,并估算了当时的ELA.由于大多情况下冰川地貌存在缺失或者后期地质改造而退化的情况[20],而冰川平衡剖面模型仅需要部分保存下来的地貌证据即可完成对古冰川规模的重建,因此最好将这些地貌、地形证据与数值模型方法相结合用于古冰川的重建工作[21].对于稳定态冰川的模拟,冰川纵剖面模型与高阶冰流模型运行结果极其相似[22],而且所需参数少且易于获得,运算简单快捷.因此,近年来冰川平衡纵剖面模型在对青藏高原范围内的古冰川重建方面受到了广泛的应用[23-32].本文将以前人的10Be测年结果为年代学基础,应用冰川平衡纵剖面模型结合有关地貌证据,定量重建这两条冰川在LGM时期的范围、冰储量和ELA等参数,由此进一步恢复该地区LGM时期的气候条件. ...
Chained impacts on modern environment of interaction between Westerlies and Indian Monsoon on Tibetan Plateau
1
2017
... 青藏高原东南部是高原上海洋型冰川发育最广泛的地区之一[16],主要受印度季风控制[17],是了解印度季风与冰川变化关系的关键区域.Hu等[18-19]通过10Be暴露测年方法测得了青藏高原东南地区巴松措流域与南迦巴瓦峰附近的派山谷冰川作用的时间.另外,在巴松措流域,Hu等[18]还应用光释光(OSL)测年技术测定了冰碛物的年代.其中,10Be暴露测年法所测得的是冰川形成该规模的最小年代,而OSL法测得的是冰碛物的沉积年代,Hu等[18]综合判定此次冰川作用发生在LGM时期,并根据侧碛-终碛等地貌大致限定了LGM冰川作用的范围,并估算了当时的ELA.由于大多情况下冰川地貌存在缺失或者后期地质改造而退化的情况[20],而冰川平衡剖面模型仅需要部分保存下来的地貌证据即可完成对古冰川规模的重建,因此最好将这些地貌、地形证据与数值模型方法相结合用于古冰川的重建工作[21].对于稳定态冰川的模拟,冰川纵剖面模型与高阶冰流模型运行结果极其相似[22],而且所需参数少且易于获得,运算简单快捷.因此,近年来冰川平衡纵剖面模型在对青藏高原范围内的古冰川重建方面受到了广泛的应用[23-32].本文将以前人的10Be测年结果为年代学基础,应用冰川平衡纵剖面模型结合有关地貌证据,定量重建这两条冰川在LGM时期的范围、冰储量和ELA等参数,由此进一步恢复该地区LGM时期的气候条件. ...
印度季风与西风相互作用在现代青藏高原产生连锁式环境效应
1
2017
... 青藏高原东南部是高原上海洋型冰川发育最广泛的地区之一[16],主要受印度季风控制[17],是了解印度季风与冰川变化关系的关键区域.Hu等[18-19]通过10Be暴露测年方法测得了青藏高原东南地区巴松措流域与南迦巴瓦峰附近的派山谷冰川作用的时间.另外,在巴松措流域,Hu等[18]还应用光释光(OSL)测年技术测定了冰碛物的年代.其中,10Be暴露测年法所测得的是冰川形成该规模的最小年代,而OSL法测得的是冰碛物的沉积年代,Hu等[18]综合判定此次冰川作用发生在LGM时期,并根据侧碛-终碛等地貌大致限定了LGM冰川作用的范围,并估算了当时的ELA.由于大多情况下冰川地貌存在缺失或者后期地质改造而退化的情况[20],而冰川平衡剖面模型仅需要部分保存下来的地貌证据即可完成对古冰川规模的重建,因此最好将这些地貌、地形证据与数值模型方法相结合用于古冰川的重建工作[21].对于稳定态冰川的模拟,冰川纵剖面模型与高阶冰流模型运行结果极其相似[22],而且所需参数少且易于获得,运算简单快捷.因此,近年来冰川平衡纵剖面模型在对青藏高原范围内的古冰川重建方面受到了广泛的应用[23-32].本文将以前人的10Be测年结果为年代学基础,应用冰川平衡纵剖面模型结合有关地貌证据,定量重建这两条冰川在LGM时期的范围、冰储量和ELA等参数,由此进一步恢复该地区LGM时期的气候条件. ...
Extensive glacial advances during the Last Glacial Maximum near the eastern Himalayan syntaxis
9
2017
... 青藏高原东南部是高原上海洋型冰川发育最广泛的地区之一[16],主要受印度季风控制[17],是了解印度季风与冰川变化关系的关键区域.Hu等[18-19]通过10Be暴露测年方法测得了青藏高原东南地区巴松措流域与南迦巴瓦峰附近的派山谷冰川作用的时间.另外,在巴松措流域,Hu等[18]还应用光释光(OSL)测年技术测定了冰碛物的年代.其中,10Be暴露测年法所测得的是冰川形成该规模的最小年代,而OSL法测得的是冰碛物的沉积年代,Hu等[18]综合判定此次冰川作用发生在LGM时期,并根据侧碛-终碛等地貌大致限定了LGM冰川作用的范围,并估算了当时的ELA.由于大多情况下冰川地貌存在缺失或者后期地质改造而退化的情况[20],而冰川平衡剖面模型仅需要部分保存下来的地貌证据即可完成对古冰川规模的重建,因此最好将这些地貌、地形证据与数值模型方法相结合用于古冰川的重建工作[21].对于稳定态冰川的模拟,冰川纵剖面模型与高阶冰流模型运行结果极其相似[22],而且所需参数少且易于获得,运算简单快捷.因此,近年来冰川平衡纵剖面模型在对青藏高原范围内的古冰川重建方面受到了广泛的应用[23-32].本文将以前人的10Be测年结果为年代学基础,应用冰川平衡纵剖面模型结合有关地貌证据,定量重建这两条冰川在LGM时期的范围、冰储量和ELA等参数,由此进一步恢复该地区LGM时期的气候条件. ...
... [18]还应用光释光(OSL)测年技术测定了冰碛物的年代.其中,10Be暴露测年法所测得的是冰川形成该规模的最小年代,而OSL法测得的是冰碛物的沉积年代,Hu等[18]综合判定此次冰川作用发生在LGM时期,并根据侧碛-终碛等地貌大致限定了LGM冰川作用的范围,并估算了当时的ELA.由于大多情况下冰川地貌存在缺失或者后期地质改造而退化的情况[20],而冰川平衡剖面模型仅需要部分保存下来的地貌证据即可完成对古冰川规模的重建,因此最好将这些地貌、地形证据与数值模型方法相结合用于古冰川的重建工作[21].对于稳定态冰川的模拟,冰川纵剖面模型与高阶冰流模型运行结果极其相似[22],而且所需参数少且易于获得,运算简单快捷.因此,近年来冰川平衡纵剖面模型在对青藏高原范围内的古冰川重建方面受到了广泛的应用[23-32].本文将以前人的10Be测年结果为年代学基础,应用冰川平衡纵剖面模型结合有关地貌证据,定量重建这两条冰川在LGM时期的范围、冰储量和ELA等参数,由此进一步恢复该地区LGM时期的气候条件. ...
... [18]综合判定此次冰川作用发生在LGM时期,并根据侧碛-终碛等地貌大致限定了LGM冰川作用的范围,并估算了当时的ELA.由于大多情况下冰川地貌存在缺失或者后期地质改造而退化的情况[20],而冰川平衡剖面模型仅需要部分保存下来的地貌证据即可完成对古冰川规模的重建,因此最好将这些地貌、地形证据与数值模型方法相结合用于古冰川的重建工作[21].对于稳定态冰川的模拟,冰川纵剖面模型与高阶冰流模型运行结果极其相似[22],而且所需参数少且易于获得,运算简单快捷.因此,近年来冰川平衡纵剖面模型在对青藏高原范围内的古冰川重建方面受到了广泛的应用[23-32].本文将以前人的10Be测年结果为年代学基础,应用冰川平衡纵剖面模型结合有关地貌证据,定量重建这两条冰川在LGM时期的范围、冰储量和ELA等参数,由此进一步恢复该地区LGM时期的气候条件. ...
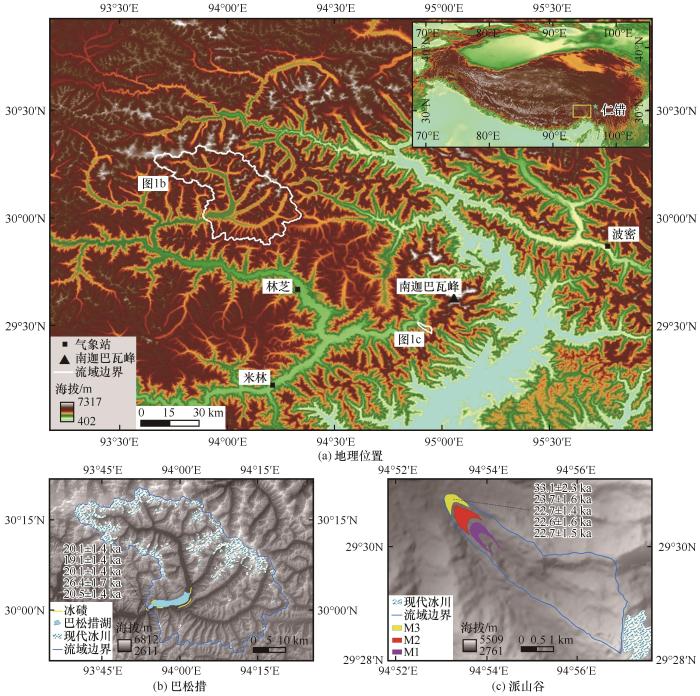
... 巴松措流域位于念青唐古拉山脉东段与喜马拉雅山脉交界处的南坡,南迦巴瓦峰西北方向约115 km处.根据GLIMS(Global Land Ice Measurements from Space)数据,该流域现代冰川覆盖范围约220.2 km2,其中冰川面积大于0.5 km2的有82条.巴松措湖沿岸有一组侧碛和终碛存在,也是该流域最外围的冰碛,代表了该流域最广泛的冰川活动.侧碛在湖的南岸保存较好,长19 km,北岸侧碛只有约2.4 km,与侧碛构成一体的终碛位于湖的出口处,由几组冰碛丘陵组成,表明冰川在该阶段到达巴松措现在的出口位置,距离主要支流(中措、白兰沟、新措)现代冰川末端分别为~33、~36和~48 km,其上分布有花岗岩漂砾.为了约束该次冰期的数值年代,Hu等[18]在最外围的丘状终碛顶部采集了5个漂砾样品,使用宇宙成因核素10Be暴露测年法测得了其暴露年龄,为了方便统一比较,本研究利用CRONUS-Earth 3.0计算程序(http://hess.ess.washington.edu),Lal(1991)/Stone(2000)生产率随时间变化的模型[33-34]重新计算了该组冰碛的10Be暴露年龄:(20.1±1.4) ka、(19.1±1.4) ka、(20.1±1.4) ka、(26.4±1.7) ka和(20.5±1.4) ka(表1);另外,Hu等[18]对南北两岸的侧碛采集的23个沉积样品开展了光释光测年,结果显示冰进最大规模在16~30 ka之间,综合判定这组终碛-侧碛垄形成的年代是LGM时期. ...
... [18]对南北两岸的侧碛采集的23个沉积样品开展了光释光测年,结果显示冰进最大规模在16~30 ka之间,综合判定这组终碛-侧碛垄形成的年代是LGM时期. ...
... 通过使用AAR和AABR两种方法计算两地在末次冰盛期时的冰川平衡线高度(表4),可以看出对于两个流域来说AABR法得出的ELA值不确定范围更小,而且两种方法计算得到的ELA相差很小,而本研究后期对于气候的模拟主要输入的是ELA的值,因此本研究选择AABR法得到的ELA值代入模型进行温度和降水条件的计算.为了尽量减小系统误差,现代ELA也将冰面DEM输入模型进行计算,其中得到巴松措流域和派山谷的ELA分别为535 m和1 059 m.其中由于谷源部分地形陡峭,派山谷内已无现代冰川发育,仅有少量季节性积雪,因此其现代ELA是通过输入相邻冰川表面计算得到的.本研究重建得到的巴松措地区的ELA与Hu等[18]的估算结果小约155 m,由于本研究和Hu等[18]对于巴松措流域范围的划定有一定差别,可能是造成该差异的原因.而本文对派山谷地区ELA重建结果比Hu等[18]的估算结果大150 m左右,除了底碛的影响外,对于ELA计算方法的不同以及现代冰川ELA的确定也可能是造成该差异的原因. ...
... [18]对于巴松措流域范围的划定有一定差别,可能是造成该差异的原因.而本文对派山谷地区ELA重建结果比Hu等[18]的估算结果大150 m左右,除了底碛的影响外,对于ELA计算方法的不同以及现代冰川ELA的确定也可能是造成该差异的原因. ...
... [18]的估算结果大150 m左右,除了底碛的影响外,对于ELA计算方法的不同以及现代冰川ELA的确定也可能是造成该差异的原因. ...
... ELA reconstruction during LGM in the study area
Table 4| 冰川流域 | AAR法 | AABR法 | 现代ELA | ELA | 误差b | ELA(Hu等[18-19]) |
|---|
| 巴松措流域 | 4 447~4 597 | 4 472~4 497 | 5 007~5 032 | 535 | ±12.5 | 690 |
| 派山谷 | 3 519~3 719 | 3 619~3 669 | 4 703a | 1 059 | ±25 | 895 |
注:a.派山谷已无现代冰川发育,这里选择邻近冰川计算ELA;b.此误差为“GlaRe”的系统误差. ...
Glacial advances and stability of the moraine dam on Mount Namcha Barwa since the Last Glacial Maximum, eastern Himalayan syntaxis
4
2020
... 青藏高原东南部是高原上海洋型冰川发育最广泛的地区之一[16],主要受印度季风控制[17],是了解印度季风与冰川变化关系的关键区域.Hu等[18-19]通过10Be暴露测年方法测得了青藏高原东南地区巴松措流域与南迦巴瓦峰附近的派山谷冰川作用的时间.另外,在巴松措流域,Hu等[18]还应用光释光(OSL)测年技术测定了冰碛物的年代.其中,10Be暴露测年法所测得的是冰川形成该规模的最小年代,而OSL法测得的是冰碛物的沉积年代,Hu等[18]综合判定此次冰川作用发生在LGM时期,并根据侧碛-终碛等地貌大致限定了LGM冰川作用的范围,并估算了当时的ELA.由于大多情况下冰川地貌存在缺失或者后期地质改造而退化的情况[20],而冰川平衡剖面模型仅需要部分保存下来的地貌证据即可完成对古冰川规模的重建,因此最好将这些地貌、地形证据与数值模型方法相结合用于古冰川的重建工作[21].对于稳定态冰川的模拟,冰川纵剖面模型与高阶冰流模型运行结果极其相似[22],而且所需参数少且易于获得,运算简单快捷.因此,近年来冰川平衡纵剖面模型在对青藏高原范围内的古冰川重建方面受到了广泛的应用[23-32].本文将以前人的10Be测年结果为年代学基础,应用冰川平衡纵剖面模型结合有关地貌证据,定量重建这两条冰川在LGM时期的范围、冰储量和ELA等参数,由此进一步恢复该地区LGM时期的气候条件. ...
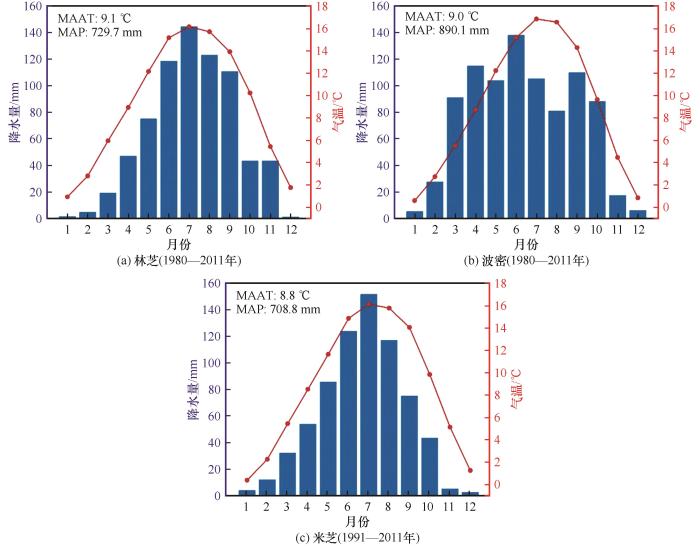
... 青藏高原东南部北接念青唐古拉山脉,西接喜马拉雅山脉,东接横断山脉,最高峰为南迦巴瓦峰,海拔高度为7 782 m(图1).通过国家气象科学数据中心(http://data.cma.cn/)获得的距离研究区最近的林芝(海拔2 993.0 m)、波密(海拔2 737.2 m)、米林(海拔2 951.2 m)3个气象站的气象观测记录,记录显示年平均气温(MAAT)分别为9.1 ℃、9.0 ℃和8.8 ℃,平均年降水量分别为729.7 mm、890.1 mm和708.8 mm,降水主要集中在每年的4月到9月,约占总降水量的73.4%~85.8%(图2),印度季风是该地区主要的水汽来源[19]. ...
... 派山谷发源于南迦巴瓦峰西坡,呈NW走向,山谷内分布有三组冰碛,最外层终碛位于该谷出口,末端海拔约2 970 m,距离现代冰川约7.1 km,表面较平坦,顶部有大量花岗岩漂砾,Hu等[19]采集了5块花岗岩漂砾样品,进行10Be暴露测年法测年,重新计算后结果分别为(33.1±2.3) ka、(23.7±1.6) ka、(22.7±1.4) ka、(22.6±1.6) ka和(22.7±1.5) ka(表1),经过Peirce 检验后,33.1 ka被认为是异常值而剔除,判定此次冰进发生在距今~23 ka,即LGM时期. ...
... ELA reconstruction during LGM in the study area
Table 4| 冰川流域 | AAR法 | AABR法 | 现代ELA | ELA | 误差b | ELA(Hu等[18-19]) |
|---|
| 巴松措流域 | 4 447~4 597 | 4 472~4 497 | 5 007~5 032 | 535 | ±12.5 | 690 |
| 派山谷 | 3 519~3 719 | 3 619~3 669 | 4 703a | 1 059 | ±25 | 895 |
注:a.派山谷已无现代冰川发育,这里选择邻近冰川计算ELA;b.此误差为“GlaRe”的系统误差. ...
A Devensian medial moraine in Jura
1
1979
... 青藏高原东南部是高原上海洋型冰川发育最广泛的地区之一[16],主要受印度季风控制[17],是了解印度季风与冰川变化关系的关键区域.Hu等[18-19]通过10Be暴露测年方法测得了青藏高原东南地区巴松措流域与南迦巴瓦峰附近的派山谷冰川作用的时间.另外,在巴松措流域,Hu等[18]还应用光释光(OSL)测年技术测定了冰碛物的年代.其中,10Be暴露测年法所测得的是冰川形成该规模的最小年代,而OSL法测得的是冰碛物的沉积年代,Hu等[18]综合判定此次冰川作用发生在LGM时期,并根据侧碛-终碛等地貌大致限定了LGM冰川作用的范围,并估算了当时的ELA.由于大多情况下冰川地貌存在缺失或者后期地质改造而退化的情况[20],而冰川平衡剖面模型仅需要部分保存下来的地貌证据即可完成对古冰川规模的重建,因此最好将这些地貌、地形证据与数值模型方法相结合用于古冰川的重建工作[21].对于稳定态冰川的模拟,冰川纵剖面模型与高阶冰流模型运行结果极其相似[22],而且所需参数少且易于获得,运算简单快捷.因此,近年来冰川平衡纵剖面模型在对青藏高原范围内的古冰川重建方面受到了广泛的应用[23-32].本文将以前人的10Be测年结果为年代学基础,应用冰川平衡纵剖面模型结合有关地貌证据,定量重建这两条冰川在LGM时期的范围、冰储量和ELA等参数,由此进一步恢复该地区LGM时期的气候条件. ...
GlaRe, a GIS tool to reconstruct the 3D surface of palaeoglaciers
4
2016
... 青藏高原东南部是高原上海洋型冰川发育最广泛的地区之一[16],主要受印度季风控制[17],是了解印度季风与冰川变化关系的关键区域.Hu等[18-19]通过10Be暴露测年方法测得了青藏高原东南地区巴松措流域与南迦巴瓦峰附近的派山谷冰川作用的时间.另外,在巴松措流域,Hu等[18]还应用光释光(OSL)测年技术测定了冰碛物的年代.其中,10Be暴露测年法所测得的是冰川形成该规模的最小年代,而OSL法测得的是冰碛物的沉积年代,Hu等[18]综合判定此次冰川作用发生在LGM时期,并根据侧碛-终碛等地貌大致限定了LGM冰川作用的范围,并估算了当时的ELA.由于大多情况下冰川地貌存在缺失或者后期地质改造而退化的情况[20],而冰川平衡剖面模型仅需要部分保存下来的地貌证据即可完成对古冰川规模的重建,因此最好将这些地貌、地形证据与数值模型方法相结合用于古冰川的重建工作[21].对于稳定态冰川的模拟,冰川纵剖面模型与高阶冰流模型运行结果极其相似[22],而且所需参数少且易于获得,运算简单快捷.因此,近年来冰川平衡纵剖面模型在对青藏高原范围内的古冰川重建方面受到了广泛的应用[23-32].本文将以前人的10Be测年结果为年代学基础,应用冰川平衡纵剖面模型结合有关地貌证据,定量重建这两条冰川在LGM时期的范围、冰储量和ELA等参数,由此进一步恢复该地区LGM时期的气候条件. ...
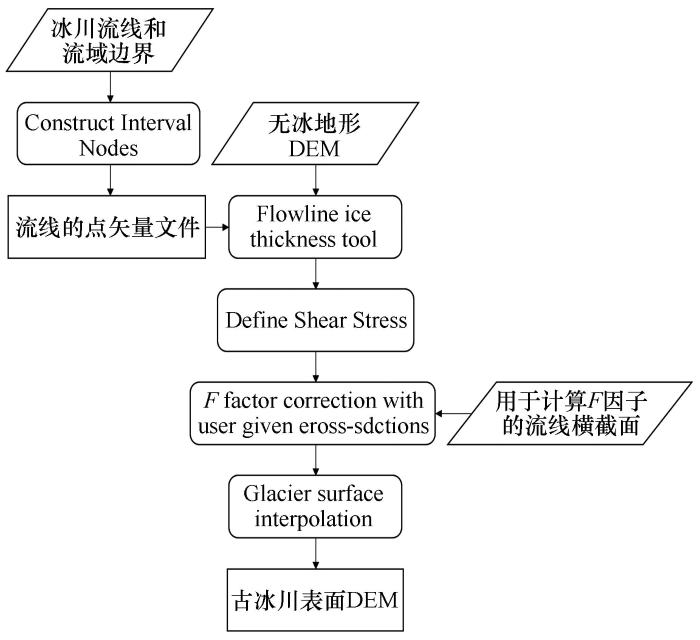
... 应用以上原理,“GlaRe”工具是在ArcGIS中使用的用Python编写的程序,根据有限的地貌信息,就可以快速实现上述方程的运算,生成古冰川3D表面[21].模型至少需输入的参数有:冰底地形DEM、冰川流线矢量文件.具体操作步骤如下(图3): ...
... Pellitero等[21]对GlaRe模块进行了测试,结果显示对冰川储量、表面积和ELA的重建误差分别在25%、20%和75 m以内,考虑F因子后误差显著降低,分别降至10%、6%和10~15 m以内. ...
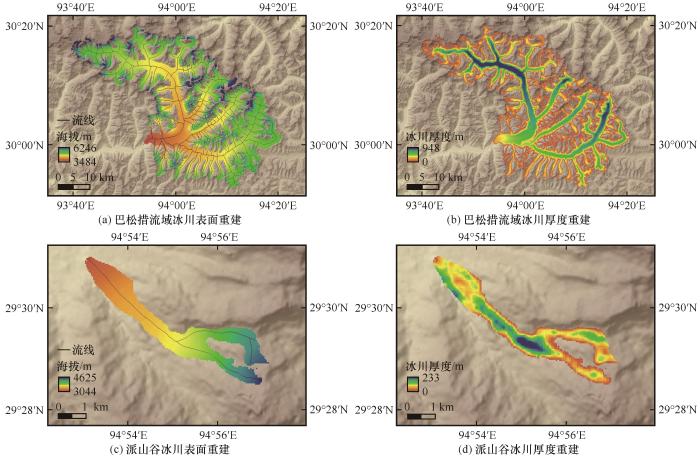
... 根据冰川地貌学证据,本文应用“GlaRe”模块模拟得到了LGM时期巴松措流域与南迦巴瓦峰附近的派山谷冰川规模的各项参数.Pellitero等[21]通过对现代冰川的重建进行模型验证,对比发现用Topo to Raster插值法和克里金插值法及IDW插值法对冰储量和冰川面积的模拟结果相差不大,且对于后期ELA的计算来说Topo to raster法相对更优秀;并且本研究通过实验发现,Topo to raster插值方法得到的冰川表面更加符合冰川的实际形态,因此此次重建均使用该方法进行插值.根据文献[49],大多选择100 kPa的基底剪应力,如此重建得到的巴松措流域的冰川冰储量达到了274.4 km3,面积达982.3 km2,约是现代冰川的4.5倍;派山谷在LGM时期冰储量达0.51 km3,面积达5.76 km2.而一般冰川的基底剪应力在50~150 kPa之间[49],考虑到冰底地形的起伏会导致基底剪应力变化,本研究分别选取75 kPa、100 kPa和125 kPa的基底剪应力,重建出两研究区末次冰盛期期间的冰川表面(表2~3).在巴松措流域,增加或减少25 kPa的基底剪应力重建得到的末次冰盛期时的冰储量与100 kPa相比,得到的冰储量结果相差大概在30%以内,冰川面积的差值在15%以内.统一使用AABR法进行ELA的计算,得到75 kPa和125 kPa与100 kPa基底剪应力得到的ELA值分别为4 388~4 413 m、4 472~4 497 m和4 580~4 605 m,可以看出差异在84~108 m.派山谷冰川在末次冰盛期时,在100 kPa的基础上上下变化25 kPa,造成的重建得到的冰储量差异也在30%以内,冰川面积的差异在13%以内,AABR计算得到的三种基底剪应力对应的ELA分别为3 566~3 616 m、3 619~3 669 m、3 672~3 722 m,依次相差53 m.可以看出,对巴松措这种复杂的大流域冰川的重建,整体来说基底剪应力的差异会导致重建所得的较大的ELA值差异.由于巴松措湖(最大水深约120 m[51])和派山谷底碛的影响,重建时所输入的冰底地形在靠近冰川末端处会比LGM时期真实的冰底地形偏高,相应地会导致重建出的冰川在冰舌处厚度偏小.另外,Finlayson[52]评估了冰流模型在不同底碛及冰川消退后地形改变情形下对冰川厚度重建结果的影响,认为底碛及冰川消退后地形改变对该方法重建的古冰川表面高程整体上有不到1%的影响.将AAR和AABR法计算得到的ELA值取平均,得到LGM时期巴松措流域冰川和派山谷冰川的ELA分别为4 460~4 547 m和3 569~3 694 m. ...
On estimating length fluctuations of glaciers caused by changes in climatic forcing
1
2004
... 青藏高原东南部是高原上海洋型冰川发育最广泛的地区之一[16],主要受印度季风控制[17],是了解印度季风与冰川变化关系的关键区域.Hu等[18-19]通过10Be暴露测年方法测得了青藏高原东南地区巴松措流域与南迦巴瓦峰附近的派山谷冰川作用的时间.另外,在巴松措流域,Hu等[18]还应用光释光(OSL)测年技术测定了冰碛物的年代.其中,10Be暴露测年法所测得的是冰川形成该规模的最小年代,而OSL法测得的是冰碛物的沉积年代,Hu等[18]综合判定此次冰川作用发生在LGM时期,并根据侧碛-终碛等地貌大致限定了LGM冰川作用的范围,并估算了当时的ELA.由于大多情况下冰川地貌存在缺失或者后期地质改造而退化的情况[20],而冰川平衡剖面模型仅需要部分保存下来的地貌证据即可完成对古冰川规模的重建,因此最好将这些地貌、地形证据与数值模型方法相结合用于古冰川的重建工作[21].对于稳定态冰川的模拟,冰川纵剖面模型与高阶冰流模型运行结果极其相似[22],而且所需参数少且易于获得,运算简单快捷.因此,近年来冰川平衡纵剖面模型在对青藏高原范围内的古冰川重建方面受到了广泛的应用[23-32].本文将以前人的10Be测年结果为年代学基础,应用冰川平衡纵剖面模型结合有关地貌证据,定量重建这两条冰川在LGM时期的范围、冰储量和ELA等参数,由此进一步恢复该地区LGM时期的气候条件. ...
Cosmogenic Be-10 surface exposure dating and glacier reconstruction for the Last Glacial Maximum in the Quemuqu Valley, western Nyainqentanglha Mountains, south Tibet
1
2017
... 青藏高原东南部是高原上海洋型冰川发育最广泛的地区之一[16],主要受印度季风控制[17],是了解印度季风与冰川变化关系的关键区域.Hu等[18-19]通过10Be暴露测年方法测得了青藏高原东南地区巴松措流域与南迦巴瓦峰附近的派山谷冰川作用的时间.另外,在巴松措流域,Hu等[18]还应用光释光(OSL)测年技术测定了冰碛物的年代.其中,10Be暴露测年法所测得的是冰川形成该规模的最小年代,而OSL法测得的是冰碛物的沉积年代,Hu等[18]综合判定此次冰川作用发生在LGM时期,并根据侧碛-终碛等地貌大致限定了LGM冰川作用的范围,并估算了当时的ELA.由于大多情况下冰川地貌存在缺失或者后期地质改造而退化的情况[20],而冰川平衡剖面模型仅需要部分保存下来的地貌证据即可完成对古冰川规模的重建,因此最好将这些地貌、地形证据与数值模型方法相结合用于古冰川的重建工作[21].对于稳定态冰川的模拟,冰川纵剖面模型与高阶冰流模型运行结果极其相似[22],而且所需参数少且易于获得,运算简单快捷.因此,近年来冰川平衡纵剖面模型在对青藏高原范围内的古冰川重建方面受到了广泛的应用[23-32].本文将以前人的10Be测年结果为年代学基础,应用冰川平衡纵剖面模型结合有关地貌证据,定量重建这两条冰川在LGM时期的范围、冰储量和ELA等参数,由此进一步恢复该地区LGM时期的气候条件. ...
Reconstruction of the neoglacial glacier in the Qiangyong valley, Mt. Kaluxiong, south Tibet
0
2018
藏南卡鲁雄峰枪勇冰川新冰期冰川发育探讨
0
2018
Late Quaternary glaciations in the Cogarbu valley, Bhutanese Himalaya
0
2019
Modelling glacier advances and related climate conditions during the last glaciation cycle in the Kuzigun Valley, Tashkurgan catchment, on the north-west Tibetan Plateau
0
2014
Glacier sensitivity to equilibrium line altitude and reconstruction for the Last Glacial cycle: glacier modeling in the Payuwang Valley, western Nyaiqentanggulha Shan, Tibetan Plateau
0
2015
Last glacial maximum climate based on cosmogenic 10Be exposure ages and glacier modeling for the head of Tashkurgan Valley, northwest Tibetan Plateau
0
2013
Timing and configuration of the Gongga II glaciation in the Hailuogou Valley, eastern Tibetan Plateau: a glacier-climate modeling method
0
2017
Glacial events during the last glacial termination in the Pagele Valley, Qiongmu Gangri Peak, southern Tibetan Plateau, and their links to oceanic and atmospheric circulation
0
2020
Last Glacial Maximum glacier modelling in the Quemuqu Valley, southern Tibetan Plateau, and its climatic implications
0
2020
Paleoglacial and paleoclimate reconstructions during the global Last Glacial Maximum in the Longriba area, eastern Tibetan Plateau
1
2021
... 青藏高原东南部是高原上海洋型冰川发育最广泛的地区之一[16],主要受印度季风控制[17],是了解印度季风与冰川变化关系的关键区域.Hu等[18-19]通过10Be暴露测年方法测得了青藏高原东南地区巴松措流域与南迦巴瓦峰附近的派山谷冰川作用的时间.另外,在巴松措流域,Hu等[18]还应用光释光(OSL)测年技术测定了冰碛物的年代.其中,10Be暴露测年法所测得的是冰川形成该规模的最小年代,而OSL法测得的是冰碛物的沉积年代,Hu等[18]综合判定此次冰川作用发生在LGM时期,并根据侧碛-终碛等地貌大致限定了LGM冰川作用的范围,并估算了当时的ELA.由于大多情况下冰川地貌存在缺失或者后期地质改造而退化的情况[20],而冰川平衡剖面模型仅需要部分保存下来的地貌证据即可完成对古冰川规模的重建,因此最好将这些地貌、地形证据与数值模型方法相结合用于古冰川的重建工作[21].对于稳定态冰川的模拟,冰川纵剖面模型与高阶冰流模型运行结果极其相似[22],而且所需参数少且易于获得,运算简单快捷.因此,近年来冰川平衡纵剖面模型在对青藏高原范围内的古冰川重建方面受到了广泛的应用[23-32].本文将以前人的10Be测年结果为年代学基础,应用冰川平衡纵剖面模型结合有关地貌证据,定量重建这两条冰川在LGM时期的范围、冰储量和ELA等参数,由此进一步恢复该地区LGM时期的气候条件. ...
Cosmic ray labeling of erosion surfaces: in situ nuclide production rates and erosion models
2
1991
... 巴松措流域位于念青唐古拉山脉东段与喜马拉雅山脉交界处的南坡,南迦巴瓦峰西北方向约115 km处.根据GLIMS(Global Land Ice Measurements from Space)数据,该流域现代冰川覆盖范围约220.2 km2,其中冰川面积大于0.5 km2的有82条.巴松措湖沿岸有一组侧碛和终碛存在,也是该流域最外围的冰碛,代表了该流域最广泛的冰川活动.侧碛在湖的南岸保存较好,长19 km,北岸侧碛只有约2.4 km,与侧碛构成一体的终碛位于湖的出口处,由几组冰碛丘陵组成,表明冰川在该阶段到达巴松措现在的出口位置,距离主要支流(中措、白兰沟、新措)现代冰川末端分别为~33、~36和~48 km,其上分布有花岗岩漂砾.为了约束该次冰期的数值年代,Hu等[18]在最外围的丘状终碛顶部采集了5个漂砾样品,使用宇宙成因核素10Be暴露测年法测得了其暴露年龄,为了方便统一比较,本研究利用CRONUS-Earth 3.0计算程序(http://hess.ess.washington.edu),Lal(1991)/Stone(2000)生产率随时间变化的模型[33-34]重新计算了该组冰碛的10Be暴露年龄:(20.1±1.4) ka、(19.1±1.4) ka、(20.1±1.4) ka、(26.4±1.7) ka和(20.5±1.4) ka(表1);另外,Hu等[18]对南北两岸的侧碛采集的23个沉积样品开展了光释光测年,结果显示冰进最大规模在16~30 ka之间,综合判定这组终碛-侧碛垄形成的年代是LGM时期. ...
... [33-34]重新计算了该组冰碛的10Be暴露年龄:(20.1±1.4) ka、(19.1±1.4) ka、(20.1±1.4) ka、(26.4±1.7) ka和(20.5±1.4) ka(表1);另外,Hu等[18]对南北两岸的侧碛采集的23个沉积样品开展了光释光测年,结果显示冰进最大规模在16~30 ka之间,综合判定这组终碛-侧碛垄形成的年代是LGM时期. ...
Air pressure and cosmogenic isotope production
2
2000
... 巴松措流域位于念青唐古拉山脉东段与喜马拉雅山脉交界处的南坡,南迦巴瓦峰西北方向约115 km处.根据GLIMS(Global Land Ice Measurements from Space)数据,该流域现代冰川覆盖范围约220.2 km2,其中冰川面积大于0.5 km2的有82条.巴松措湖沿岸有一组侧碛和终碛存在,也是该流域最外围的冰碛,代表了该流域最广泛的冰川活动.侧碛在湖的南岸保存较好,长19 km,北岸侧碛只有约2.4 km,与侧碛构成一体的终碛位于湖的出口处,由几组冰碛丘陵组成,表明冰川在该阶段到达巴松措现在的出口位置,距离主要支流(中措、白兰沟、新措)现代冰川末端分别为~33、~36和~48 km,其上分布有花岗岩漂砾.为了约束该次冰期的数值年代,Hu等[18]在最外围的丘状终碛顶部采集了5个漂砾样品,使用宇宙成因核素10Be暴露测年法测得了其暴露年龄,为了方便统一比较,本研究利用CRONUS-Earth 3.0计算程序(http://hess.ess.washington.edu),Lal(1991)/Stone(2000)生产率随时间变化的模型[33-34]重新计算了该组冰碛的10Be暴露年龄:(20.1±1.4) ka、(19.1±1.4) ka、(20.1±1.4) ka、(26.4±1.7) ka和(20.5±1.4) ka(表1);另外,Hu等[18]对南北两岸的侧碛采集的23个沉积样品开展了光释光测年,结果显示冰进最大规模在16~30 ka之间,综合判定这组终碛-侧碛垄形成的年代是LGM时期. ...
... -34]重新计算了该组冰碛的10Be暴露年龄:(20.1±1.4) ka、(19.1±1.4) ka、(20.1±1.4) ka、(26.4±1.7) ka和(20.5±1.4) ka(表1);另外,Hu等[18]对南北两岸的侧碛采集的23个沉积样品开展了光释光测年,结果显示冰进最大规模在16~30 ka之间,综合判定这组终碛-侧碛垄形成的年代是LGM时期. ...
1
2010
... 式中:为冰密度(约为900 kg·m-3);为重力加速度;为冰厚;为冰面高程;为水平坐标(轴与冰的流动方向平行,冰川上面的部分为正).然后,从终碛向上沿冰川逐级迭代求解[35]: ...
Modelling coupled hydraulics and sediment transport of a high-magnitude flood and associated landscape change
1
2007
... (1)在图新地球中绘制流线以及冰川流域边界的矢量文件,其中流线的绘制尽可能细致,有利于后期插值的可靠性.需要说明的是,“GlaRe”模块虽然可以根据终碛垄位置自动生成冰川流线,但对于形状复杂的冰川来说,自动生成的中流线容易出错[36],因此本研究选择了手动绘制的方法; ...
1
2014
... 冰川平衡线指某一时段内冰川上物质平衡为零的所有点的连线,一般有年平衡线或多年平衡线,ELA即冰川表面平衡线所对应的海拔高度[37],ELA以上属于冰川的积累区,以下属于冰川消融区.本研究采用AAR、AABR两种方法计算ELA.AAR法的原理为:冰川处于稳定状态时,积累区面积占整个冰川面积的比值(AAR值)是固定的[38],这样就可以在GIS中通过冰川表面积计算冰川的积累区范围,从而确定ELA.全球范围来看,冰斗和山谷冰川的AAR值的范围在0.5~0.8之间[39],张鲜鹤等[40]研究发现念青唐古拉山脉东段的AAR值在0.5~0.7之间,而喜马拉雅山脉东段的AAR值都在0.5以下.AABR法利用冰川积累区面积以及消融区和积累区物质平衡梯度(冰川消融和积累随海拔高度的变化)的比值,即BR值来计算ELA.Rea[41]计算了全球具有物质平衡观测记录的冰川AABR值,认为全球平均值为1.75±0.71.由于夏季的高消融率,建议把AABR值为1.8~2.2作为中纬度海洋型冰川的代表[39,41-42].本研究使用Pellitero等[42]编写的ArcGIS模块来实现ELA的重建计算,本文分别计算了不同AAR(0.5~0.7)和AABR(1.8~2.2)值的ELA值,通过两种方法对比得出冰川在LGM时的ELA. ...
Recent variations in mass net budgets of glaciers in western North America
1
1962
... 冰川平衡线指某一时段内冰川上物质平衡为零的所有点的连线,一般有年平衡线或多年平衡线,ELA即冰川表面平衡线所对应的海拔高度[37],ELA以上属于冰川的积累区,以下属于冰川消融区.本研究采用AAR、AABR两种方法计算ELA.AAR法的原理为:冰川处于稳定状态时,积累区面积占整个冰川面积的比值(AAR值)是固定的[38],这样就可以在GIS中通过冰川表面积计算冰川的积累区范围,从而确定ELA.全球范围来看,冰斗和山谷冰川的AAR值的范围在0.5~0.8之间[39],张鲜鹤等[40]研究发现念青唐古拉山脉东段的AAR值在0.5~0.7之间,而喜马拉雅山脉东段的AAR值都在0.5以下.AABR法利用冰川积累区面积以及消融区和积累区物质平衡梯度(冰川消融和积累随海拔高度的变化)的比值,即BR值来计算ELA.Rea[41]计算了全球具有物质平衡观测记录的冰川AABR值,认为全球平均值为1.75±0.71.由于夏季的高消融率,建议把AABR值为1.8~2.2作为中纬度海洋型冰川的代表[39,41-42].本研究使用Pellitero等[42]编写的ArcGIS模块来实现ELA的重建计算,本文分别计算了不同AAR(0.5~0.7)和AABR(1.8~2.2)值的ELA值,通过两种方法对比得出冰川在LGM时的ELA. ...
Palaeoclimatic reconstruction from loch Lomond Readvance glaciers in the West Drumochter Hills, Scotland
2
2005
... 冰川平衡线指某一时段内冰川上物质平衡为零的所有点的连线,一般有年平衡线或多年平衡线,ELA即冰川表面平衡线所对应的海拔高度[37],ELA以上属于冰川的积累区,以下属于冰川消融区.本研究采用AAR、AABR两种方法计算ELA.AAR法的原理为:冰川处于稳定状态时,积累区面积占整个冰川面积的比值(AAR值)是固定的[38],这样就可以在GIS中通过冰川表面积计算冰川的积累区范围,从而确定ELA.全球范围来看,冰斗和山谷冰川的AAR值的范围在0.5~0.8之间[39],张鲜鹤等[40]研究发现念青唐古拉山脉东段的AAR值在0.5~0.7之间,而喜马拉雅山脉东段的AAR值都在0.5以下.AABR法利用冰川积累区面积以及消融区和积累区物质平衡梯度(冰川消融和积累随海拔高度的变化)的比值,即BR值来计算ELA.Rea[41]计算了全球具有物质平衡观测记录的冰川AABR值,认为全球平均值为1.75±0.71.由于夏季的高消融率,建议把AABR值为1.8~2.2作为中纬度海洋型冰川的代表[39,41-42].本研究使用Pellitero等[42]编写的ArcGIS模块来实现ELA的重建计算,本文分别计算了不同AAR(0.5~0.7)和AABR(1.8~2.2)值的ELA值,通过两种方法对比得出冰川在LGM时的ELA. ...
... [39,41-42].本研究使用Pellitero等[42]编写的ArcGIS模块来实现ELA的重建计算,本文分别计算了不同AAR(0.5~0.7)和AABR(1.8~2.2)值的ELA值,通过两种方法对比得出冰川在LGM时的ELA. ...
Altitude structure characteristics of the glaciers in China based on the Second Chinese Glacier Inventory
1
2017
... 冰川平衡线指某一时段内冰川上物质平衡为零的所有点的连线,一般有年平衡线或多年平衡线,ELA即冰川表面平衡线所对应的海拔高度[37],ELA以上属于冰川的积累区,以下属于冰川消融区.本研究采用AAR、AABR两种方法计算ELA.AAR法的原理为:冰川处于稳定状态时,积累区面积占整个冰川面积的比值(AAR值)是固定的[38],这样就可以在GIS中通过冰川表面积计算冰川的积累区范围,从而确定ELA.全球范围来看,冰斗和山谷冰川的AAR值的范围在0.5~0.8之间[39],张鲜鹤等[40]研究发现念青唐古拉山脉东段的AAR值在0.5~0.7之间,而喜马拉雅山脉东段的AAR值都在0.5以下.AABR法利用冰川积累区面积以及消融区和积累区物质平衡梯度(冰川消融和积累随海拔高度的变化)的比值,即BR值来计算ELA.Rea[41]计算了全球具有物质平衡观测记录的冰川AABR值,认为全球平均值为1.75±0.71.由于夏季的高消融率,建议把AABR值为1.8~2.2作为中纬度海洋型冰川的代表[39,41-42].本研究使用Pellitero等[42]编写的ArcGIS模块来实现ELA的重建计算,本文分别计算了不同AAR(0.5~0.7)和AABR(1.8~2.2)值的ELA值,通过两种方法对比得出冰川在LGM时的ELA. ...
基于第二次冰川编目数据的中国冰川高度结构特征分析
1
2017
... 冰川平衡线指某一时段内冰川上物质平衡为零的所有点的连线,一般有年平衡线或多年平衡线,ELA即冰川表面平衡线所对应的海拔高度[37],ELA以上属于冰川的积累区,以下属于冰川消融区.本研究采用AAR、AABR两种方法计算ELA.AAR法的原理为:冰川处于稳定状态时,积累区面积占整个冰川面积的比值(AAR值)是固定的[38],这样就可以在GIS中通过冰川表面积计算冰川的积累区范围,从而确定ELA.全球范围来看,冰斗和山谷冰川的AAR值的范围在0.5~0.8之间[39],张鲜鹤等[40]研究发现念青唐古拉山脉东段的AAR值在0.5~0.7之间,而喜马拉雅山脉东段的AAR值都在0.5以下.AABR法利用冰川积累区面积以及消融区和积累区物质平衡梯度(冰川消融和积累随海拔高度的变化)的比值,即BR值来计算ELA.Rea[41]计算了全球具有物质平衡观测记录的冰川AABR值,认为全球平均值为1.75±0.71.由于夏季的高消融率,建议把AABR值为1.8~2.2作为中纬度海洋型冰川的代表[39,41-42].本研究使用Pellitero等[42]编写的ArcGIS模块来实现ELA的重建计算,本文分别计算了不同AAR(0.5~0.7)和AABR(1.8~2.2)值的ELA值,通过两种方法对比得出冰川在LGM时的ELA. ...
Defining modern day Area-Altitude Balance Ratios (AABRs) and their use in glacier-climate reconstructions
2
2009
... 冰川平衡线指某一时段内冰川上物质平衡为零的所有点的连线,一般有年平衡线或多年平衡线,ELA即冰川表面平衡线所对应的海拔高度[37],ELA以上属于冰川的积累区,以下属于冰川消融区.本研究采用AAR、AABR两种方法计算ELA.AAR法的原理为:冰川处于稳定状态时,积累区面积占整个冰川面积的比值(AAR值)是固定的[38],这样就可以在GIS中通过冰川表面积计算冰川的积累区范围,从而确定ELA.全球范围来看,冰斗和山谷冰川的AAR值的范围在0.5~0.8之间[39],张鲜鹤等[40]研究发现念青唐古拉山脉东段的AAR值在0.5~0.7之间,而喜马拉雅山脉东段的AAR值都在0.5以下.AABR法利用冰川积累区面积以及消融区和积累区物质平衡梯度(冰川消融和积累随海拔高度的变化)的比值,即BR值来计算ELA.Rea[41]计算了全球具有物质平衡观测记录的冰川AABR值,认为全球平均值为1.75±0.71.由于夏季的高消融率,建议把AABR值为1.8~2.2作为中纬度海洋型冰川的代表[39,41-42].本研究使用Pellitero等[42]编写的ArcGIS模块来实现ELA的重建计算,本文分别计算了不同AAR(0.5~0.7)和AABR(1.8~2.2)值的ELA值,通过两种方法对比得出冰川在LGM时的ELA. ...
... ,41-42].本研究使用Pellitero等[42]编写的ArcGIS模块来实现ELA的重建计算,本文分别计算了不同AAR(0.5~0.7)和AABR(1.8~2.2)值的ELA值,通过两种方法对比得出冰川在LGM时的ELA. ...
A GIS tool for automatic calculation of glacier equilibrium-line altitudes
2
2015
... 冰川平衡线指某一时段内冰川上物质平衡为零的所有点的连线,一般有年平衡线或多年平衡线,ELA即冰川表面平衡线所对应的海拔高度[37],ELA以上属于冰川的积累区,以下属于冰川消融区.本研究采用AAR、AABR两种方法计算ELA.AAR法的原理为:冰川处于稳定状态时,积累区面积占整个冰川面积的比值(AAR值)是固定的[38],这样就可以在GIS中通过冰川表面积计算冰川的积累区范围,从而确定ELA.全球范围来看,冰斗和山谷冰川的AAR值的范围在0.5~0.8之间[39],张鲜鹤等[40]研究发现念青唐古拉山脉东段的AAR值在0.5~0.7之间,而喜马拉雅山脉东段的AAR值都在0.5以下.AABR法利用冰川积累区面积以及消融区和积累区物质平衡梯度(冰川消融和积累随海拔高度的变化)的比值,即BR值来计算ELA.Rea[41]计算了全球具有物质平衡观测记录的冰川AABR值,认为全球平均值为1.75±0.71.由于夏季的高消融率,建议把AABR值为1.8~2.2作为中纬度海洋型冰川的代表[39,41-42].本研究使用Pellitero等[42]编写的ArcGIS模块来实现ELA的重建计算,本文分别计算了不同AAR(0.5~0.7)和AABR(1.8~2.2)值的ELA值,通过两种方法对比得出冰川在LGM时的ELA. ...
... [42]编写的ArcGIS模块来实现ELA的重建计算,本文分别计算了不同AAR(0.5~0.7)和AABR(1.8~2.2)值的ELA值,通过两种方法对比得出冰川在LGM时的ELA. ...
Mass balance and equilibrium-line altitudes of glaciers in high-mountain environments
1
2000
... 鉴于冰川ELA对气候变化的敏感性,ELA的变化值(ELA)可以很好地反映气温和降水的变化情况[43].Ohmura等[44]总结了平衡线处的气温降水关系,建立了平衡线处的气温、降水关系的经验回归模型(P-T模型).施雅风等[45]对中国西部17条现代冰川的记录进行研究,得出了ELA处的夏季(6—8月)平均气温(,单位:℃)和年降水量(,单位:mm)的对数回归模型: ...
Climate at the equilibrium line of glaciers
2
1992
... 鉴于冰川ELA对气候变化的敏感性,ELA的变化值(ELA)可以很好地反映气温和降水的变化情况[43].Ohmura等[44]总结了平衡线处的气温降水关系,建立了平衡线处的气温、降水关系的经验回归模型(P-T模型).施雅风等[45]对中国西部17条现代冰川的记录进行研究,得出了ELA处的夏季(6—8月)平均气温(,单位:℃)和年降水量(,单位:mm)的对数回归模型: ...
... 式中:、、分别为LGM以来的ELA的变化量、夏季平均气温变化量和年降水变化量,Ohmura等[44]研究了全球70条冰川的平衡线上气温降水关系,得出范围在2.5×10⁻³~3.3×10⁻³ ℃·mm-1,和分别表示年降水量、夏季平均气温随海拔的变化情况.本研究假设这些参数在LGM时期与现在一致,上述两个经验模型,可以模拟出LGM时期的气温和降水的组合情况. ...
1
1988
... 鉴于冰川ELA对气候变化的敏感性,ELA的变化值(ELA)可以很好地反映气温和降水的变化情况[43].Ohmura等[44]总结了平衡线处的气温降水关系,建立了平衡线处的气温、降水关系的经验回归模型(P-T模型).施雅风等[45]对中国西部17条现代冰川的记录进行研究,得出了ELA处的夏季(6—8月)平均气温(,单位:℃)和年降水量(,单位:mm)的对数回归模型: ...
1
1988
... 鉴于冰川ELA对气候变化的敏感性,ELA的变化值(ELA)可以很好地反映气温和降水的变化情况[43].Ohmura等[44]总结了平衡线处的气温降水关系,建立了平衡线处的气温、降水关系的经验回归模型(P-T模型).施雅风等[45]对中国西部17条现代冰川的记录进行研究,得出了ELA处的夏季(6—8月)平均气温(,单位:℃)和年降水量(,单位:mm)的对数回归模型: ...
Climatic interpretation of alpine snowline variations on millennial time scales
1
1994
... 式中:为夏季气温变化量();为年降水量变化百分比();、和、分别代表古今的夏季气温和年降水量.由于气温和降水是决定ELA的最重要的因素,本研究采用ELA与气候变化(气温和降水)的关系式来进一步约束古气候条件,即LR模型[46-48]: ...
Numerical reconstruction of three Holocene glacial events in Qiangyong Valley, southern tibetan Plateau and their implication for Holocene climate changes
0
2020
Models for climatic reconstruction upon glacier equilibrium-line altitude variation
1
2013
... 式中:为夏季气温变化量();为年降水量变化百分比();、和、分别代表古今的夏季气温和年降水量.由于气温和降水是决定ELA的最重要的因素,本研究采用ELA与气候变化(气温和降水)的关系式来进一步约束古气候条件,即LR模型[46-48]: ...
基于冰川物质平衡线高度变化的气候重建模型研究
1
2013
... 式中:为夏季气温变化量();为年降水量变化百分比();、和、分别代表古今的夏季气温和年降水量.由于气温和降水是决定ELA的最重要的因素,本研究采用ELA与气候变化(气温和降水)的关系式来进一步约束古气候条件,即LR模型[46-48]: ...
The mechanics of glacier flow
2
1952
... 根据冰川地貌学证据,本文应用“GlaRe”模块模拟得到了LGM时期巴松措流域与南迦巴瓦峰附近的派山谷冰川规模的各项参数.Pellitero等[21]通过对现代冰川的重建进行模型验证,对比发现用Topo to Raster插值法和克里金插值法及IDW插值法对冰储量和冰川面积的模拟结果相差不大,且对于后期ELA的计算来说Topo to raster法相对更优秀;并且本研究通过实验发现,Topo to raster插值方法得到的冰川表面更加符合冰川的实际形态,因此此次重建均使用该方法进行插值.根据文献[49],大多选择100 kPa的基底剪应力,如此重建得到的巴松措流域的冰川冰储量达到了274.4 km3,面积达982.3 km2,约是现代冰川的4.5倍;派山谷在LGM时期冰储量达0.51 km3,面积达5.76 km2.而一般冰川的基底剪应力在50~150 kPa之间[49],考虑到冰底地形的起伏会导致基底剪应力变化,本研究分别选取75 kPa、100 kPa和125 kPa的基底剪应力,重建出两研究区末次冰盛期期间的冰川表面(表2~3).在巴松措流域,增加或减少25 kPa的基底剪应力重建得到的末次冰盛期时的冰储量与100 kPa相比,得到的冰储量结果相差大概在30%以内,冰川面积的差值在15%以内.统一使用AABR法进行ELA的计算,得到75 kPa和125 kPa与100 kPa基底剪应力得到的ELA值分别为4 388~4 413 m、4 472~4 497 m和4 580~4 605 m,可以看出差异在84~108 m.派山谷冰川在末次冰盛期时,在100 kPa的基础上上下变化25 kPa,造成的重建得到的冰储量差异也在30%以内,冰川面积的差异在13%以内,AABR计算得到的三种基底剪应力对应的ELA分别为3 566~3 616 m、3 619~3 669 m、3 672~3 722 m,依次相差53 m.可以看出,对巴松措这种复杂的大流域冰川的重建,整体来说基底剪应力的差异会导致重建所得的较大的ELA值差异.由于巴松措湖(最大水深约120 m[51])和派山谷底碛的影响,重建时所输入的冰底地形在靠近冰川末端处会比LGM时期真实的冰底地形偏高,相应地会导致重建出的冰川在冰舌处厚度偏小.另外,Finlayson[52]评估了冰流模型在不同底碛及冰川消退后地形改变情形下对冰川厚度重建结果的影响,认为底碛及冰川消退后地形改变对该方法重建的古冰川表面高程整体上有不到1%的影响.将AAR和AABR法计算得到的ELA值取平均,得到LGM时期巴松措流域冰川和派山谷冰川的ELA分别为4 460~4 547 m和3 569~3 694 m. ...
... [49],考虑到冰底地形的起伏会导致基底剪应力变化,本研究分别选取75 kPa、100 kPa和125 kPa的基底剪应力,重建出两研究区末次冰盛期期间的冰川表面(表2~3).在巴松措流域,增加或减少25 kPa的基底剪应力重建得到的末次冰盛期时的冰储量与100 kPa相比,得到的冰储量结果相差大概在30%以内,冰川面积的差值在15%以内.统一使用AABR法进行ELA的计算,得到75 kPa和125 kPa与100 kPa基底剪应力得到的ELA值分别为4 388~4 413 m、4 472~4 497 m和4 580~4 605 m,可以看出差异在84~108 m.派山谷冰川在末次冰盛期时,在100 kPa的基础上上下变化25 kPa,造成的重建得到的冰储量差异也在30%以内,冰川面积的差异在13%以内,AABR计算得到的三种基底剪应力对应的ELA分别为3 566~3 616 m、3 619~3 669 m、3 672~3 722 m,依次相差53 m.可以看出,对巴松措这种复杂的大流域冰川的重建,整体来说基底剪应力的差异会导致重建所得的较大的ELA值差异.由于巴松措湖(最大水深约120 m[51])和派山谷底碛的影响,重建时所输入的冰底地形在靠近冰川末端处会比LGM时期真实的冰底地形偏高,相应地会导致重建出的冰川在冰舌处厚度偏小.另外,Finlayson[52]评估了冰流模型在不同底碛及冰川消退后地形改变情形下对冰川厚度重建结果的影响,认为底碛及冰川消退后地形改变对该方法重建的古冰川表面高程整体上有不到1%的影响.将AAR和AABR法计算得到的ELA值取平均,得到LGM时期巴松措流域冰川和派山谷冰川的ELA分别为4 460~4 547 m和3 569~3 694 m. ...
Altitude effect of precipitation and spatatial distrbution of Qinghai-Tibetan Plateau
1
2007
... 研究区的降水量(P,mm)随海拔(z,m)升高而降低[50],利用上述八个站点的气象数据计算得到1998—2019年平均的年降水量梯度(=-224 mm·a-1·km-1),可拟合成以下关系式: ...
青藏高原降水的梯度效应及其空间分布模拟
1
2007
... 研究区的降水量(P,mm)随海拔(z,m)升高而降低[50],利用上述八个站点的气象数据计算得到1998—2019年平均的年降水量梯度(=-224 mm·a-1·km-1),可拟合成以下关系式: ...
Modern sedimentary process of Lake Basomtso in the southeastern Tibetan Plateau and its response to climate change
1
2019
... 根据冰川地貌学证据,本文应用“GlaRe”模块模拟得到了LGM时期巴松措流域与南迦巴瓦峰附近的派山谷冰川规模的各项参数.Pellitero等[21]通过对现代冰川的重建进行模型验证,对比发现用Topo to Raster插值法和克里金插值法及IDW插值法对冰储量和冰川面积的模拟结果相差不大,且对于后期ELA的计算来说Topo to raster法相对更优秀;并且本研究通过实验发现,Topo to raster插值方法得到的冰川表面更加符合冰川的实际形态,因此此次重建均使用该方法进行插值.根据文献[49],大多选择100 kPa的基底剪应力,如此重建得到的巴松措流域的冰川冰储量达到了274.4 km3,面积达982.3 km2,约是现代冰川的4.5倍;派山谷在LGM时期冰储量达0.51 km3,面积达5.76 km2.而一般冰川的基底剪应力在50~150 kPa之间[49],考虑到冰底地形的起伏会导致基底剪应力变化,本研究分别选取75 kPa、100 kPa和125 kPa的基底剪应力,重建出两研究区末次冰盛期期间的冰川表面(表2~3).在巴松措流域,增加或减少25 kPa的基底剪应力重建得到的末次冰盛期时的冰储量与100 kPa相比,得到的冰储量结果相差大概在30%以内,冰川面积的差值在15%以内.统一使用AABR法进行ELA的计算,得到75 kPa和125 kPa与100 kPa基底剪应力得到的ELA值分别为4 388~4 413 m、4 472~4 497 m和4 580~4 605 m,可以看出差异在84~108 m.派山谷冰川在末次冰盛期时,在100 kPa的基础上上下变化25 kPa,造成的重建得到的冰储量差异也在30%以内,冰川面积的差异在13%以内,AABR计算得到的三种基底剪应力对应的ELA分别为3 566~3 616 m、3 619~3 669 m、3 672~3 722 m,依次相差53 m.可以看出,对巴松措这种复杂的大流域冰川的重建,整体来说基底剪应力的差异会导致重建所得的较大的ELA值差异.由于巴松措湖(最大水深约120 m[51])和派山谷底碛的影响,重建时所输入的冰底地形在靠近冰川末端处会比LGM时期真实的冰底地形偏高,相应地会导致重建出的冰川在冰舌处厚度偏小.另外,Finlayson[52]评估了冰流模型在不同底碛及冰川消退后地形改变情形下对冰川厚度重建结果的影响,认为底碛及冰川消退后地形改变对该方法重建的古冰川表面高程整体上有不到1%的影响.将AAR和AABR法计算得到的ELA值取平均,得到LGM时期巴松措流域冰川和派山谷冰川的ELA分别为4 460~4 547 m和3 569~3 694 m. ...
青藏高原东南部巴松措现代沉积过程及其对气候变化的响应
1
2019
... 根据冰川地貌学证据,本文应用“GlaRe”模块模拟得到了LGM时期巴松措流域与南迦巴瓦峰附近的派山谷冰川规模的各项参数.Pellitero等[21]通过对现代冰川的重建进行模型验证,对比发现用Topo to Raster插值法和克里金插值法及IDW插值法对冰储量和冰川面积的模拟结果相差不大,且对于后期ELA的计算来说Topo to raster法相对更优秀;并且本研究通过实验发现,Topo to raster插值方法得到的冰川表面更加符合冰川的实际形态,因此此次重建均使用该方法进行插值.根据文献[49],大多选择100 kPa的基底剪应力,如此重建得到的巴松措流域的冰川冰储量达到了274.4 km3,面积达982.3 km2,约是现代冰川的4.5倍;派山谷在LGM时期冰储量达0.51 km3,面积达5.76 km2.而一般冰川的基底剪应力在50~150 kPa之间[49],考虑到冰底地形的起伏会导致基底剪应力变化,本研究分别选取75 kPa、100 kPa和125 kPa的基底剪应力,重建出两研究区末次冰盛期期间的冰川表面(表2~3).在巴松措流域,增加或减少25 kPa的基底剪应力重建得到的末次冰盛期时的冰储量与100 kPa相比,得到的冰储量结果相差大概在30%以内,冰川面积的差值在15%以内.统一使用AABR法进行ELA的计算,得到75 kPa和125 kPa与100 kPa基底剪应力得到的ELA值分别为4 388~4 413 m、4 472~4 497 m和4 580~4 605 m,可以看出差异在84~108 m.派山谷冰川在末次冰盛期时,在100 kPa的基础上上下变化25 kPa,造成的重建得到的冰储量差异也在30%以内,冰川面积的差异在13%以内,AABR计算得到的三种基底剪应力对应的ELA分别为3 566~3 616 m、3 619~3 669 m、3 672~3 722 m,依次相差53 m.可以看出,对巴松措这种复杂的大流域冰川的重建,整体来说基底剪应力的差异会导致重建所得的较大的ELA值差异.由于巴松措湖(最大水深约120 m[51])和派山谷底碛的影响,重建时所输入的冰底地形在靠近冰川末端处会比LGM时期真实的冰底地形偏高,相应地会导致重建出的冰川在冰舌处厚度偏小.另外,Finlayson[52]评估了冰流模型在不同底碛及冰川消退后地形改变情形下对冰川厚度重建结果的影响,认为底碛及冰川消退后地形改变对该方法重建的古冰川表面高程整体上有不到1%的影响.将AAR和AABR法计算得到的ELA值取平均,得到LGM时期巴松措流域冰川和派山谷冰川的ELA分别为4 460~4 547 m和3 569~3 694 m. ...
Digital surface models are not always representative of former glacier beds: palaeoglaciological and geomorphological implications
1
2013
... 根据冰川地貌学证据,本文应用“GlaRe”模块模拟得到了LGM时期巴松措流域与南迦巴瓦峰附近的派山谷冰川规模的各项参数.Pellitero等[21]通过对现代冰川的重建进行模型验证,对比发现用Topo to Raster插值法和克里金插值法及IDW插值法对冰储量和冰川面积的模拟结果相差不大,且对于后期ELA的计算来说Topo to raster法相对更优秀;并且本研究通过实验发现,Topo to raster插值方法得到的冰川表面更加符合冰川的实际形态,因此此次重建均使用该方法进行插值.根据文献[49],大多选择100 kPa的基底剪应力,如此重建得到的巴松措流域的冰川冰储量达到了274.4 km3,面积达982.3 km2,约是现代冰川的4.5倍;派山谷在LGM时期冰储量达0.51 km3,面积达5.76 km2.而一般冰川的基底剪应力在50~150 kPa之间[49],考虑到冰底地形的起伏会导致基底剪应力变化,本研究分别选取75 kPa、100 kPa和125 kPa的基底剪应力,重建出两研究区末次冰盛期期间的冰川表面(表2~3).在巴松措流域,增加或减少25 kPa的基底剪应力重建得到的末次冰盛期时的冰储量与100 kPa相比,得到的冰储量结果相差大概在30%以内,冰川面积的差值在15%以内.统一使用AABR法进行ELA的计算,得到75 kPa和125 kPa与100 kPa基底剪应力得到的ELA值分别为4 388~4 413 m、4 472~4 497 m和4 580~4 605 m,可以看出差异在84~108 m.派山谷冰川在末次冰盛期时,在100 kPa的基础上上下变化25 kPa,造成的重建得到的冰储量差异也在30%以内,冰川面积的差异在13%以内,AABR计算得到的三种基底剪应力对应的ELA分别为3 566~3 616 m、3 619~3 669 m、3 672~3 722 m,依次相差53 m.可以看出,对巴松措这种复杂的大流域冰川的重建,整体来说基底剪应力的差异会导致重建所得的较大的ELA值差异.由于巴松措湖(最大水深约120 m[51])和派山谷底碛的影响,重建时所输入的冰底地形在靠近冰川末端处会比LGM时期真实的冰底地形偏高,相应地会导致重建出的冰川在冰舌处厚度偏小.另外,Finlayson[52]评估了冰流模型在不同底碛及冰川消退后地形改变情形下对冰川厚度重建结果的影响,认为底碛及冰川消退后地形改变对该方法重建的古冰川表面高程整体上有不到1%的影响.将AAR和AABR法计算得到的ELA值取平均,得到LGM时期巴松措流域冰川和派山谷冰川的ELA分别为4 460~4 547 m和3 569~3 694 m. ...
Glaciers and environments during the Last Glacial Maximum (LGM) on the Tibetan Plateau
2
1997
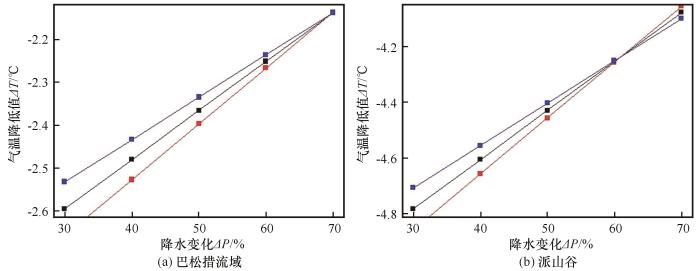
... 本研究将设定为现代降水量的30%~70%[53],和取值来自公式(7)、(8),的值设定为(2.9±0.4)×10-3 ℃·mm-1,代入模型[式(6)],得到了LGM时期两地冰川平衡线处的气温和降水组合(图5).可以看出,降水减少30%~70%的情况下,不考虑参数引起的不确定性,要达到LGM时期的冰川规模,巴松措流域和派山谷地区所需要的夏季平均气温分别比现在低2.14~2.59 ℃和4.08~4.78 ℃,可以看出气温的降低是LGM时期青藏高原东南地区发生冰进的主要驱动力. ...
... 从10Be年龄来说,巴松措流域冰川约在19~20 ka达到现在湖出口的位置,而派山谷的冰碛10Be年代学结果显示冰川前进发生在末次冰盛期早期(~23 ka),恰好为古里雅冰芯连续记录显示的LGM最低温所出现的时段[53],两地区的气温和降水组合体现了青藏高原东南地区具体到LGM不同阶段的气候状况(图5~6).另外,张廉卿等[59]对念青唐古拉山西段冰川的研究发现平衡线高度变化主要受气候因素的影响,两地均在印度季风控制区,相对来说派山谷更靠近高原边缘,相比巴松措受到印度季风的影响更大,降水更加充沛,平衡线高度上升快.本研究的结果也支持了前人的工作,即从高原边缘到内部,从东南到西北LGM期间的逐渐减小[1].除气候因素外,两地冰川的范围以及冰底地形的复杂性都有很大不同,尤其是研究区位于东喜马拉雅构造结,地形复杂陡峻,这些因素也会对平衡线高度变化量造成一定的影响.总的来说,气温降低是该地区LGM时期ELA下降的主要原因,即在气候干燥(冰川积累量减少)的情况下,足够的低温增加了积累区面积并减少了冰川的消融[60],使冰川净积累增加,从而导致该时期冰川发生大规模冰进. ...
青藏高原末次冰期最盛时的冰川与环境
2
1997
... 本研究将设定为现代降水量的30%~70%[53],和取值来自公式(7)、(8),的值设定为(2.9±0.4)×10-3 ℃·mm-1,代入模型[式(6)],得到了LGM时期两地冰川平衡线处的气温和降水组合(图5).可以看出,降水减少30%~70%的情况下,不考虑参数引起的不确定性,要达到LGM时期的冰川规模,巴松措流域和派山谷地区所需要的夏季平均气温分别比现在低2.14~2.59 ℃和4.08~4.78 ℃,可以看出气温的降低是LGM时期青藏高原东南地区发生冰进的主要驱动力. ...
... 从10Be年龄来说,巴松措流域冰川约在19~20 ka达到现在湖出口的位置,而派山谷的冰碛10Be年代学结果显示冰川前进发生在末次冰盛期早期(~23 ka),恰好为古里雅冰芯连续记录显示的LGM最低温所出现的时段[53],两地区的气温和降水组合体现了青藏高原东南地区具体到LGM不同阶段的气候状况(图5~6).另外,张廉卿等[59]对念青唐古拉山西段冰川的研究发现平衡线高度变化主要受气候因素的影响,两地均在印度季风控制区,相对来说派山谷更靠近高原边缘,相比巴松措受到印度季风的影响更大,降水更加充沛,平衡线高度上升快.本研究的结果也支持了前人的工作,即从高原边缘到内部,从东南到西北LGM期间的逐渐减小[1].除气候因素外,两地冰川的范围以及冰底地形的复杂性都有很大不同,尤其是研究区位于东喜马拉雅构造结,地形复杂陡峻,这些因素也会对平衡线高度变化量造成一定的影响.总的来说,气温降低是该地区LGM时期ELA下降的主要原因,即在气候干燥(冰川积累量减少)的情况下,足够的低温增加了积累区面积并减少了冰川的消融[60],使冰川净积累增加,从而导致该时期冰川发生大规模冰进. ...
Climatic changes in the southeastern Qinghai-Tibetan Plateau during the Last Glacial Maximum: pollen records from southeastern Tibet
2
2004
... 仁错湖(30.73° N,96.68° E,海拔4 450 m,图1)的孢粉记录显示LGM时期青藏高原东南的地区的年降水量是现在的40%[54],在这样的降水条件下,LR模型模拟得到巴松措和派山谷地区LGM时期的气温分别比现在降低了2.48 ℃和4.61 ℃.LR模型的不确定性主要由参数和决定,由模型构成可以看出,参数大小引起的模拟结果的不确定性主要与降水梯度和有关,其范围为 ±0.05 ℃;由的不确定性引起的结果的不确定性主要体现在派山谷地区,约为±0.08 ℃,主要与气温递减率和降水梯度有关,不随变化而变化. ...
... 以上通过LR和P-T模型计算得到了LGM时期两地可能的气候情景,这些气温和降水组合有助于评估其他气候代用指标的定量重建结果.由海登湖和仁错的高分辨率孢粉记录可知,青藏高原东南地区LGM期间与现在相比,7月气温降低了2~5 ℃,年降水量减少60%[54].25次古气候模拟比较计划(Paleoclimate Modelling Intercomparison Project, PMIP)的平均值显示LGM时期研究区年平均气温约比现代低4.0~4.5 ℃,年降水量相对现代减少约15%[14],本研究重建的LGM时期的气温与孢粉记录和PMIP模拟结果相差不大.Xu等[56]通过重建念青唐古拉山脉西段东南坡LGM时期的冰川规模,得到当时比现代气温低2.9~4.6 ℃.Chen等[57]计算得到青藏高原东南帕隆藏布流域五条冰川LGM时期的平均为917 m,并重建得到当时的夏季气温至少比现在低6.3 ℃.Zhou等[58]重建得到波堆藏布LGM时期的约为600 m,重建得到LGM时期气温比现在低6.6 ℃左右,这与本研究所重建的派山谷地区的和气温下降值很相似,但很明显,巴松措流域LGM时期的、气温变化相比以上偏小,这可能是因为重建的两个流域的冰川发生在LGM时期内不同的阶段,但整体来看,两地LGM气温下降值的重建结果均处于以往研究所重建得到的气温下降值的范围内. ...
末次盛冰期以来西藏东南部的气候变化——西藏东南部的花粉记录
2
2004
... 仁错湖(30.73° N,96.68° E,海拔4 450 m,图1)的孢粉记录显示LGM时期青藏高原东南的地区的年降水量是现在的40%[54],在这样的降水条件下,LR模型模拟得到巴松措和派山谷地区LGM时期的气温分别比现在降低了2.48 ℃和4.61 ℃.LR模型的不确定性主要由参数和决定,由模型构成可以看出,参数大小引起的模拟结果的不确定性主要与降水梯度和有关,其范围为 ±0.05 ℃;由的不确定性引起的结果的不确定性主要体现在派山谷地区,约为±0.08 ℃,主要与气温递减率和降水梯度有关,不随变化而变化. ...
... 以上通过LR和P-T模型计算得到了LGM时期两地可能的气候情景,这些气温和降水组合有助于评估其他气候代用指标的定量重建结果.由海登湖和仁错的高分辨率孢粉记录可知,青藏高原东南地区LGM期间与现在相比,7月气温降低了2~5 ℃,年降水量减少60%[54].25次古气候模拟比较计划(Paleoclimate Modelling Intercomparison Project, PMIP)的平均值显示LGM时期研究区年平均气温约比现代低4.0~4.5 ℃,年降水量相对现代减少约15%[14],本研究重建的LGM时期的气温与孢粉记录和PMIP模拟结果相差不大.Xu等[56]通过重建念青唐古拉山脉西段东南坡LGM时期的冰川规模,得到当时比现代气温低2.9~4.6 ℃.Chen等[57]计算得到青藏高原东南帕隆藏布流域五条冰川LGM时期的平均为917 m,并重建得到当时的夏季气温至少比现在低6.3 ℃.Zhou等[58]重建得到波堆藏布LGM时期的约为600 m,重建得到LGM时期气温比现在低6.6 ℃左右,这与本研究所重建的派山谷地区的和气温下降值很相似,但很明显,巴松措流域LGM时期的、气温变化相比以上偏小,这可能是因为重建的两个流域的冰川发生在LGM时期内不同的阶段,但整体来看,两地LGM气温下降值的重建结果均处于以往研究所重建得到的气温下降值的范围内. ...
Tectonics and topographic evolution of Namche Barwa and the easternmost Lhasa block, Tibet
1
2014
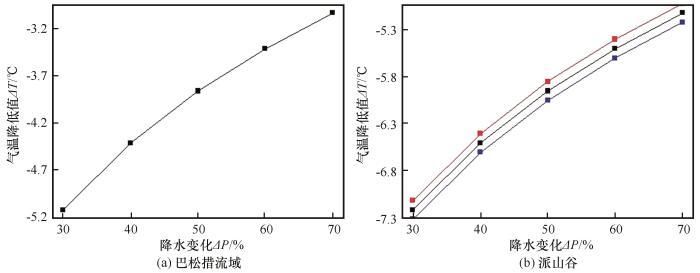
... P-T模型模拟结果显示(图5),在LGM时期降水量是现在降水量40%的情况下,巴松措和派山谷地区的夏季气温分别较现代低4.41 ℃和6.51 ℃.P-T模型的不确定性主要由的不确定性决定,主要体现在派山谷地区,且只与气温递减率有关,不确定性值为0.1 ℃.由于LGM以来研究区所在地块以至少5 mm·a-1速率遭受侵蚀[55],因此本研究使用120 m的剥蚀来修正ELA的计算,因此结果可能被低估(不超过4%).此外考虑到气温递减率(4.0 ℃·km-1)下,由于侵蚀所引起的温度变化的不确定性,最终降温大小大约被低估0.48 ℃.因此经过校正后,巴松措和派山谷LGM时期温度比现在分别降低了2.96~4.89 ℃和5.09~6.99 ℃. ...
Last Glacial climate reconstruction by exploring glacier sensitivity to climate on the southeastern slope of the western Nyaiqentanglha Shan, Tibetan Plateau
1
2017
... 以上通过LR和P-T模型计算得到了LGM时期两地可能的气候情景,这些气温和降水组合有助于评估其他气候代用指标的定量重建结果.由海登湖和仁错的高分辨率孢粉记录可知,青藏高原东南地区LGM期间与现在相比,7月气温降低了2~5 ℃,年降水量减少60%[54].25次古气候模拟比较计划(Paleoclimate Modelling Intercomparison Project, PMIP)的平均值显示LGM时期研究区年平均气温约比现代低4.0~4.5 ℃,年降水量相对现代减少约15%[14],本研究重建的LGM时期的气温与孢粉记录和PMIP模拟结果相差不大.Xu等[56]通过重建念青唐古拉山脉西段东南坡LGM时期的冰川规模,得到当时比现代气温低2.9~4.6 ℃.Chen等[57]计算得到青藏高原东南帕隆藏布流域五条冰川LGM时期的平均为917 m,并重建得到当时的夏季气温至少比现在低6.3 ℃.Zhou等[58]重建得到波堆藏布LGM时期的约为600 m,重建得到LGM时期气温比现在低6.6 ℃左右,这与本研究所重建的派山谷地区的和气温下降值很相似,但很明显,巴松措流域LGM时期的、气温变化相比以上偏小,这可能是因为重建的两个流域的冰川发生在LGM时期内不同的阶段,但整体来看,两地LGM气温下降值的重建结果均处于以往研究所重建得到的气温下降值的范围内. ...
Luminescence chronology of late Quaternary moraines and Last Glacial Maximum equilibrium-line altitude reconstruction from Parlung Zangbo Valley, south-eastern Tibetan Plateau
1
2014
... 以上通过LR和P-T模型计算得到了LGM时期两地可能的气候情景,这些气温和降水组合有助于评估其他气候代用指标的定量重建结果.由海登湖和仁错的高分辨率孢粉记录可知,青藏高原东南地区LGM期间与现在相比,7月气温降低了2~5 ℃,年降水量减少60%[54].25次古气候模拟比较计划(Paleoclimate Modelling Intercomparison Project, PMIP)的平均值显示LGM时期研究区年平均气温约比现代低4.0~4.5 ℃,年降水量相对现代减少约15%[14],本研究重建的LGM时期的气温与孢粉记录和PMIP模拟结果相差不大.Xu等[56]通过重建念青唐古拉山脉西段东南坡LGM时期的冰川规模,得到当时比现代气温低2.9~4.6 ℃.Chen等[57]计算得到青藏高原东南帕隆藏布流域五条冰川LGM时期的平均为917 m,并重建得到当时的夏季气温至少比现在低6.3 ℃.Zhou等[58]重建得到波堆藏布LGM时期的约为600 m,重建得到LGM时期气温比现在低6.6 ℃左右,这与本研究所重建的派山谷地区的和气温下降值很相似,但很明显,巴松措流域LGM时期的、气温变化相比以上偏小,这可能是因为重建的两个流域的冰川发生在LGM时期内不同的阶段,但整体来看,两地LGM气温下降值的重建结果均处于以往研究所重建得到的气温下降值的范围内. ...
Glacial advances in southeastern Tibet during late Quaternary and their implications for climatic changes
1
2010
... 以上通过LR和P-T模型计算得到了LGM时期两地可能的气候情景,这些气温和降水组合有助于评估其他气候代用指标的定量重建结果.由海登湖和仁错的高分辨率孢粉记录可知,青藏高原东南地区LGM期间与现在相比,7月气温降低了2~5 ℃,年降水量减少60%[54].25次古气候模拟比较计划(Paleoclimate Modelling Intercomparison Project, PMIP)的平均值显示LGM时期研究区年平均气温约比现代低4.0~4.5 ℃,年降水量相对现代减少约15%[14],本研究重建的LGM时期的气温与孢粉记录和PMIP模拟结果相差不大.Xu等[56]通过重建念青唐古拉山脉西段东南坡LGM时期的冰川规模,得到当时比现代气温低2.9~4.6 ℃.Chen等[57]计算得到青藏高原东南帕隆藏布流域五条冰川LGM时期的平均为917 m,并重建得到当时的夏季气温至少比现在低6.3 ℃.Zhou等[58]重建得到波堆藏布LGM时期的约为600 m,重建得到LGM时期气温比现在低6.6 ℃左右,这与本研究所重建的派山谷地区的和气温下降值很相似,但很明显,巴松措流域LGM时期的、气温变化相比以上偏小,这可能是因为重建的两个流域的冰川发生在LGM时期内不同的阶段,但整体来看,两地LGM气温下降值的重建结果均处于以往研究所重建得到的气温下降值的范围内. ...
Glacier change in the western Nyainqentanglha Range, southern Tibet, since the Little Ice Age
1
2019
... 从10Be年龄来说,巴松措流域冰川约在19~20 ka达到现在湖出口的位置,而派山谷的冰碛10Be年代学结果显示冰川前进发生在末次冰盛期早期(~23 ka),恰好为古里雅冰芯连续记录显示的LGM最低温所出现的时段[53],两地区的气温和降水组合体现了青藏高原东南地区具体到LGM不同阶段的气候状况(图5~6).另外,张廉卿等[59]对念青唐古拉山西段冰川的研究发现平衡线高度变化主要受气候因素的影响,两地均在印度季风控制区,相对来说派山谷更靠近高原边缘,相比巴松措受到印度季风的影响更大,降水更加充沛,平衡线高度上升快.本研究的结果也支持了前人的工作,即从高原边缘到内部,从东南到西北LGM期间的逐渐减小[1].除气候因素外,两地冰川的范围以及冰底地形的复杂性都有很大不同,尤其是研究区位于东喜马拉雅构造结,地形复杂陡峻,这些因素也会对平衡线高度变化量造成一定的影响.总的来说,气温降低是该地区LGM时期ELA下降的主要原因,即在气候干燥(冰川积累量减少)的情况下,足够的低温增加了积累区面积并减少了冰川的消融[60],使冰川净积累增加,从而导致该时期冰川发生大规模冰进. ...
念青唐古拉山西段小冰期以来冰川变化
1
2019
... 从10Be年龄来说,巴松措流域冰川约在19~20 ka达到现在湖出口的位置,而派山谷的冰碛10Be年代学结果显示冰川前进发生在末次冰盛期早期(~23 ka),恰好为古里雅冰芯连续记录显示的LGM最低温所出现的时段[53],两地区的气温和降水组合体现了青藏高原东南地区具体到LGM不同阶段的气候状况(图5~6).另外,张廉卿等[59]对念青唐古拉山西段冰川的研究发现平衡线高度变化主要受气候因素的影响,两地均在印度季风控制区,相对来说派山谷更靠近高原边缘,相比巴松措受到印度季风的影响更大,降水更加充沛,平衡线高度上升快.本研究的结果也支持了前人的工作,即从高原边缘到内部,从东南到西北LGM期间的逐渐减小[1].除气候因素外,两地冰川的范围以及冰底地形的复杂性都有很大不同,尤其是研究区位于东喜马拉雅构造结,地形复杂陡峻,这些因素也会对平衡线高度变化量造成一定的影响.总的来说,气温降低是该地区LGM时期ELA下降的主要原因,即在气候干燥(冰川积累量减少)的情况下,足够的低温增加了积累区面积并减少了冰川的消融[60],使冰川净积累增加,从而导致该时期冰川发生大规模冰进. ...
Late Holocene glacier fluctuations in the Bhutanese Himalaya
1
2020
... 从10Be年龄来说,巴松措流域冰川约在19~20 ka达到现在湖出口的位置,而派山谷的冰碛10Be年代学结果显示冰川前进发生在末次冰盛期早期(~23 ka),恰好为古里雅冰芯连续记录显示的LGM最低温所出现的时段[53],两地区的气温和降水组合体现了青藏高原东南地区具体到LGM不同阶段的气候状况(图5~6).另外,张廉卿等[59]对念青唐古拉山西段冰川的研究发现平衡线高度变化主要受气候因素的影响,两地均在印度季风控制区,相对来说派山谷更靠近高原边缘,相比巴松措受到印度季风的影响更大,降水更加充沛,平衡线高度上升快.本研究的结果也支持了前人的工作,即从高原边缘到内部,从东南到西北LGM期间的逐渐减小[1].除气候因素外,两地冰川的范围以及冰底地形的复杂性都有很大不同,尤其是研究区位于东喜马拉雅构造结,地形复杂陡峻,这些因素也会对平衡线高度变化量造成一定的影响.总的来说,气温降低是该地区LGM时期ELA下降的主要原因,即在气候干燥(冰川积累量减少)的情况下,足够的低温增加了积累区面积并减少了冰川的消融[60],使冰川净积累增加,从而导致该时期冰川发生大规模冰进. ...


 甘公网安备 62010202000676号