Passive microwave remote sensing of snow depth and snow water equivalent: overview
1
2018
... 积雪是冰冻圈最为活跃的季节性要素,是全球气候变化的灵敏指示器[1].针对积雪的监测具有重要的现实意义,当前被动微波遥感在积雪监测方面具有不可替代的作用.积雪微波辐射传输模型模拟可开展过程和机理研究,仿真环境可重现积雪演变、积雪与微波相互作用等重要过程,是被动微波积雪参数——雪深和雪水当量反演算法发展的基础. ...
基于被动微波遥感的积雪深度和雪水当量反演研究进展
1
2018
... 积雪是冰冻圈最为活跃的季节性要素,是全球气候变化的灵敏指示器[1].针对积雪的监测具有重要的现实意义,当前被动微波遥感在积雪监测方面具有不可替代的作用.积雪微波辐射传输模型模拟可开展过程和机理研究,仿真环境可重现积雪演变、积雪与微波相互作用等重要过程,是被动微波积雪参数——雪深和雪水当量反演算法发展的基础. ...
Measurements of small scale spatial and temporal variability of snow depth and SWE in a small mountain catchment
1
2009
... 针对积雪的物理特性是影响空间监测的重要因素,其演变特性存在较大的空间异质性[2-3],积雪物理特性的演化影响微波辐射[4-5],从而影响雪深/雪水当量反演算法[6-7].当前计算雪深/雪水当量的算法主要是半经验线性算法[8-9],其不确定性来源于雪物理特性变化及下垫面变化和大气变化影响[4],其中雪的物理特性演变过程对算法影响较大[10].由于积雪反演算法在时间上和空间上还存在很大的不确定性,导致精度受到影响[7,11-12].通过改进算法参数来更好捕捉动态积雪演变过程,或耦合发射率模型和陆表模型,或耦合发射率模型和由天气驱动的积雪演变模型将很可能提高雪深/雪水当量反演算法准确性[13].结合实验测量的雪深等辅助信息[14]或了解积雪的先验知识[15]有助于减少雪深/雪水当量反演算法的不确定性. ...
Small scale spatial variability of snow density and depth over complex alpine terrain: Implications for estimating snow water equivalent
1
2013
... 针对积雪的物理特性是影响空间监测的重要因素,其演变特性存在较大的空间异质性[2-3],积雪物理特性的演化影响微波辐射[4-5],从而影响雪深/雪水当量反演算法[6-7].当前计算雪深/雪水当量的算法主要是半经验线性算法[8-9],其不确定性来源于雪物理特性变化及下垫面变化和大气变化影响[4],其中雪的物理特性演变过程对算法影响较大[10].由于积雪反演算法在时间上和空间上还存在很大的不确定性,导致精度受到影响[7,11-12].通过改进算法参数来更好捕捉动态积雪演变过程,或耦合发射率模型和陆表模型,或耦合发射率模型和由天气驱动的积雪演变模型将很可能提高雪深/雪水当量反演算法准确性[13].结合实验测量的雪深等辅助信息[14]或了解积雪的先验知识[15]有助于减少雪深/雪水当量反演算法的不确定性. ...
Sensitivity of passive microwave snow depth retrievals to weather effects and snow evolution
2
2006
... 针对积雪的物理特性是影响空间监测的重要因素,其演变特性存在较大的空间异质性[2-3],积雪物理特性的演化影响微波辐射[4-5],从而影响雪深/雪水当量反演算法[6-7].当前计算雪深/雪水当量的算法主要是半经验线性算法[8-9],其不确定性来源于雪物理特性变化及下垫面变化和大气变化影响[4],其中雪的物理特性演变过程对算法影响较大[10].由于积雪反演算法在时间上和空间上还存在很大的不确定性,导致精度受到影响[7,11-12].通过改进算法参数来更好捕捉动态积雪演变过程,或耦合发射率模型和陆表模型,或耦合发射率模型和由天气驱动的积雪演变模型将很可能提高雪深/雪水当量反演算法准确性[13].结合实验测量的雪深等辅助信息[14]或了解积雪的先验知识[15]有助于减少雪深/雪水当量反演算法的不确定性. ...
... [4],其中雪的物理特性演变过程对算法影响较大[10].由于积雪反演算法在时间上和空间上还存在很大的不确定性,导致精度受到影响[7,11-12].通过改进算法参数来更好捕捉动态积雪演变过程,或耦合发射率模型和陆表模型,或耦合发射率模型和由天气驱动的积雪演变模型将很可能提高雪深/雪水当量反演算法准确性[13].结合实验测量的雪深等辅助信息[14]或了解积雪的先验知识[15]有助于减少雪深/雪水当量反演算法的不确定性. ...
Observing system simulation of snow microwave emissions over data sparse regions—Part II: multilayer physics
1
2011
... 针对积雪的物理特性是影响空间监测的重要因素,其演变特性存在较大的空间异质性[2-3],积雪物理特性的演化影响微波辐射[4-5],从而影响雪深/雪水当量反演算法[6-7].当前计算雪深/雪水当量的算法主要是半经验线性算法[8-9],其不确定性来源于雪物理特性变化及下垫面变化和大气变化影响[4],其中雪的物理特性演变过程对算法影响较大[10].由于积雪反演算法在时间上和空间上还存在很大的不确定性,导致精度受到影响[7,11-12].通过改进算法参数来更好捕捉动态积雪演变过程,或耦合发射率模型和陆表模型,或耦合发射率模型和由天气驱动的积雪演变模型将很可能提高雪深/雪水当量反演算法准确性[13].结合实验测量的雪深等辅助信息[14]或了解积雪的先验知识[15]有助于减少雪深/雪水当量反演算法的不确定性. ...
Comparison of dry snow emission model with experiental measurements
1
2006
... 针对积雪的物理特性是影响空间监测的重要因素,其演变特性存在较大的空间异质性[2-3],积雪物理特性的演化影响微波辐射[4-5],从而影响雪深/雪水当量反演算法[6-7].当前计算雪深/雪水当量的算法主要是半经验线性算法[8-9],其不确定性来源于雪物理特性变化及下垫面变化和大气变化影响[4],其中雪的物理特性演变过程对算法影响较大[10].由于积雪反演算法在时间上和空间上还存在很大的不确定性,导致精度受到影响[7,11-12].通过改进算法参数来更好捕捉动态积雪演变过程,或耦合发射率模型和陆表模型,或耦合发射率模型和由天气驱动的积雪演变模型将很可能提高雪深/雪水当量反演算法准确性[13].结合实验测量的雪深等辅助信息[14]或了解积雪的先验知识[15]有助于减少雪深/雪水当量反演算法的不确定性. ...
积雪辐射模型验证
1
2006
... 针对积雪的物理特性是影响空间监测的重要因素,其演变特性存在较大的空间异质性[2-3],积雪物理特性的演化影响微波辐射[4-5],从而影响雪深/雪水当量反演算法[6-7].当前计算雪深/雪水当量的算法主要是半经验线性算法[8-9],其不确定性来源于雪物理特性变化及下垫面变化和大气变化影响[4],其中雪的物理特性演变过程对算法影响较大[10].由于积雪反演算法在时间上和空间上还存在很大的不确定性,导致精度受到影响[7,11-12].通过改进算法参数来更好捕捉动态积雪演变过程,或耦合发射率模型和陆表模型,或耦合发射率模型和由天气驱动的积雪演变模型将很可能提高雪深/雪水当量反演算法准确性[13].结合实验测量的雪深等辅助信息[14]或了解积雪的先验知识[15]有助于减少雪深/雪水当量反演算法的不确定性. ...
Review of snow water equivalent microwave remote sensing
2
... 针对积雪的物理特性是影响空间监测的重要因素,其演变特性存在较大的空间异质性[2-3],积雪物理特性的演化影响微波辐射[4-5],从而影响雪深/雪水当量反演算法[6-7].当前计算雪深/雪水当量的算法主要是半经验线性算法[8-9],其不确定性来源于雪物理特性变化及下垫面变化和大气变化影响[4],其中雪的物理特性演变过程对算法影响较大[10].由于积雪反演算法在时间上和空间上还存在很大的不确定性,导致精度受到影响[7,11-12].通过改进算法参数来更好捕捉动态积雪演变过程,或耦合发射率模型和陆表模型,或耦合发射率模型和由天气驱动的积雪演变模型将很可能提高雪深/雪水当量反演算法准确性[13].结合实验测量的雪深等辅助信息[14]或了解积雪的先验知识[15]有助于减少雪深/雪水当量反演算法的不确定性. ...
... [7,11-12].通过改进算法参数来更好捕捉动态积雪演变过程,或耦合发射率模型和陆表模型,或耦合发射率模型和由天气驱动的积雪演变模型将很可能提高雪深/雪水当量反演算法准确性[13].结合实验测量的雪深等辅助信息[14]或了解积雪的先验知识[15]有助于减少雪深/雪水当量反演算法的不确定性. ...
雪水当量主被动微波遥感研究进展
2
2016
... 针对积雪的物理特性是影响空间监测的重要因素,其演变特性存在较大的空间异质性[2-3],积雪物理特性的演化影响微波辐射[4-5],从而影响雪深/雪水当量反演算法[6-7].当前计算雪深/雪水当量的算法主要是半经验线性算法[8-9],其不确定性来源于雪物理特性变化及下垫面变化和大气变化影响[4],其中雪的物理特性演变过程对算法影响较大[10].由于积雪反演算法在时间上和空间上还存在很大的不确定性,导致精度受到影响[7,11-12].通过改进算法参数来更好捕捉动态积雪演变过程,或耦合发射率模型和陆表模型,或耦合发射率模型和由天气驱动的积雪演变模型将很可能提高雪深/雪水当量反演算法准确性[13].结合实验测量的雪深等辅助信息[14]或了解积雪的先验知识[15]有助于减少雪深/雪水当量反演算法的不确定性. ...
... [7,11-12].通过改进算法参数来更好捕捉动态积雪演变过程,或耦合发射率模型和陆表模型,或耦合发射率模型和由天气驱动的积雪演变模型将很可能提高雪深/雪水当量反演算法准确性[13].结合实验测量的雪深等辅助信息[14]或了解积雪的先验知识[15]有助于减少雪深/雪水当量反演算法的不确定性. ...
A prototype AMSR-E global snow area and snow depth algorithm
2
2003
... 针对积雪的物理特性是影响空间监测的重要因素,其演变特性存在较大的空间异质性[2-3],积雪物理特性的演化影响微波辐射[4-5],从而影响雪深/雪水当量反演算法[6-7].当前计算雪深/雪水当量的算法主要是半经验线性算法[8-9],其不确定性来源于雪物理特性变化及下垫面变化和大气变化影响[4],其中雪的物理特性演变过程对算法影响较大[10].由于积雪反演算法在时间上和空间上还存在很大的不确定性,导致精度受到影响[7,11-12].通过改进算法参数来更好捕捉动态积雪演变过程,或耦合发射率模型和陆表模型,或耦合发射率模型和由天气驱动的积雪演变模型将很可能提高雪深/雪水当量反演算法准确性[13].结合实验测量的雪深等辅助信息[14]或了解积雪的先验知识[15]有助于减少雪深/雪水当量反演算法的不确定性. ...
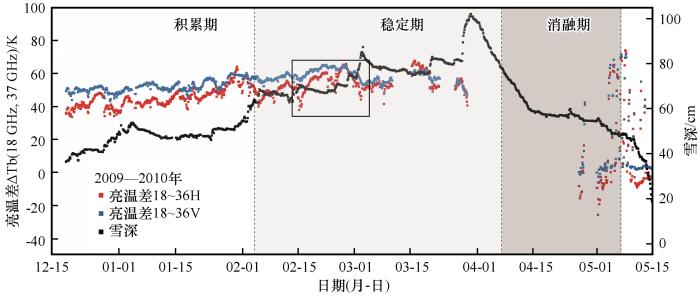
... 雪深的变化和亮温差变化在积累期和稳定期总体上具有相似性,但局部来看没有明显的一致性,这可能是由于积雪亮温还会受到如含水量、积雪粒径以及雪颗粒形状等的影响,而这些参数均随着时间变化.由上一章可知整个雪季积雪演变较大,因此需在算法中考虑随时间演化的积雪特征,已有研究考虑积雪动态变化的算法[8].微波亮温差对雪深和线性函数在不同时期依赖性不同,进一步表明提高反演算法精度需考虑参数的动态变化. ...
A Review on Passive Microwave Remote Sensing of Snow Cover
1
2007
... 针对积雪的物理特性是影响空间监测的重要因素,其演变特性存在较大的空间异质性[2-3],积雪物理特性的演化影响微波辐射[4-5],从而影响雪深/雪水当量反演算法[6-7].当前计算雪深/雪水当量的算法主要是半经验线性算法[8-9],其不确定性来源于雪物理特性变化及下垫面变化和大气变化影响[4],其中雪的物理特性演变过程对算法影响较大[10].由于积雪反演算法在时间上和空间上还存在很大的不确定性,导致精度受到影响[7,11-12].通过改进算法参数来更好捕捉动态积雪演变过程,或耦合发射率模型和陆表模型,或耦合发射率模型和由天气驱动的积雪演变模型将很可能提高雪深/雪水当量反演算法准确性[13].结合实验测量的雪深等辅助信息[14]或了解积雪的先验知识[15]有助于减少雪深/雪水当量反演算法的不确定性. ...
积雪被动微波遥感研究进展
1
2007
... 针对积雪的物理特性是影响空间监测的重要因素,其演变特性存在较大的空间异质性[2-3],积雪物理特性的演化影响微波辐射[4-5],从而影响雪深/雪水当量反演算法[6-7].当前计算雪深/雪水当量的算法主要是半经验线性算法[8-9],其不确定性来源于雪物理特性变化及下垫面变化和大气变化影响[4],其中雪的物理特性演变过程对算法影响较大[10].由于积雪反演算法在时间上和空间上还存在很大的不确定性,导致精度受到影响[7,11-12].通过改进算法参数来更好捕捉动态积雪演变过程,或耦合发射率模型和陆表模型,或耦合发射率模型和由天气驱动的积雪演变模型将很可能提高雪深/雪水当量反演算法准确性[13].结合实验测量的雪深等辅助信息[14]或了解积雪的先验知识[15]有助于减少雪深/雪水当量反演算法的不确定性. ...
Hourly simulations of the microwave brightness temperature of seasonal snow in Quebec, Canada, using a coupled snow evolution-emission model
1
2011
... 针对积雪的物理特性是影响空间监测的重要因素,其演变特性存在较大的空间异质性[2-3],积雪物理特性的演化影响微波辐射[4-5],从而影响雪深/雪水当量反演算法[6-7].当前计算雪深/雪水当量的算法主要是半经验线性算法[8-9],其不确定性来源于雪物理特性变化及下垫面变化和大气变化影响[4],其中雪的物理特性演变过程对算法影响较大[10].由于积雪反演算法在时间上和空间上还存在很大的不确定性,导致精度受到影响[7,11-12].通过改进算法参数来更好捕捉动态积雪演变过程,或耦合发射率模型和陆表模型,或耦合发射率模型和由天气驱动的积雪演变模型将很可能提高雪深/雪水当量反演算法准确性[13].结合实验测量的雪深等辅助信息[14]或了解积雪的先验知识[15]有助于减少雪深/雪水当量反演算法的不确定性. ...
Assessment of the relative accuracy of hemispheric-scale snow-cover maps
1
2002
... 针对积雪的物理特性是影响空间监测的重要因素,其演变特性存在较大的空间异质性[2-3],积雪物理特性的演化影响微波辐射[4-5],从而影响雪深/雪水当量反演算法[6-7].当前计算雪深/雪水当量的算法主要是半经验线性算法[8-9],其不确定性来源于雪物理特性变化及下垫面变化和大气变化影响[4],其中雪的物理特性演变过程对算法影响较大[10].由于积雪反演算法在时间上和空间上还存在很大的不确定性,导致精度受到影响[7,11-12].通过改进算法参数来更好捕捉动态积雪演变过程,或耦合发射率模型和陆表模型,或耦合发射率模型和由天气驱动的积雪演变模型将很可能提高雪深/雪水当量反演算法准确性[13].结合实验测量的雪深等辅助信息[14]或了解积雪的先验知识[15]有助于减少雪深/雪水当量反演算法的不确定性. ...
Remote sensing inversion of snow cover extent and snow depth/snow water equivalent on the Qinghai-Tibet Plateau: advance and challenge
1
2019
... 针对积雪的物理特性是影响空间监测的重要因素,其演变特性存在较大的空间异质性[2-3],积雪物理特性的演化影响微波辐射[4-5],从而影响雪深/雪水当量反演算法[6-7].当前计算雪深/雪水当量的算法主要是半经验线性算法[8-9],其不确定性来源于雪物理特性变化及下垫面变化和大气变化影响[4],其中雪的物理特性演变过程对算法影响较大[10].由于积雪反演算法在时间上和空间上还存在很大的不确定性,导致精度受到影响[7,11-12].通过改进算法参数来更好捕捉动态积雪演变过程,或耦合发射率模型和陆表模型,或耦合发射率模型和由天气驱动的积雪演变模型将很可能提高雪深/雪水当量反演算法准确性[13].结合实验测量的雪深等辅助信息[14]或了解积雪的先验知识[15]有助于减少雪深/雪水当量反演算法的不确定性. ...
青藏高原积雪范围和雪深/雪水当量遥感反演研究进展及挑战
1
2019
... 针对积雪的物理特性是影响空间监测的重要因素,其演变特性存在较大的空间异质性[2-3],积雪物理特性的演化影响微波辐射[4-5],从而影响雪深/雪水当量反演算法[6-7].当前计算雪深/雪水当量的算法主要是半经验线性算法[8-9],其不确定性来源于雪物理特性变化及下垫面变化和大气变化影响[4],其中雪的物理特性演变过程对算法影响较大[10].由于积雪反演算法在时间上和空间上还存在很大的不确定性,导致精度受到影响[7,11-12].通过改进算法参数来更好捕捉动态积雪演变过程,或耦合发射率模型和陆表模型,或耦合发射率模型和由天气驱动的积雪演变模型将很可能提高雪深/雪水当量反演算法准确性[13].结合实验测量的雪深等辅助信息[14]或了解积雪的先验知识[15]有助于减少雪深/雪水当量反演算法的不确定性. ...
Review of snow water equivalent retrieval methods using spaceborne passive microwave radiometry
1
2020
... 针对积雪的物理特性是影响空间监测的重要因素,其演变特性存在较大的空间异质性[2-3],积雪物理特性的演化影响微波辐射[4-5],从而影响雪深/雪水当量反演算法[6-7].当前计算雪深/雪水当量的算法主要是半经验线性算法[8-9],其不确定性来源于雪物理特性变化及下垫面变化和大气变化影响[4],其中雪的物理特性演变过程对算法影响较大[10].由于积雪反演算法在时间上和空间上还存在很大的不确定性,导致精度受到影响[7,11-12].通过改进算法参数来更好捕捉动态积雪演变过程,或耦合发射率模型和陆表模型,或耦合发射率模型和由天气驱动的积雪演变模型将很可能提高雪深/雪水当量反演算法准确性[13].结合实验测量的雪深等辅助信息[14]或了解积雪的先验知识[15]有助于减少雪深/雪水当量反演算法的不确定性. ...
Dynamic approaches for snow depth retrieval from spaceborne microwave brightness temperature
1
2010
... 针对积雪的物理特性是影响空间监测的重要因素,其演变特性存在较大的空间异质性[2-3],积雪物理特性的演化影响微波辐射[4-5],从而影响雪深/雪水当量反演算法[6-7].当前计算雪深/雪水当量的算法主要是半经验线性算法[8-9],其不确定性来源于雪物理特性变化及下垫面变化和大气变化影响[4],其中雪的物理特性演变过程对算法影响较大[10].由于积雪反演算法在时间上和空间上还存在很大的不确定性,导致精度受到影响[7,11-12].通过改进算法参数来更好捕捉动态积雪演变过程,或耦合发射率模型和陆表模型,或耦合发射率模型和由天气驱动的积雪演变模型将很可能提高雪深/雪水当量反演算法准确性[13].结合实验测量的雪深等辅助信息[14]或了解积雪的先验知识[15]有助于减少雪深/雪水当量反演算法的不确定性. ...
Snow depth and snow water equivalent estimation from AMSR-E data based on a priori snow characteristics in Xinjiang, China
1
2012
... 针对积雪的物理特性是影响空间监测的重要因素,其演变特性存在较大的空间异质性[2-3],积雪物理特性的演化影响微波辐射[4-5],从而影响雪深/雪水当量反演算法[6-7].当前计算雪深/雪水当量的算法主要是半经验线性算法[8-9],其不确定性来源于雪物理特性变化及下垫面变化和大气变化影响[4],其中雪的物理特性演变过程对算法影响较大[10].由于积雪反演算法在时间上和空间上还存在很大的不确定性,导致精度受到影响[7,11-12].通过改进算法参数来更好捕捉动态积雪演变过程,或耦合发射率模型和陆表模型,或耦合发射率模型和由天气驱动的积雪演变模型将很可能提高雪深/雪水当量反演算法准确性[13].结合实验测量的雪深等辅助信息[14]或了解积雪的先验知识[15]有助于减少雪深/雪水当量反演算法的不确定性. ...
Nordic snow radar experiment
5
2016
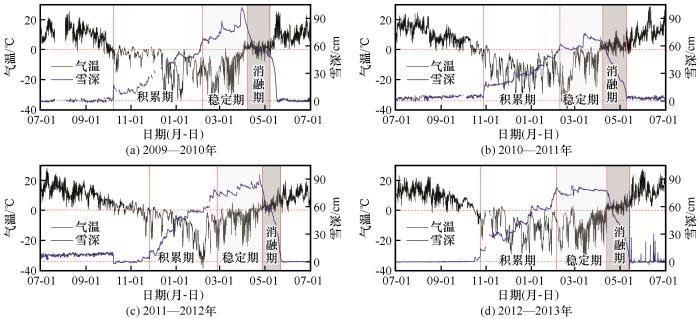
... 为应对上述挑战,论文采用在北欧地区的2009—2013年积雪地面和地基微波实验观测数据集[16-17],研究不同积雪期的分期判断方法,探讨了芬兰积雪实验场积雪特性的时间序列变化以及地基微波辐射计观测亮温差与雪深变化关系,最后采用MEMLS模型[18-20]开展积雪微波辐射的模拟、对比和分析研究. ...
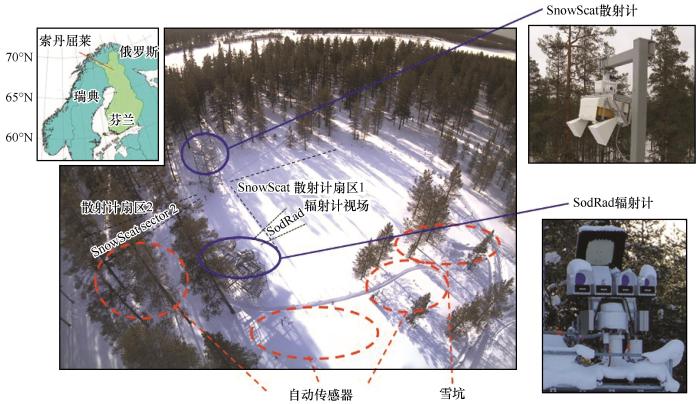
... 北欧积雪实验(Nordic Snow Radar Experiment, NoSREx)是ESA Earth Explorer 7候选任务CoReH2O [21](寒冷地区水文学高分辨率观测)中Phase A研究组成部分,该实验目的是在北极寒带森林地区的代表性地点提供整个冬季连续时间序列的地面、主被动微波积雪观测.实验区域位于芬兰气象研究所北极研究中心Sodankylä的观测站,地理位置为67.3618° N,26.6338° E(图1).实验采用了包括10.65、18.7、37、90 GHz四个频率的微波辐射计系统,其中在2011—2012年实验期间频段21 GHz替换了90 GHz,四个入射角分别为30°、40°、50°、60°,获得了水平和垂直极化下的观测亮温以及标准差.地面观测数据包括积雪参数的人工和自动测量,人工测量是指每隔3~5天进行雪坑(snow pit)观测,其参数包括雪深、密度和雪水当量、雪密度剖面、雪温度剖面、雪层评估,观测天数在2009—2013四年依次为91、31、23、32天.自动测量参数包括温度、露点温度、风速、气压、雪深、地表湿度和温度、气温、雪水当量等,每天共测量8次,每次间隔3小时,观测天数在2009—2013年依次为365、365、366、365天[16]. ...
... [
16]
Webcam image of NoSREx IOA and photographs of main microwave instruments, the SnowScat scatterometer and the SodRad radiometer system<sup>[<xref ref-type="bibr" rid="R16">16</xref>]</sup>Fig.1![]()
该数据集已用于积雪相关模型模拟[22-23]、反演积雪参数[24-25]、改进算法[26]、耦合雪物理和辐射传输模型[27-29]、分析观测数据[29-31]等研究. ...
... [
16]
Fig.1![]()
该数据集已用于积雪相关模型模拟[22-23]、反演积雪参数[24-25]、改进算法[26]、耦合雪物理和辐射传输模型[27-29]、分析观测数据[29-31]等研究. ...
... MEMLS模型输入包括频率、入射角、天空背景亮度温度、散射系数、积雪参数、地表温度以及积雪-土壤界面反射率[19].天空背景的亮度温度所需的大气透射率参照Pulliainen等[32-33]的提出的统计反演方法,天空背景亮度温度所需的上下行大气亮度温度由Aschbache[34]提出的公式估算.散射系数参照Matzler等[18]的工作,采用玻恩近似计算.输入的积雪参数包括积雪层数、积雪温度、积雪湿度、积雪密度、积雪盐度、积雪厚度,指数相关长度,指数相关长度采用Durand等[35]的经验公式通过积雪粒径估算,其他参数由NoSREx实验的地面测量获得[16].陆地积雪的盐度通常认为是0[36-37],本次模拟也将积雪盐度设为0.地表温度由NoSREx实验的地面测量数据获得.水平极化和垂直极化的积雪-土壤界面反射率,本研究是利用Wang & Choudhury(1981)半经验模型(简称QHN)计算[38-39].QHN模型中所需的土壤介电常数采用Dobson模型计算[40].土壤-雪界面的粗糙程度通过土壤粗糙度来反映[41-42].土壤粗糙度通常用均方根高度和表面相关长度两个统计变量表示,其具体定义可见文献[43-44].土壤粗糙度较难直接测量,通常采用最小化成本函数(cost function)[45-48]的方法估算.本研究选用的代价函数如下: ...
Sodankyla manual snow survey program
1
2016
... 为应对上述挑战,论文采用在北欧地区的2009—2013年积雪地面和地基微波实验观测数据集[16-17],研究不同积雪期的分期判断方法,探讨了芬兰积雪实验场积雪特性的时间序列变化以及地基微波辐射计观测亮温差与雪深变化关系,最后采用MEMLS模型[18-20]开展积雪微波辐射的模拟、对比和分析研究. ...
Extension of the microwave emission model of layered snowpacks to coarse-grained snow
4
1999
... 为应对上述挑战,论文采用在北欧地区的2009—2013年积雪地面和地基微波实验观测数据集[16-17],研究不同积雪期的分期判断方法,探讨了芬兰积雪实验场积雪特性的时间序列变化以及地基微波辐射计观测亮温差与雪深变化关系,最后采用MEMLS模型[18-20]开展积雪微波辐射的模拟、对比和分析研究. ...
... 多层积雪微波辐射传输模型(MEMLS)是由Wiesmann等[18-19]开发的一个针对多层积雪的被动微波辐射传输模型,适用频率范围为5~100 GHz.它以辐射传输为基础,将积雪根据物理特性分为多层,利用六流近似理论来描述每个雪层内部的多次散射与吸收,同时考虑了雪层之间的界面散射.由于模型在特定环境下开发,在不同环境下的适应性不同,为了将其有效应用到芬兰积雪试验场,在该研究中需要调整模型的输入参数地表均方根高度参数的值. ...
... MEMLS模型输入包括频率、入射角、天空背景亮度温度、散射系数、积雪参数、地表温度以及积雪-土壤界面反射率[19].天空背景的亮度温度所需的大气透射率参照Pulliainen等[32-33]的提出的统计反演方法,天空背景亮度温度所需的上下行大气亮度温度由Aschbache[34]提出的公式估算.散射系数参照Matzler等[18]的工作,采用玻恩近似计算.输入的积雪参数包括积雪层数、积雪温度、积雪湿度、积雪密度、积雪盐度、积雪厚度,指数相关长度,指数相关长度采用Durand等[35]的经验公式通过积雪粒径估算,其他参数由NoSREx实验的地面测量获得[16].陆地积雪的盐度通常认为是0[36-37],本次模拟也将积雪盐度设为0.地表温度由NoSREx实验的地面测量数据获得.水平极化和垂直极化的积雪-土壤界面反射率,本研究是利用Wang & Choudhury(1981)半经验模型(简称QHN)计算[38-39].QHN模型中所需的土壤介电常数采用Dobson模型计算[40].土壤-雪界面的粗糙程度通过土壤粗糙度来反映[41-42].土壤粗糙度通常用均方根高度和表面相关长度两个统计变量表示,其具体定义可见文献[43-44].土壤粗糙度较难直接测量,通常采用最小化成本函数(cost function)[45-48]的方法估算.本研究选用的代价函数如下: ...
... 模型模拟所需要的土壤粗糙度参数较难直接测量,且其对模型模拟结果有一定影响,在模拟前需要确定土壤粗糙度参数的值.地表均方根高度的值由土壤本身的性质决定,不同情况下该数值可以在数毫米到几十毫米之间变化[39].采用1.3.2章节所述方法,得出的不同频率和入射角的最优值(表2),大多数情况下,在值为0.001 m时均方根误差最小,因此在模拟时将垂直和水平极化下的地表粗糙度值均设为0.001 m.潘金梅等[18-20]的研究表明Sodankylä地区的地表均方根高度大约为0.001 m,与本研究的估算结果吻合. ...
Microwave emission model of layered snowpacks
2
1999
... 多层积雪微波辐射传输模型(MEMLS)是由Wiesmann等[18-19]开发的一个针对多层积雪的被动微波辐射传输模型,适用频率范围为5~100 GHz.它以辐射传输为基础,将积雪根据物理特性分为多层,利用六流近似理论来描述每个雪层内部的多次散射与吸收,同时考虑了雪层之间的界面散射.由于模型在特定环境下开发,在不同环境下的适应性不同,为了将其有效应用到芬兰积雪试验场,在该研究中需要调整模型的输入参数地表均方根高度参数的值. ...
... MEMLS模型输入包括频率、入射角、天空背景亮度温度、散射系数、积雪参数、地表温度以及积雪-土壤界面反射率[19].天空背景的亮度温度所需的大气透射率参照Pulliainen等[32-33]的提出的统计反演方法,天空背景亮度温度所需的上下行大气亮度温度由Aschbache[34]提出的公式估算.散射系数参照Matzler等[18]的工作,采用玻恩近似计算.输入的积雪参数包括积雪层数、积雪温度、积雪湿度、积雪密度、积雪盐度、积雪厚度,指数相关长度,指数相关长度采用Durand等[35]的经验公式通过积雪粒径估算,其他参数由NoSREx实验的地面测量获得[16].陆地积雪的盐度通常认为是0[36-37],本次模拟也将积雪盐度设为0.地表温度由NoSREx实验的地面测量数据获得.水平极化和垂直极化的积雪-土壤界面反射率,本研究是利用Wang & Choudhury(1981)半经验模型(简称QHN)计算[38-39].QHN模型中所需的土壤介电常数采用Dobson模型计算[40].土壤-雪界面的粗糙程度通过土壤粗糙度来反映[41-42].土壤粗糙度通常用均方根高度和表面相关长度两个统计变量表示,其具体定义可见文献[43-44].土壤粗糙度较难直接测量,通常采用最小化成本函数(cost function)[45-48]的方法估算.本研究选用的代价函数如下: ...
Differences between the HUT snow emission model and MEMLS and their effects on brightness temperature simulation
3
2016
... 为应对上述挑战,论文采用在北欧地区的2009—2013年积雪地面和地基微波实验观测数据集[16-17],研究不同积雪期的分期判断方法,探讨了芬兰积雪实验场积雪特性的时间序列变化以及地基微波辐射计观测亮温差与雪深变化关系,最后采用MEMLS模型[18-20]开展积雪微波辐射的模拟、对比和分析研究. ...
... 模型模拟所需要的土壤粗糙度参数较难直接测量,且其对模型模拟结果有一定影响,在模拟前需要确定土壤粗糙度参数的值.地表均方根高度的值由土壤本身的性质决定,不同情况下该数值可以在数毫米到几十毫米之间变化[39].采用1.3.2章节所述方法,得出的不同频率和入射角的最优值(表2),大多数情况下,在值为0.001 m时均方根误差最小,因此在模拟时将垂直和水平极化下的地表粗糙度值均设为0.001 m.潘金梅等[18-20]的研究表明Sodankylä地区的地表均方根高度大约为0.001 m,与本研究的估算结果吻合. ...
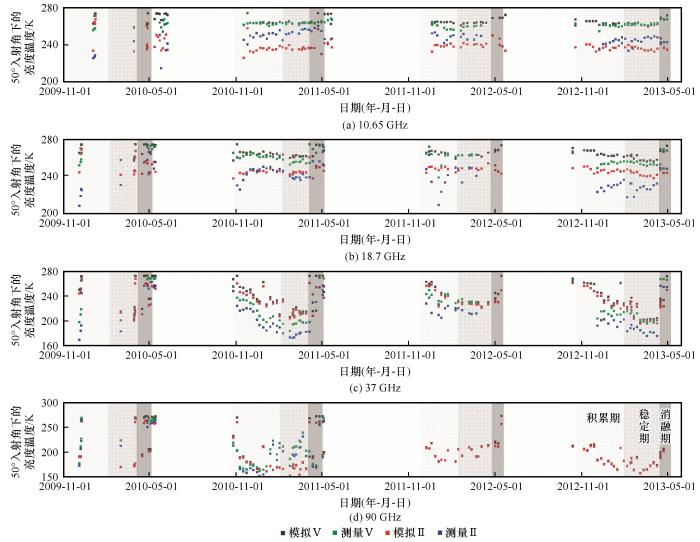
... MEMLS模型输入的地表均方根高度参数设为0.001 m[20]较为适合芬兰实验环境,校正后的MEMLS模型在较低频率(10.65 GHz、18.7 GHz),较高入射角(50°和60°)且垂直极化下能更好的模拟地基辐射计观测亮温.3个雪期均在低频(10.65 GHz和18.7 GHz)的垂直极化下,模拟结果较好.在稳定期的10.65 GHz、50°入射角且垂直极化下模拟结果最佳,RMSE最低为2.49 K.对于37 GHz且垂直极化下,稳定期的模拟效果较积累期和消融期更好,这表明根据气温和雪深变化来分类积雪期,可更好的表征积雪演化对微波辐射信号的影响.模拟结果在低频段(10.65 GHz和18.7 GHz)较好,可考虑结合较低频段来改进反演算法. ...
CoReH2O: high-resolution X/Ku-band radar imaging of cold land processes
2
2013
... 北欧积雪实验(Nordic Snow Radar Experiment, NoSREx)是ESA Earth Explorer 7候选任务CoReH2O [21](寒冷地区水文学高分辨率观测)中Phase A研究组成部分,该实验目的是在北极寒带森林地区的代表性地点提供整个冬季连续时间序列的地面、主被动微波积雪观测.实验区域位于芬兰气象研究所北极研究中心Sodankylä的观测站,地理位置为67.3618° N,26.6338° E(图1).实验采用了包括10.65、18.7、37、90 GHz四个频率的微波辐射计系统,其中在2011—2012年实验期间频段21 GHz替换了90 GHz,四个入射角分别为30°、40°、50°、60°,获得了水平和垂直极化下的观测亮温以及标准差.地面观测数据包括积雪参数的人工和自动测量,人工测量是指每隔3~5天进行雪坑(snow pit)观测,其参数包括雪深、密度和雪水当量、雪密度剖面、雪温度剖面、雪层评估,观测天数在2009—2013四年依次为91、31、23、32天.自动测量参数包括温度、露点温度、风速、气压、雪深、地表湿度和温度、气温、雪水当量等,每天共测量8次,每次间隔3小时,观测天数在2009—2013年依次为365、365、366、365天[16]. ...
... 为研究线性亮温梯度算法(18 GHz和37 GHz,V和H)在北欧实验区域的适用性,分析了微波亮温差对雪深变化的依赖性(图5).积累期(12月—次年2月)和稳定期前期(2—3月),雪深和亮温差(18~37 GHz)整体来看具有一致的变化趋势,局部来看具有相反的波动性,即雪深小幅度减小亮温差反向增加,如图5中矩形框中的部分:黑线和锯齿形状的红色和蓝色曲线反向波动,这可能是由于融雪使得亮温差减小,而后积雪重新冻结亮温差增大.在稳定期后期(3—4月),由于3月雪深均大于60 cm,亮温差对雪深增加不再敏感趋于饱和,体现了算法的局限性[21];局部反向现象较之前不明显,这可能是由于早期融雪形成的雪壳结构逐渐松弛为更典型的冬末降雪[31],雪粒径和雪颗粒形状均改变.在消融期(4—5月),随着积雪迅速融化雪深减小,亮温差值波动性较大基本维持在±15 K以内,亮温差与雪深线性相关性不明显. ...
Bicontinuous/DMRT model applied to active and passive microwave remote sensing of terrestrial snow
1
2014
... 该数据集已用于积雪相关模型模拟[22-23]、反演积雪参数[24-25]、改进算法[26]、耦合雪物理和辐射传输模型[27-29]、分析观测数据[29-31]等研究. ...
Modeling both active and passive microwave remote sensing of snow using Dense Media Radiative Transfer (DMRT) theory with multiple scattering and backscattering enhancement
1
2015
... 该数据集已用于积雪相关模型模拟[22-23]、反演积雪参数[24-25]、改进算法[26]、耦合雪物理和辐射传输模型[27-29]、分析观测数据[29-31]等研究. ...
Snow properties retrieval using TerraSAR-X dual-polarization data
1
2012
... 该数据集已用于积雪相关模型模拟[22-23]、反演积雪参数[24-25]、改进算法[26]、耦合雪物理和辐射传输模型[27-29]、分析观测数据[29-31]等研究. ...
Estimating Snow Water Equivalent with Backscattering at X and Ku Band Based on Absorption Loss
1
2016
... 该数据集已用于积雪相关模型模拟[22-23]、反演积雪参数[24-25]、改进算法[26]、耦合雪物理和辐射传输模型[27-29]、分析观测数据[29-31]等研究. ...
Refinement of the X and Ku band dual-polarization scatterometer snow water equivalent retrieval algorithm
1
2014
... 该数据集已用于积雪相关模型模拟[22-23]、反演积雪参数[24-25]、改进算法[26]、耦合雪物理和辐射传输模型[27-29]、分析观测数据[29-31]等研究. ...
Coupling SNOWPACK-modeled grain size parameters with the HUT snow emission model
1
2017
... 该数据集已用于积雪相关模型模拟[22-23]、反演积雪参数[24-25]、改进算法[26]、耦合雪物理和辐射传输模型[27-29]、分析观测数据[29-31]等研究. ...
Evaluation of brightness temperature sensitivity to snowpack physical properties using coupled snow physics and microwave radiative transfer models
0
2019
Interpreting snowpack radiometry using currently existing microwave radiative transfer models
2
2015
... 该数据集已用于积雪相关模型模拟[22-23]、反演积雪参数[24-25]、改进算法[26]、耦合雪物理和辐射传输模型[27-29]、分析观测数据[29-31]等研究. ...
... [29-31]等研究. ...
Analysis of active and passive microwave observations from the NoSREx campaign
0
2011
Observations of seasonal snow cover at X and Ku bands during the NoSREx campaign
2
2014
... 该数据集已用于积雪相关模型模拟[22-23]、反演积雪参数[24-25]、改进算法[26]、耦合雪物理和辐射传输模型[27-29]、分析观测数据[29-31]等研究. ...
... 为研究线性亮温梯度算法(18 GHz和37 GHz,V和H)在北欧实验区域的适用性,分析了微波亮温差对雪深变化的依赖性(图5).积累期(12月—次年2月)和稳定期前期(2—3月),雪深和亮温差(18~37 GHz)整体来看具有一致的变化趋势,局部来看具有相反的波动性,即雪深小幅度减小亮温差反向增加,如图5中矩形框中的部分:黑线和锯齿形状的红色和蓝色曲线反向波动,这可能是由于融雪使得亮温差减小,而后积雪重新冻结亮温差增大.在稳定期后期(3—4月),由于3月雪深均大于60 cm,亮温差对雪深增加不再敏感趋于饱和,体现了算法的局限性[21];局部反向现象较之前不明显,这可能是由于早期融雪形成的雪壳结构逐渐松弛为更典型的冬末降雪[31],雪粒径和雪颗粒形状均改变.在消融期(4—5月),随着积雪迅速融化雪深减小,亮温差值波动性较大基本维持在±15 K以内,亮温差与雪深线性相关性不明显. ...
Development of geophysical retrieval algorithms for the MIMR
1
1993
... MEMLS模型输入包括频率、入射角、天空背景亮度温度、散射系数、积雪参数、地表温度以及积雪-土壤界面反射率[19].天空背景的亮度温度所需的大气透射率参照Pulliainen等[32-33]的提出的统计反演方法,天空背景亮度温度所需的上下行大气亮度温度由Aschbache[34]提出的公式估算.散射系数参照Matzler等[18]的工作,采用玻恩近似计算.输入的积雪参数包括积雪层数、积雪温度、积雪湿度、积雪密度、积雪盐度、积雪厚度,指数相关长度,指数相关长度采用Durand等[35]的经验公式通过积雪粒径估算,其他参数由NoSREx实验的地面测量获得[16].陆地积雪的盐度通常认为是0[36-37],本次模拟也将积雪盐度设为0.地表温度由NoSREx实验的地面测量数据获得.水平极化和垂直极化的积雪-土壤界面反射率,本研究是利用Wang & Choudhury(1981)半经验模型(简称QHN)计算[38-39].QHN模型中所需的土壤介电常数采用Dobson模型计算[40].土壤-雪界面的粗糙程度通过土壤粗糙度来反映[41-42].土壤粗糙度通常用均方根高度和表面相关长度两个统计变量表示,其具体定义可见文献[43-44].土壤粗糙度较难直接测量,通常采用最小化成本函数(cost function)[45-48]的方法估算.本研究选用的代价函数如下: ...
Retrieval of surface temperature in boreal forest zone from SSM/I data
1
1997
... MEMLS模型输入包括频率、入射角、天空背景亮度温度、散射系数、积雪参数、地表温度以及积雪-土壤界面反射率[19].天空背景的亮度温度所需的大气透射率参照Pulliainen等[32-33]的提出的统计反演方法,天空背景亮度温度所需的上下行大气亮度温度由Aschbache[34]提出的公式估算.散射系数参照Matzler等[18]的工作,采用玻恩近似计算.输入的积雪参数包括积雪层数、积雪温度、积雪湿度、积雪密度、积雪盐度、积雪厚度,指数相关长度,指数相关长度采用Durand等[35]的经验公式通过积雪粒径估算,其他参数由NoSREx实验的地面测量获得[16].陆地积雪的盐度通常认为是0[36-37],本次模拟也将积雪盐度设为0.地表温度由NoSREx实验的地面测量数据获得.水平极化和垂直极化的积雪-土壤界面反射率,本研究是利用Wang & Choudhury(1981)半经验模型(简称QHN)计算[38-39].QHN模型中所需的土壤介电常数采用Dobson模型计算[40].土壤-雪界面的粗糙程度通过土壤粗糙度来反映[41-42].土壤粗糙度通常用均方根高度和表面相关长度两个统计变量表示,其具体定义可见文献[43-44].土壤粗糙度较难直接测量,通常采用最小化成本函数(cost function)[45-48]的方法估算.本研究选用的代价函数如下: ...
Land surface studies and atmospheric effects by satellite microwave radiometry
1
1993
... MEMLS模型输入包括频率、入射角、天空背景亮度温度、散射系数、积雪参数、地表温度以及积雪-土壤界面反射率[19].天空背景的亮度温度所需的大气透射率参照Pulliainen等[32-33]的提出的统计反演方法,天空背景亮度温度所需的上下行大气亮度温度由Aschbache[34]提出的公式估算.散射系数参照Matzler等[18]的工作,采用玻恩近似计算.输入的积雪参数包括积雪层数、积雪温度、积雪湿度、积雪密度、积雪盐度、积雪厚度,指数相关长度,指数相关长度采用Durand等[35]的经验公式通过积雪粒径估算,其他参数由NoSREx实验的地面测量获得[16].陆地积雪的盐度通常认为是0[36-37],本次模拟也将积雪盐度设为0.地表温度由NoSREx实验的地面测量数据获得.水平极化和垂直极化的积雪-土壤界面反射率,本研究是利用Wang & Choudhury(1981)半经验模型(简称QHN)计算[38-39].QHN模型中所需的土壤介电常数采用Dobson模型计算[40].土壤-雪界面的粗糙程度通过土壤粗糙度来反映[41-42].土壤粗糙度通常用均方根高度和表面相关长度两个统计变量表示,其具体定义可见文献[43-44].土壤粗糙度较难直接测量,通常采用最小化成本函数(cost function)[45-48]的方法估算.本研究选用的代价函数如下: ...
Quantifying uncertainty in modeling snow microwave radiance for a mountain snowpack at the point-scale, including stratigraphic effects
1
2008
... MEMLS模型输入包括频率、入射角、天空背景亮度温度、散射系数、积雪参数、地表温度以及积雪-土壤界面反射率[19].天空背景的亮度温度所需的大气透射率参照Pulliainen等[32-33]的提出的统计反演方法,天空背景亮度温度所需的上下行大气亮度温度由Aschbache[34]提出的公式估算.散射系数参照Matzler等[18]的工作,采用玻恩近似计算.输入的积雪参数包括积雪层数、积雪温度、积雪湿度、积雪密度、积雪盐度、积雪厚度,指数相关长度,指数相关长度采用Durand等[35]的经验公式通过积雪粒径估算,其他参数由NoSREx实验的地面测量获得[16].陆地积雪的盐度通常认为是0[36-37],本次模拟也将积雪盐度设为0.地表温度由NoSREx实验的地面测量数据获得.水平极化和垂直极化的积雪-土壤界面反射率,本研究是利用Wang & Choudhury(1981)半经验模型(简称QHN)计算[38-39].QHN模型中所需的土壤介电常数采用Dobson模型计算[40].土壤-雪界面的粗糙程度通过土壤粗糙度来反映[41-42].土壤粗糙度通常用均方根高度和表面相关长度两个统计变量表示,其具体定义可见文献[43-44].土壤粗糙度较难直接测量,通常采用最小化成本函数(cost function)[45-48]的方法估算.本研究选用的代价函数如下: ...
Snow Depth Retrieval in Farmland Based on a Statistical Lookup Table from Passive Microwave Data in Northeast China
1
2019
... MEMLS模型输入包括频率、入射角、天空背景亮度温度、散射系数、积雪参数、地表温度以及积雪-土壤界面反射率[19].天空背景的亮度温度所需的大气透射率参照Pulliainen等[32-33]的提出的统计反演方法,天空背景亮度温度所需的上下行大气亮度温度由Aschbache[34]提出的公式估算.散射系数参照Matzler等[18]的工作,采用玻恩近似计算.输入的积雪参数包括积雪层数、积雪温度、积雪湿度、积雪密度、积雪盐度、积雪厚度,指数相关长度,指数相关长度采用Durand等[35]的经验公式通过积雪粒径估算,其他参数由NoSREx实验的地面测量获得[16].陆地积雪的盐度通常认为是0[36-37],本次模拟也将积雪盐度设为0.地表温度由NoSREx实验的地面测量数据获得.水平极化和垂直极化的积雪-土壤界面反射率,本研究是利用Wang & Choudhury(1981)半经验模型(简称QHN)计算[38-39].QHN模型中所需的土壤介电常数采用Dobson模型计算[40].土壤-雪界面的粗糙程度通过土壤粗糙度来反映[41-42].土壤粗糙度通常用均方根高度和表面相关长度两个统计变量表示,其具体定义可见文献[43-44].土壤粗糙度较难直接测量,通常采用最小化成本函数(cost function)[45-48]的方法估算.本研究选用的代价函数如下: ...
Tundra snow emissivities at MHS frequencies: MEMLS validation using airborne microwave data measured during CLPX-II
1
2012
... MEMLS模型输入包括频率、入射角、天空背景亮度温度、散射系数、积雪参数、地表温度以及积雪-土壤界面反射率[19].天空背景的亮度温度所需的大气透射率参照Pulliainen等[32-33]的提出的统计反演方法,天空背景亮度温度所需的上下行大气亮度温度由Aschbache[34]提出的公式估算.散射系数参照Matzler等[18]的工作,采用玻恩近似计算.输入的积雪参数包括积雪层数、积雪温度、积雪湿度、积雪密度、积雪盐度、积雪厚度,指数相关长度,指数相关长度采用Durand等[35]的经验公式通过积雪粒径估算,其他参数由NoSREx实验的地面测量获得[16].陆地积雪的盐度通常认为是0[36-37],本次模拟也将积雪盐度设为0.地表温度由NoSREx实验的地面测量数据获得.水平极化和垂直极化的积雪-土壤界面反射率,本研究是利用Wang & Choudhury(1981)半经验模型(简称QHN)计算[38-39].QHN模型中所需的土壤介电常数采用Dobson模型计算[40].土壤-雪界面的粗糙程度通过土壤粗糙度来反映[41-42].土壤粗糙度通常用均方根高度和表面相关长度两个统计变量表示,其具体定义可见文献[43-44].土壤粗糙度较难直接测量,通常采用最小化成本函数(cost function)[45-48]的方法估算.本研究选用的代价函数如下: ...
Remote sensing of soil moisture content, over bare field at 1.4 GHz frequency
2
1981
... MEMLS模型输入包括频率、入射角、天空背景亮度温度、散射系数、积雪参数、地表温度以及积雪-土壤界面反射率[19].天空背景的亮度温度所需的大气透射率参照Pulliainen等[32-33]的提出的统计反演方法,天空背景亮度温度所需的上下行大气亮度温度由Aschbache[34]提出的公式估算.散射系数参照Matzler等[18]的工作,采用玻恩近似计算.输入的积雪参数包括积雪层数、积雪温度、积雪湿度、积雪密度、积雪盐度、积雪厚度,指数相关长度,指数相关长度采用Durand等[35]的经验公式通过积雪粒径估算,其他参数由NoSREx实验的地面测量获得[16].陆地积雪的盐度通常认为是0[36-37],本次模拟也将积雪盐度设为0.地表温度由NoSREx实验的地面测量数据获得.水平极化和垂直极化的积雪-土壤界面反射率,本研究是利用Wang & Choudhury(1981)半经验模型(简称QHN)计算[38-39].QHN模型中所需的土壤介电常数采用Dobson模型计算[40].土壤-雪界面的粗糙程度通过土壤粗糙度来反映[41-42].土壤粗糙度通常用均方根高度和表面相关长度两个统计变量表示,其具体定义可见文献[43-44].土壤粗糙度较难直接测量,通常采用最小化成本函数(cost function)[45-48]的方法估算.本研究选用的代价函数如下: ...
... [38-39].QHN模型中所需的土壤介电常数采用Dobson模型计算[40].土壤-雪界面的粗糙程度通过土壤粗糙度来反映[41-42].土壤粗糙度通常用均方根高度和表面相关长度两个统计变量表示,其具体定义可见文献[43-44].土壤粗糙度较难直接测量,通常采用最小化成本函数(cost function)[45-48]的方法估算.本研究选用的代价函数如下: ...
Evaluation of multi-frequency bare soil microwave reflectivity models
2
2015
... MEMLS模型输入包括频率、入射角、天空背景亮度温度、散射系数、积雪参数、地表温度以及积雪-土壤界面反射率[19].天空背景的亮度温度所需的大气透射率参照Pulliainen等[32-33]的提出的统计反演方法,天空背景亮度温度所需的上下行大气亮度温度由Aschbache[34]提出的公式估算.散射系数参照Matzler等[18]的工作,采用玻恩近似计算.输入的积雪参数包括积雪层数、积雪温度、积雪湿度、积雪密度、积雪盐度、积雪厚度,指数相关长度,指数相关长度采用Durand等[35]的经验公式通过积雪粒径估算,其他参数由NoSREx实验的地面测量获得[16].陆地积雪的盐度通常认为是0[36-37],本次模拟也将积雪盐度设为0.地表温度由NoSREx实验的地面测量数据获得.水平极化和垂直极化的积雪-土壤界面反射率,本研究是利用Wang & Choudhury(1981)半经验模型(简称QHN)计算[38-39].QHN模型中所需的土壤介电常数采用Dobson模型计算[40].土壤-雪界面的粗糙程度通过土壤粗糙度来反映[41-42].土壤粗糙度通常用均方根高度和表面相关长度两个统计变量表示,其具体定义可见文献[43-44].土壤粗糙度较难直接测量,通常采用最小化成本函数(cost function)[45-48]的方法估算.本研究选用的代价函数如下: ...
... 模型模拟所需要的土壤粗糙度参数较难直接测量,且其对模型模拟结果有一定影响,在模拟前需要确定土壤粗糙度参数的值.地表均方根高度的值由土壤本身的性质决定,不同情况下该数值可以在数毫米到几十毫米之间变化[39].采用1.3.2章节所述方法,得出的不同频率和入射角的最优值(表2),大多数情况下,在值为0.001 m时均方根误差最小,因此在模拟时将垂直和水平极化下的地表粗糙度值均设为0.001 m.潘金梅等[18-20]的研究表明Sodankylä地区的地表均方根高度大约为0.001 m,与本研究的估算结果吻合. ...
Microwave dielectric behavior of wet soil-Part II: dielectric mixing models
1
1985
... MEMLS模型输入包括频率、入射角、天空背景亮度温度、散射系数、积雪参数、地表温度以及积雪-土壤界面反射率[19].天空背景的亮度温度所需的大气透射率参照Pulliainen等[32-33]的提出的统计反演方法,天空背景亮度温度所需的上下行大气亮度温度由Aschbache[34]提出的公式估算.散射系数参照Matzler等[18]的工作,采用玻恩近似计算.输入的积雪参数包括积雪层数、积雪温度、积雪湿度、积雪密度、积雪盐度、积雪厚度,指数相关长度,指数相关长度采用Durand等[35]的经验公式通过积雪粒径估算,其他参数由NoSREx实验的地面测量获得[16].陆地积雪的盐度通常认为是0[36-37],本次模拟也将积雪盐度设为0.地表温度由NoSREx实验的地面测量数据获得.水平极化和垂直极化的积雪-土壤界面反射率,本研究是利用Wang & Choudhury(1981)半经验模型(简称QHN)计算[38-39].QHN模型中所需的土壤介电常数采用Dobson模型计算[40].土壤-雪界面的粗糙程度通过土壤粗糙度来反映[41-42].土壤粗糙度通常用均方根高度和表面相关长度两个统计变量表示,其具体定义可见文献[43-44].土壤粗糙度较难直接测量,通常采用最小化成本函数(cost function)[45-48]的方法估算.本研究选用的代价函数如下: ...
Inversely calculating the roughness of bare soil surface in cold-arid irrigation regions using the SAR method
1
2017
... MEMLS模型输入包括频率、入射角、天空背景亮度温度、散射系数、积雪参数、地表温度以及积雪-土壤界面反射率[19].天空背景的亮度温度所需的大气透射率参照Pulliainen等[32-33]的提出的统计反演方法,天空背景亮度温度所需的上下行大气亮度温度由Aschbache[34]提出的公式估算.散射系数参照Matzler等[18]的工作,采用玻恩近似计算.输入的积雪参数包括积雪层数、积雪温度、积雪湿度、积雪密度、积雪盐度、积雪厚度,指数相关长度,指数相关长度采用Durand等[35]的经验公式通过积雪粒径估算,其他参数由NoSREx实验的地面测量获得[16].陆地积雪的盐度通常认为是0[36-37],本次模拟也将积雪盐度设为0.地表温度由NoSREx实验的地面测量数据获得.水平极化和垂直极化的积雪-土壤界面反射率,本研究是利用Wang & Choudhury(1981)半经验模型(简称QHN)计算[38-39].QHN模型中所需的土壤介电常数采用Dobson模型计算[40].土壤-雪界面的粗糙程度通过土壤粗糙度来反映[41-42].土壤粗糙度通常用均方根高度和表面相关长度两个统计变量表示,其具体定义可见文献[43-44].土壤粗糙度较难直接测量,通常采用最小化成本函数(cost function)[45-48]的方法估算.本研究选用的代价函数如下: ...
西北寒旱灌区裸露地表粗糙度SAR反演建模方法研究
1
2017
... MEMLS模型输入包括频率、入射角、天空背景亮度温度、散射系数、积雪参数、地表温度以及积雪-土壤界面反射率[19].天空背景的亮度温度所需的大气透射率参照Pulliainen等[32-33]的提出的统计反演方法,天空背景亮度温度所需的上下行大气亮度温度由Aschbache[34]提出的公式估算.散射系数参照Matzler等[18]的工作,采用玻恩近似计算.输入的积雪参数包括积雪层数、积雪温度、积雪湿度、积雪密度、积雪盐度、积雪厚度,指数相关长度,指数相关长度采用Durand等[35]的经验公式通过积雪粒径估算,其他参数由NoSREx实验的地面测量获得[16].陆地积雪的盐度通常认为是0[36-37],本次模拟也将积雪盐度设为0.地表温度由NoSREx实验的地面测量数据获得.水平极化和垂直极化的积雪-土壤界面反射率,本研究是利用Wang & Choudhury(1981)半经验模型(简称QHN)计算[38-39].QHN模型中所需的土壤介电常数采用Dobson模型计算[40].土壤-雪界面的粗糙程度通过土壤粗糙度来反映[41-42].土壤粗糙度通常用均方根高度和表面相关长度两个统计变量表示,其具体定义可见文献[43-44].土壤粗糙度较难直接测量,通常采用最小化成本函数(cost function)[45-48]的方法估算.本研究选用的代价函数如下: ...
Tillage and soil type effects on soil surface roughness at semiarid climatic conditions
1
2008
... MEMLS模型输入包括频率、入射角、天空背景亮度温度、散射系数、积雪参数、地表温度以及积雪-土壤界面反射率[19].天空背景的亮度温度所需的大气透射率参照Pulliainen等[32-33]的提出的统计反演方法,天空背景亮度温度所需的上下行大气亮度温度由Aschbache[34]提出的公式估算.散射系数参照Matzler等[18]的工作,采用玻恩近似计算.输入的积雪参数包括积雪层数、积雪温度、积雪湿度、积雪密度、积雪盐度、积雪厚度,指数相关长度,指数相关长度采用Durand等[35]的经验公式通过积雪粒径估算,其他参数由NoSREx实验的地面测量获得[16].陆地积雪的盐度通常认为是0[36-37],本次模拟也将积雪盐度设为0.地表温度由NoSREx实验的地面测量数据获得.水平极化和垂直极化的积雪-土壤界面反射率,本研究是利用Wang & Choudhury(1981)半经验模型(简称QHN)计算[38-39].QHN模型中所需的土壤介电常数采用Dobson模型计算[40].土壤-雪界面的粗糙程度通过土壤粗糙度来反映[41-42].土壤粗糙度通常用均方根高度和表面相关长度两个统计变量表示,其具体定义可见文献[43-44].土壤粗糙度较难直接测量,通常采用最小化成本函数(cost function)[45-48]的方法估算.本研究选用的代价函数如下: ...
Total porosity and random roughness of the interrow zone as influenced by tillage
1
1966
... MEMLS模型输入包括频率、入射角、天空背景亮度温度、散射系数、积雪参数、地表温度以及积雪-土壤界面反射率[19].天空背景的亮度温度所需的大气透射率参照Pulliainen等[32-33]的提出的统计反演方法,天空背景亮度温度所需的上下行大气亮度温度由Aschbache[34]提出的公式估算.散射系数参照Matzler等[18]的工作,采用玻恩近似计算.输入的积雪参数包括积雪层数、积雪温度、积雪湿度、积雪密度、积雪盐度、积雪厚度,指数相关长度,指数相关长度采用Durand等[35]的经验公式通过积雪粒径估算,其他参数由NoSREx实验的地面测量获得[16].陆地积雪的盐度通常认为是0[36-37],本次模拟也将积雪盐度设为0.地表温度由NoSREx实验的地面测量数据获得.水平极化和垂直极化的积雪-土壤界面反射率,本研究是利用Wang & Choudhury(1981)半经验模型(简称QHN)计算[38-39].QHN模型中所需的土壤介电常数采用Dobson模型计算[40].土壤-雪界面的粗糙程度通过土壤粗糙度来反映[41-42].土壤粗糙度通常用均方根高度和表面相关长度两个统计变量表示,其具体定义可见文献[43-44].土壤粗糙度较难直接测量,通常采用最小化成本函数(cost function)[45-48]的方法估算.本研究选用的代价函数如下: ...
Review of land surface roughness parameterization study
1
2012
... MEMLS模型输入包括频率、入射角、天空背景亮度温度、散射系数、积雪参数、地表温度以及积雪-土壤界面反射率[19].天空背景的亮度温度所需的大气透射率参照Pulliainen等[32-33]的提出的统计反演方法,天空背景亮度温度所需的上下行大气亮度温度由Aschbache[34]提出的公式估算.散射系数参照Matzler等[18]的工作,采用玻恩近似计算.输入的积雪参数包括积雪层数、积雪温度、积雪湿度、积雪密度、积雪盐度、积雪厚度,指数相关长度,指数相关长度采用Durand等[35]的经验公式通过积雪粒径估算,其他参数由NoSREx实验的地面测量获得[16].陆地积雪的盐度通常认为是0[36-37],本次模拟也将积雪盐度设为0.地表温度由NoSREx实验的地面测量数据获得.水平极化和垂直极化的积雪-土壤界面反射率,本研究是利用Wang & Choudhury(1981)半经验模型(简称QHN)计算[38-39].QHN模型中所需的土壤介电常数采用Dobson模型计算[40].土壤-雪界面的粗糙程度通过土壤粗糙度来反映[41-42].土壤粗糙度通常用均方根高度和表面相关长度两个统计变量表示,其具体定义可见文献[43-44].土壤粗糙度较难直接测量,通常采用最小化成本函数(cost function)[45-48]的方法估算.本研究选用的代价函数如下: ...
地表粗糙度参数化研究综述
1
2012
... MEMLS模型输入包括频率、入射角、天空背景亮度温度、散射系数、积雪参数、地表温度以及积雪-土壤界面反射率[19].天空背景的亮度温度所需的大气透射率参照Pulliainen等[32-33]的提出的统计反演方法,天空背景亮度温度所需的上下行大气亮度温度由Aschbache[34]提出的公式估算.散射系数参照Matzler等[18]的工作,采用玻恩近似计算.输入的积雪参数包括积雪层数、积雪温度、积雪湿度、积雪密度、积雪盐度、积雪厚度,指数相关长度,指数相关长度采用Durand等[35]的经验公式通过积雪粒径估算,其他参数由NoSREx实验的地面测量获得[16].陆地积雪的盐度通常认为是0[36-37],本次模拟也将积雪盐度设为0.地表温度由NoSREx实验的地面测量数据获得.水平极化和垂直极化的积雪-土壤界面反射率,本研究是利用Wang & Choudhury(1981)半经验模型(简称QHN)计算[38-39].QHN模型中所需的土壤介电常数采用Dobson模型计算[40].土壤-雪界面的粗糙程度通过土壤粗糙度来反映[41-42].土壤粗糙度通常用均方根高度和表面相关长度两个统计变量表示,其具体定义可见文献[43-44].土壤粗糙度较难直接测量,通常采用最小化成本函数(cost function)[45-48]的方法估算.本研究选用的代价函数如下: ...
Calibration of the L-MEB model over a coniferous and a deciduous forest
1
2008
... MEMLS模型输入包括频率、入射角、天空背景亮度温度、散射系数、积雪参数、地表温度以及积雪-土壤界面反射率[19].天空背景的亮度温度所需的大气透射率参照Pulliainen等[32-33]的提出的统计反演方法,天空背景亮度温度所需的上下行大气亮度温度由Aschbache[34]提出的公式估算.散射系数参照Matzler等[18]的工作,采用玻恩近似计算.输入的积雪参数包括积雪层数、积雪温度、积雪湿度、积雪密度、积雪盐度、积雪厚度,指数相关长度,指数相关长度采用Durand等[35]的经验公式通过积雪粒径估算,其他参数由NoSREx实验的地面测量获得[16].陆地积雪的盐度通常认为是0[36-37],本次模拟也将积雪盐度设为0.地表温度由NoSREx实验的地面测量数据获得.水平极化和垂直极化的积雪-土壤界面反射率,本研究是利用Wang & Choudhury(1981)半经验模型(简称QHN)计算[38-39].QHN模型中所需的土壤介电常数采用Dobson模型计算[40].土壤-雪界面的粗糙程度通过土壤粗糙度来反映[41-42].土壤粗糙度通常用均方根高度和表面相关长度两个统计变量表示,其具体定义可见文献[43-44].土壤粗糙度较难直接测量,通常采用最小化成本函数(cost function)[45-48]的方法估算.本研究选用的代价函数如下: ...
Retrieval of high-resolution soil moisture through combination of Sentinel-1 and Sentinel-2 data
0
2020
Radar-radiometer soil moisture estimation with joint physics and adaptive regularization in support of SMAP
0
2014
Evaluating the Semiempirical H-Q model used to calculate the L-band emissivity of a rough bare soil
1
2013
... MEMLS模型输入包括频率、入射角、天空背景亮度温度、散射系数、积雪参数、地表温度以及积雪-土壤界面反射率[19].天空背景的亮度温度所需的大气透射率参照Pulliainen等[32-33]的提出的统计反演方法,天空背景亮度温度所需的上下行大气亮度温度由Aschbache[34]提出的公式估算.散射系数参照Matzler等[18]的工作,采用玻恩近似计算.输入的积雪参数包括积雪层数、积雪温度、积雪湿度、积雪密度、积雪盐度、积雪厚度,指数相关长度,指数相关长度采用Durand等[35]的经验公式通过积雪粒径估算,其他参数由NoSREx实验的地面测量获得[16].陆地积雪的盐度通常认为是0[36-37],本次模拟也将积雪盐度设为0.地表温度由NoSREx实验的地面测量数据获得.水平极化和垂直极化的积雪-土壤界面反射率,本研究是利用Wang & Choudhury(1981)半经验模型(简称QHN)计算[38-39].QHN模型中所需的土壤介电常数采用Dobson模型计算[40].土壤-雪界面的粗糙程度通过土壤粗糙度来反映[41-42].土壤粗糙度通常用均方根高度和表面相关长度两个统计变量表示,其具体定义可见文献[43-44].土壤粗糙度较难直接测量,通常采用最小化成本函数(cost function)[45-48]的方法估算.本研究选用的代价函数如下: ...
The international classification for seasonal snow on the ground
1
83
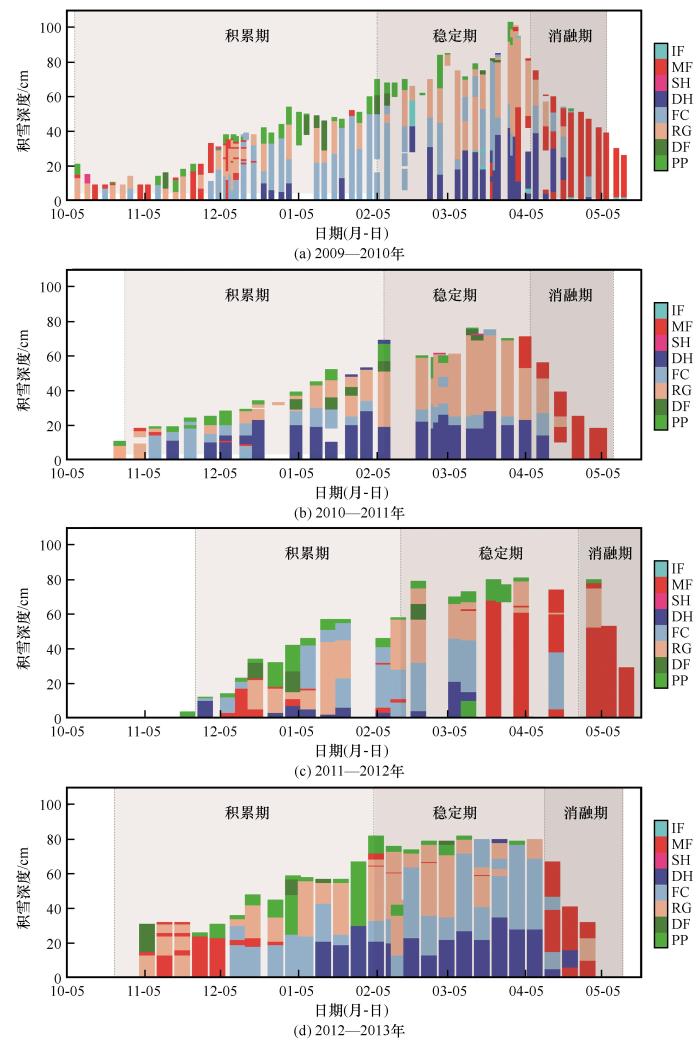
... 图3展示了自然积雪的分层特性.如图可知,融化状态(Melt Forms, MF)主要出现在积累期早期(10—12月)和消融期(4—5月).降水粒子(Precipitation Particles, PP)和分解碎片降水粒子(Decomposing and Fragmented precipitations particles, DF)主要出现在近雪表层(图中均为绿色),且主要在4月前出现.在积累期后期和稳定期,积雪分层颗粒形状出现的种类主要是圆形颗粒(Rounded Grains, RG)、片状颗粒(Faceted Crystals, FC)、深霜(Depth Hoar, DH).在消融期主要类别为融化状态.图3(c)可见深蓝色较少,表明2011—2012年缺乏深霜层,这与该年较其他年份更温和的气温有关,色带参考季节性陆面积雪的国际分类[49]. ...
Sensitivity analysis on snow parameters impacting passive microwave brightness temperature of snow: a study based on MEMLS
1
2009
... MEMLS模型模拟和观测亮温的误差是由模型本身的局限性以及观测参数误差等因素造成的.模拟结果受各个输入参数的影响,不同参数对模拟结果影响程度不同[50].驱动MEMLS模型模拟的参数通过积雪剖面调查获取,该调查为了尽可能详细地捕捉积雪变化,由专家每隔3~5天且连续四个冬季开展雪坑(snow pit)测量.根据该高质量的积雪剖面调查结果进行模拟,模拟和观测亮温仍存在误差,这表明一些影响积雪辐射传输过程的重要变量可能在模型中并没有得到有效的体现,因此有必要开展新的积雪模型研究.此外,地面观测参数在模型模拟和积雪反演中能够起到重要的指导作用,但为模型和反演算法确定合理的积雪结构等效参数从而让模型更好的反映真实情况同样重要.虽然辐射计观测点和积雪刨面调查点的空间距离非常近,但积雪结构的空间变异性依然会导致模拟的结果和辐射计观测结果出现差异,这在一定程度上反映出将传统地面调查技术获取的积雪结构信息直接运用于模型模拟的局限性.而且,积雪剖面调查获取积雪结构信息的过程中会存在调查者主观因素的影响(例如如何确定积雪中每一层的边界以及如何选取粒径的测量位置),这也会导致辐射计观测结果和模拟结果出现偏差.一般而言,高频波段比低频波段对积雪粒径更敏感,而水平极化比垂直极化对积雪分层结构更敏感.本次模拟结果低频优于高频,且低频(10.65 GHz和18.7 GHz)的垂直极化优于水平极化,高频(90 GHz)的水平极化优于垂直极化,这说明积雪结构信息在模型模拟中的重要性.一方面,积雪剖面调查取样过程中的细微偏差足以对模拟结果产生显著影响;另一方面,模型模拟中的理想化条件和自然条件下积雪的状况存在区别,物理理论和实际观测的有效连接还迫切的需要更深入的研究. ...
积雪微波辐射亮温对积雪参数的敏感性分析——以多层积雪微波辐射模型为例
1
2009
... MEMLS模型模拟和观测亮温的误差是由模型本身的局限性以及观测参数误差等因素造成的.模拟结果受各个输入参数的影响,不同参数对模拟结果影响程度不同[50].驱动MEMLS模型模拟的参数通过积雪剖面调查获取,该调查为了尽可能详细地捕捉积雪变化,由专家每隔3~5天且连续四个冬季开展雪坑(snow pit)测量.根据该高质量的积雪剖面调查结果进行模拟,模拟和观测亮温仍存在误差,这表明一些影响积雪辐射传输过程的重要变量可能在模型中并没有得到有效的体现,因此有必要开展新的积雪模型研究.此外,地面观测参数在模型模拟和积雪反演中能够起到重要的指导作用,但为模型和反演算法确定合理的积雪结构等效参数从而让模型更好的反映真实情况同样重要.虽然辐射计观测点和积雪刨面调查点的空间距离非常近,但积雪结构的空间变异性依然会导致模拟的结果和辐射计观测结果出现差异,这在一定程度上反映出将传统地面调查技术获取的积雪结构信息直接运用于模型模拟的局限性.而且,积雪剖面调查获取积雪结构信息的过程中会存在调查者主观因素的影响(例如如何确定积雪中每一层的边界以及如何选取粒径的测量位置),这也会导致辐射计观测结果和模拟结果出现偏差.一般而言,高频波段比低频波段对积雪粒径更敏感,而水平极化比垂直极化对积雪分层结构更敏感.本次模拟结果低频优于高频,且低频(10.65 GHz和18.7 GHz)的垂直极化优于水平极化,高频(90 GHz)的水平极化优于垂直极化,这说明积雪结构信息在模型模拟中的重要性.一方面,积雪剖面调查取样过程中的细微偏差足以对模拟结果产生显著影响;另一方面,模型模拟中的理想化条件和自然条件下积雪的状况存在区别,物理理论和实际观测的有效连接还迫切的需要更深入的研究. ...


 甘公网安备 62010202000676号