


0 引言
多氯联苯(polychlorinated biphenyls, PCBs)能在环境中长期存留并通过食物链传递而在生物体内富集,产生致癌、致畸、致突变作用,对免疫系统、生殖系统、神经系统、内分泌系统及其他健康方面均具有负面效应[1]。PCBs严重影响人类健康,是首批列入《斯德哥尔摩公约》名录的持久性有机污染物(persistent organic pollutants, POPs)之一。目前对环境中PCBs的研究主要集中于大气、土壤、河流及生物体内[2-10],然而,冰冻圈作为全球尺度下影响POPs迁移转化的重要介质,研究甚少[11-16]。降雪对大气POPs具有较强的清除能力:一方面低温、高比表面积的雪花可以冷凝、吸附大气中的POPs;另一方面降雪还可以去除大气颗粒物中的POPs。降雪沉降至地表形成积雪,此时积雪因其高比表面积和低温,继续吸附大气POPs,而积雪表面的大气光化学反应则使得POPs发生降解。积雪融化后,进一步导致POPs向大气或水体的二次释放,从而影响有机物的循环归宿[17]。前人的研究表明,PCBs等POPs可通过沉降过程沉积到积雪中,由于持久性的特点,其在长距离运输过程中保留的来源信息,也可用于示踪大气环流过程[18-19]。因此,了解积雪中PCBs的含量及其分布特征具有十分重要的科学意义。
已有研究在积雪环境中检测到PCBs的存在,Khairy等[20]在南极半岛西部的冰川融雪中检测到29种PCBs,含量在300~1 100 pg·L-1之间,表明冰川融化作为南极洲污染物来源的重要性;Casal等[15]在南极洲海岸的积雪样品中检测到41种PCBs的含量为90~290 pg·L-1,同时发现海水中PCBs含量随融雪的汇入逐渐升高;Hermanson等[13]在斯瓦尔巴群岛积雪中检测到209种PCBs的含量为458~844 pg·L-1,来源分析结果说明PCBs可能来源于当地的局部污染,并且指出PCBs含量与早期数据相比并没有随时间下降。为了全面评估冰冻圈PCBs的污染情况,首先要对其进行定量分析,但积雪中PCBs浓度极低,含量为ng·L-1级,甚至在有些地区达到pg·L-1级[13-16,20],这对积雪中PCBs的检测带来挑战。
液液萃取[21-23]及固相萃取法[13,16,20]是积雪中PCBs常用的萃取方式。目前对积雪中PCBs的检测主要为采集大量积雪样品(20~70 L)[13,16,20],通过XAD-2吸附树脂富集后,进一步洗脱分离、浓缩,使用GC-MS[11],GC-MS/MS[16,20],GC-HRMS[13,15]进行检测。该方法对积雪样品量需求大,实际研究中常存在较多困难,因此本研究拟通过优化仪器方法,在较少样品量(1~2 L)情况下实现积雪中PCBs的定量分析。研究利用反相固相萃取柱进行积雪中PCBs萃取,洗脱后氮吹浓缩,同时应用参数优化后的高灵敏度和高分辨率气相色谱-四级杆串联飞行时间质谱联用仪(GC-QTOF/MS)对28种PCBs进行定量分析,为较少样品量中PCBs的分析提供了方法及依据,为进一步深入研究PCBs的暴露水平和环境行为奠定了基础。
1 实验部分
1.1 主要仪器与试剂
7890B/7200气相色谱-四级杆串联飞行时间质谱联用仪(Agilent,美国),UGC-12C氮吹仪(北京优晟联合科技有限公司)。
28种PCBs混合标准品(10 μg·mL-1,Accustandard,美国):PCB8、PCB18、PCB28、PCB44、PCB52、PCB66、PCB77、PCB81、PCB101、PCB105、PCB114、PCB118、PCB123、PCB126、PCB128、PCB138、PCB153、PCB156、PCB157、PCB167、PCB169、PCB170、PCB180、PCB187、PCB189、PCB195、PCB206、PCB209;2种PCBs定量内标标准品(100 μg·mL-1,Accustandard,美国):PCB 77-d6,PCB 156-d3;PCB替代物标准品2,4,5,6-四氯间二甲苯(TCMX,100 μg·mL-1,Accustandard,美国)。
正己烷、二氯甲烷、甲醇(色谱级,Fisher,美国),实验用水为Milli-Q超纯水(18.2 MΩ·cm)。
1.2 标准曲线
通过正己烷将28种PCBs混合标准溶液、TCMX以及内标标准溶液进行稀释。28种PCBs和替代物TCMX的质量浓度依次为0.05、0.1、0.2、0.5、1、2、5、10 μg·L-1,内标浓度为10 μg·L-1。
1.3 样品采集及前处理
使用不锈钢铲采集表层积雪样品(0~5 cm)至洁净聚四氟乙烯袋中。将采集好的积雪于4~6 ℃下融化,经聚四氟乙烯滤膜(0.45 μm,47 mm,Whatman,英国)过滤,量取滤液体积(1~2 L),在样品中加入1 ng TCMX替代物标准溶液,混匀待用。依次使用5 mL正己烷:二氯甲烷(1∶1,V/V)混合液,10 mL甲醇,10 mL超纯水活化HLB固相萃取柱(500 mg,6 mL,Waters,美国),样品溶液以5 mL·min-1的速度通过活化后的小柱;将小柱氮吹至完全干燥;用10 mL正己烷:二氯甲烷(1∶1,V/V)混合液洗脱并收集至棕色玻璃瓶中;洗脱液氮吹至近干后,用正己烷定容至100 μL,加入1 ng内标溶液,待进一步分析。
1.4 GC-MS分析
1.4.1 GC条件
DB-5MS毛细管柱(30 m×0.25 mm×0.25 μm,Agilent,美国);载气:氦气;进样口温度:280 ℃;进样模式:不分流进样;进样量:3 μL;柱流速:1.2 mL·min-1;色谱柱温度程序:初始柱温120 ℃,保持1 min,以20 ℃·min-1升至180 ℃,再以5 ℃·min-1升至280 ℃,保持20 min。
1.4.2 MS条件
电子轰击离子源(EI)模式:离子化能量:70 eV;扫描方式:全扫描,范围为m/z 55~550,采集频率为5 spec·s-1;离子源温度:280 ℃;传输线温度:280 ℃;溶剂延迟时间:4 min。负化学电离离子源(NCI)模式:离子化能量:70 eV;电流值:80 μA;扫描方式:全扫描,范围为m/z 55~600,采集频率为5 spec·s-1;离子源温度:150 ℃;反应气:甲烷;传输线温度:280 ℃;溶剂延迟时间:4 min。28种PCBs的保留时间、定性离子、定量离子及定量内标化合物见表1。
表1 28种PCBs的保留时间、定性离子、定量离子及定量内标化合物
Table 1
| 化合物 | 保留时间/min | 定性离子(m/z) | 定量离子(m/z) | 定量内标化合物 |
|---|---|---|---|---|
| PCB8 | 9.973 | 223.9975/152.0629 | 221.9999 | PCB77-d6 |
| PCB18 | 11.051 | 257.9571/186.0236 | 255.9602 | PCB77-d6 |
| PCB28 | 12.437 | 257.9575/186.0237 | 255.9606 | PCB77-d6 |
| PCB52 | 13.468 | 219.9843/289.9212 | 291.9183 | PCB77-d6 |
| PCB44 | 14.071 | 219.9840/289.9211 | 291.9180 | PCB77-d6 |
| PCB66 | 15.473 | 219.9841/289.9214 | 291.9184 | PCB77-d6 |
| PCB101 | 16.266 | 253.9445/327.8767 | 325.8791 | PCB77-d6 |
| PCB81 | 17.172 | 219.9837/289.9208 | 291.9177 | PCB77-d6 |
| PCB77 | 17.520 | 219.9836/289.9212 | 291.9179 | PCB77-d6 |
| PCB123 | 18.237 | 253.9445/327.8764 | 325.8794 | PCB77-d6 |
| PCB118 | 18.369 | 253.9447/327.8760 | 325.8791 | PCB77-d6 |
| PCB114 | 18.696 | 255.9417/323.8823 | 325.8790 | PCB77-d6 |
| PCB153 | 19.117 | 289.9023/361.8374 | 359.8402 | PCB77-d6 |
| PCB105 | 19.205 | 253.9446/327.8765 | 325.8796 | PCB77-d6 |
| PCB138 | 20.010 | 289.9018/361.8373 | 359.8397 | PCB156-d3 |
| PCB126 | 20.364 | 253.9437/323.8816 | 325.8789 | PCB156-d3 |
| PCB187 | 20.526 | 323.8632/395.7982 | 393.8010 | PCB156-d3 |
| PCB128 | 20.894 | 361.8375/289.9021 | 359.8400 | PCB156-d3 |
| PCB167 | 21.025 | 289.9023/361.8375 | 359.8402 | PCB156-d3 |
| PCB156 | 21.750 | 289.9015/361.8368 | 359.8397 | PCB156-d3 |
| PCB157 | 21.908 | 289.9021/361.8374 | 359.8401 | PCB156-d3 |
| PCB180 | 22.319 | 323.8629/395.7975 | 393.8007 | PCB156-d3 |
| PCB169 | 23.058 | 289.9023/361.8376 | 359.8406 | PCB156-d3 |
| PCB170 | 23.253 | 323.8636/395.7990 | 393.8013 | PCB156-d3 |
| PCB189 | 24.281 | 323.8638/395.7989 | 393.8019 | PCB156-d3 |
| PCB195 | 24.686 | 357.8249/427.7629 | 429.7597 | PCB156-d3 |
| PCB206 | 26.600 | 461.7248/391.7865 | 463.7207 | PCB156-d3 |
| PCB209 | 27.588 | 499.6798/427.7436 | 497.6825 | PCB156-d3 |
2 结果与讨论
2.1 方法优化
2.1.1 离子源的选择
PCBs为氯代化合物,而氯原子具有较强的捕获电子形成负离子的特性,可通过NCI离子源增加PCBs的响应,因此实验中分别比较了28种PCBs在EI和NCI离子源下的响应以及峰对称情况。通过对比PCBs混标(10 μg·L-1)的EI和NCI离子源检测参数,选择合适的离子源。如图1(a)所示,EI离子源下28种PCBs的响应值相差不大,响应水平基本一致。NCI离子源下不同氯代物间响应值差别较大,其中PCB8、PCB18、PCB28、PCB44、PCB52、PCB66、PCB101、PCB128、PCB138未检出,少量四氯及五氯PCBs响应值与EI离子源相比并未提高,六氯及以上PCBs响应值显著提高,NCI响应值为EI的2~57倍左右。整体来看,NCI离子源下PCBs响应值基本随氯代程度的提高而增加,这可能是由于一方面低氯代PCBs通过解离产生的含Cl-碎片有限[24],另一方面随着电负性氯原子的取代度越高,负电荷的稳定性就越高[25]。目前已有研究应用NCI-MS测定环境样品中的PCBs,但大多为高氯代PCBs,氯代程度最低的为PCB70[26]、PCB74[27-28]、PCB77[29]、PCB92[30],这与本文实验结果一致,表明NCI离子源适用于高氯代PCBs的检测。
图1
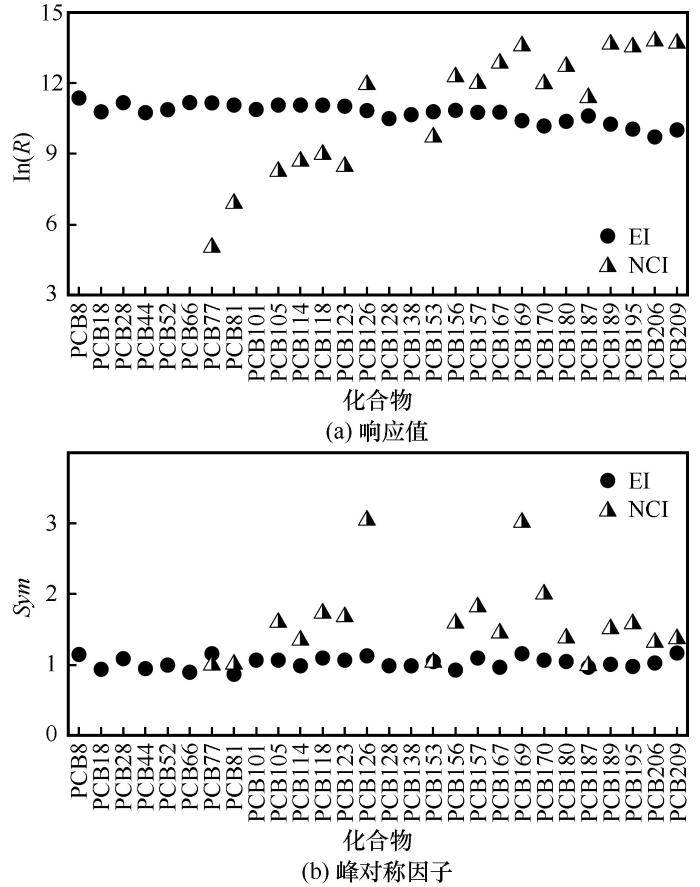
图1
EI与NCI离子源下28种PCBs响应值(a)与峰对称因子(b)的比较(R表示仪器响应值,Sym表示峰对称因子)
Fig. 1
Comparison of response values (a) and peak symmetry factors (b) of 28 PCBs under EI and NCI ion sources (R is response value, Sym is peak symmetry factor)
本研究对比了两种离子源对色谱峰对称因子的影响。如图1(b)所示,EI离子源下,28种PCBs的色谱峰对称因子在0.87~1.17之间,对称性较好;在NCI离子源下,目标化合物色谱峰对称因子范围为0.99~3.04,对称性较差。例如,PCB126和PCB169的对称因子>3,存在明显的拖尾峰;如图2所示,PCB126的出现严重拖尾现象。根据各PCBs的出峰顺序,PCB126与PCB187依次出峰。通过提取NCI离子源下PCB187的质谱图(图3),可以观察到NCI离子源下PCB187质谱图中出现了质荷比(m/z)325.8780的离子碎片,与PCB126分子离子的m/z 325.8802接近,其原因为PCB187在离子化过程中的产生了少量与PCB126相同的质量数的碎片离子,干扰了PCB126的色谱峰峰形,因此出现“假拖尾”现象,而更高氯代化合物或者保留时间相距较远的化合物的峰形较为对称。综上,不同离子源引起了目标化合物的碎片化程度不同,进而导致了拖尾峰的出现;相较于NCI离子源,EI离子源可以显著避免该现象,可优先选择。由于本研究需要对28种不同氯代PCBs同时检测,考虑EI离子化方式下不同氯代物响应的均一性及对称性较好,因此选择EI离子化方式进行检测。
图2
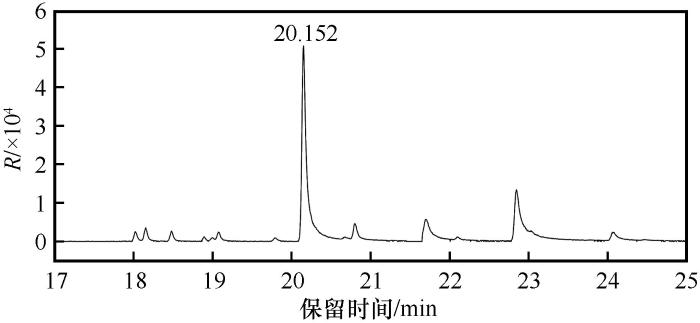
图2
NCI离子源下PCB126的提取离子色谱图
Fig. 2
Extraction ion chromatogram of PCB126 under NCI ion source
图3
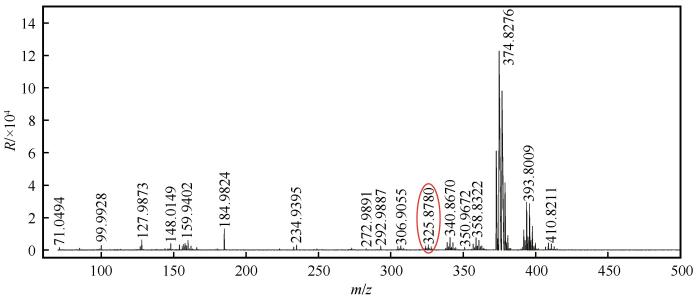
图3
NCI离子源下PCB187的质谱图(m/z表示质荷比)
Fig. 3
Mass spectrum of PCB187 under NCI ion source (m/z is mass charge ratio)
2.1.2 离子源发射电流的选择
除离子源类型以外,离子源的离子化能量、源温度以及发射电流等条件也会影响PCBs的碎片模式及离子丰度。发射电流作为离子源的重要参数,影响灯丝发射的电子数,发射的电子数越多,更多的目标化合物被电离[31],最终影响化合物的响应。目前针对PCBs的测定,离子化能量通常为标准参数70 eV,而发射电流这一参数的优化在以往的研究中较少[32]。本研究系统筛选了EI离子源中不同发射电流值下各PCBs的响应,从而使PCBs达到较高的响应强度。本研究在标准离子化能量(70 eV)以及源温度(280 ℃)下,研究了PCBs标准溶液在4~40 μA的发射电流范围内的响应值变化,以确定适合的发射电流值。如图4所示,28种PCBs的响应值随电流变化的整体趋势一致,均表现出随电流的增加先增加、后稳定的特征,发射电流在15 μA时基本达到最大响应,可达初始电流(4 μA)响应值的3.7~11.0倍,因此,本研究选择了15 μA为最佳发射电流值。
图4
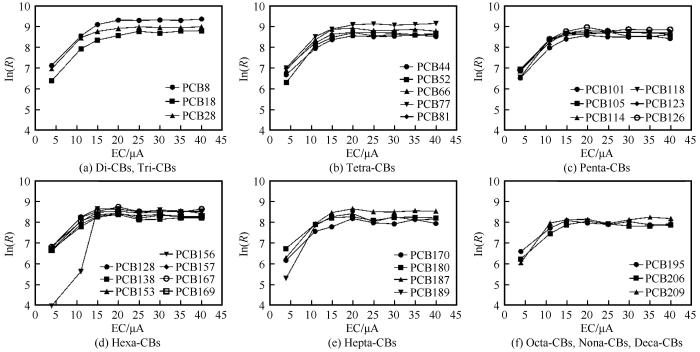
图4
发射电流对28种PCBs响应值的影响(EC表示发射电流)
Fig. 4
Effect of emission current on the 28 PCBs response value (EC is emission current)
2.2 方法验证
2.2.1 标准色谱图
PCBs的分析中,首先需要保证良好的峰形与分离度。如图5所示,28种PCBs标准溶液的总离子流色谱图中,各色谱峰峰形良好,分离度达到基线分离,满足定量分析要求。
图5
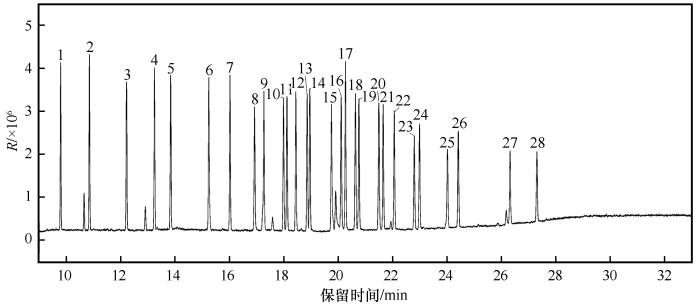
图5
28种PCBs标准品的总离子流图
1.PCB8;2.PCB18;3.PCB28;4.PCB52;5.PCB44;6.PCB66;7.PCB101;8.PCB81;9.PCB77;10.PCB123;11.PCB118;12.PCB114;13.PCB153;14.PCB105;15.PCB138;16.PCB126;17.PCB187;18.PCB128;19.PCB167;20.PCB156;21.PCB157;22.PCB180;23.PCB169;24.PCB170;25.PCB189;26.PCB195;27.PCB206;28.PCB209
Fig. 5
Total ion chromatogram (TIC) of the 28 PCBs standard
2.2.2 线性范围和检出限
在已确定的最佳检测条件下,测定本文1.2小节中已配制的质量浓度为0.05、0.1、0.2、0.5、1、2、5、10 μg·L-1混合标准工作液,以28种PCBs响应强度对标准溶液的质量浓度进行线性回归分析,绘制标准曲线,各物质线性范围及相关系数(表2)。结果表明,28种物质在0.05~10 μg·L-1浓度范围内具有良好的线性关系,相关系数均大于0.99。本研究在空白水样中添加不同浓度的标准溶液进行样品前处理与测定,程序空白中无PCBs的检出,以S/N=3确定方法检出限(LOD)为1.01~2.92 pg·L-1,以S/N=10确定方法定量限(LOQ)为3.04~8.75 pg·L-1。
表2 28种PCBs的线性范围、回归方程、相关系数(r)、检出限和定量限
Table 2
| 化合物 | 线性范围/(μg·L-1) | 回归方程 | 相关系数r | 检出限/(pg·L-1) | 定量限/(pg·L-1) |
|---|---|---|---|---|---|
| PCB8 | 0.05~10 | y=2.7556x-0.000941 | 0.997 | 1.35 | 4.04 |
| PCB18 | 0.05~10 | y=1.5747x-0.000721 | 0.999 | 1.47 | 4.41 |
| PCB28 | 0.05~10 | y=1.8056x+0.000102 | 0.995 | 1.15 | 3.45 |
| PCB44 | 0.05~10 | y=1.0643x-0.000407 | 0.997 | 1.33 | 4.00 |
| PCB52 | 0.05~10 | y=1.2568x-0.000302 | 0.996 | 1.33 | 3.98 |
| PCB66 | 0.05~10 | y=1.2814x+0.000001 | 0.995 | 2.14 | 6.41 |
| PCB77 | 0.05~10 | y=0.9433x-0.000044 | 0.994 | 1.11 | 3.33 |
| PCB81 | 0.05~10 | y=0.8777x-0.000739 | 0.996 | 1.99 | 5.98 |
| PCB101 | 0.05~10 | y=0.8170x-0.000273 | 0.995 | 2.34 | 7.03 |
| PCB105 | 0.05~10 | y=0.6669x-0.000550 | 0.995 | 1.89 | 5.67 |
| PCB114 | 0.05~10 | y=0.7190x-0.000245 | 0.996 | 1.08 | 3.25 |
| PCB118 | 0.05~10 | y=0.7100x-0.000015 | 0.996 | 1.15 | 3.45 |
| PCB123 | 0.05~10 | y=0.7321x-0.000052 | 0.995 | 1.04 | 3.13 |
| PCB126 | 0.05~10 | y=1.0730x-0.000649 | 0.995 | 1.09 | 3.26 |
| PCB128 | 0.05~10 | y=0.8469x+0.000078 | 0.994 | 1.01 | 3.04 |
| PCB138 | 0.05~10 | y=1.1128x-0.000506 | 0.997 | 2.35 | 7.04 |
| PCB153 | 0.05~10 | y=0.5086x-0.000358 | 0.996 | 1.02 | 3.05 |
| PCB156 | 0.05~10 | y=0.8552x-0.000506 | 0.995 | 1.53 | 4.60 |
| PCB157 | 0.05~10 | y=0.8804x-0.000553 | 0.996 | 2.35 | 7.05 |
| PCB167 | 0.05~10 | y=0.9421x-0.000545 | 0.994 | 2.30 | 6.91 |
| PCB169 | 0.05~10 | y=0.4831x+0.000119 | 0.994 | 2.45 | 7.34 |
| PCB170 | 0.05~10 | y=0.4228x+0.000009 | 0.996 | 2.27 | 6.81 |
| PCB180 | 0.05~10 | y=0.5110x-0.000082 | 0.994 | 2.47 | 7.40 |
| PCB187 | 0.05~10 | y=0.9182x-0.000414 | 0.996 | 1.21 | 3.64 |
| PCB189 | 0.05~10 | y=0.3526x+0.000331 | 0.996 | 2.23 | 6.68 |
| PCB195 | 0.05~10 | y=0.3373x+0.000038 | 0.997 | 2.41 | 7.23 |
| PCB206 | 0.05~10 | y=0.1916x+0.000197 | 0.993 | 2.91 | 8.73 |
| PCB209 | 0.05~10 | y=0.2541x+0.001522 | 0.994 | 2.92 | 8.75 |
2.2.3 回收率和精密度
采用加标回收的方式,在空白样品中分别添加低、中、高3种不同浓度水平(0.2、1、10 μg·L-1)的PCBs标准溶液及定量TCMX替代物标准溶液,每个浓度水平做3个平行样,按实验方法进行预处理和进样分析,计算不同浓度水平下28种PCBs及TCMX的回收率和相对标准偏差(RSD)。如表3所示,在低、中、高三种不同浓度水平下,PCBs各单体回收率为60.2%~105.8%,RSD为0.9%~14.0%,TCMX回收率为48.2%~53.7%,RSD为3.9%~6.4%,满足检测要求。TCMX作为替代物回收指示物,可通过其回收率来表征实际样品过程中目标物的损失,以监控每个样品的方法性能。
表3 不同加标水平下28种PCBs的回收率和相对标准偏差(n=3)
Table 3
| 化合物 | 加标水平 | |||||
|---|---|---|---|---|---|---|
| 0.2 μg·L-1 | 1 μg·L-1 | 10 μg·L-1 | ||||
| 回收率/% | RSD/% | 回收率/% | RSD/% | 回收率/% | RSD/% | |
| TCMX | 50.6 | 5.7 | 53.7 | 3.9 | 48.2 | 6.4 |
| PCB8 | 74.3 | 5.8 | 66.4 | 2.0 | 64.3 | 8.9 |
| PCB18 | 68.1 | 7.5 | 60.5 | 2.7 | 60.2 | 9.9 |
| PCB28 | 86.9 | 5.4 | 81.1 | 5.7 | 71.7 | 7.9 |
| PCB44 | 75.4 | 13.1 | 65.6 | 0.9 | 63.5 | 5.3 |
| PCB52 | 75.0 | 9.0 | 65.9 | 5.9 | 62.4 | 5.7 |
| PCB66 | 93.6 | 6.7 | 88.4 | 7.9 | 70.1 | 3.1 |
| PCB77 | 85.3 | 12.6 | 88.8 | 6.0 | 72.5 | 4.4 |
| PCB81 | 100.4 | 8.2 | 95.4 | 4.7 | 72.6 | 3.4 |
| PCB101 | 90.0 | 10.4 | 79.1 | 6.0 | 68.1 | 1.6 |
| PCB105 | 96.0 | 12.0 | 94.0 | 5.6 | 71.8 | 2.1 |
| PCB114 | 86.9 | 7.9 | 86.8 | 9.2 | 70.8 | 1.2 |
| PCB118 | 92.4 | 9.2 | 83.8 | 8.7 | 72.4 | 4.0 |
| PCB123 | 98.5 | 7.8 | 85.1 | 7.7 | 72.8 | 3.1 |
| PCB126 | 105.8 | 12.1 | 78.0 | 9.2 | 72.5 | 13.2 |
| PCB128 | 85.3 | 11.6 | 75.5 | 4.3 | 77.3 | 10.8 |
| PCB138 | 91.9 | 11.7 | 92.7 | 11.1 | 76.1 | 4.3 |
| PCB153 | 82.5 | 7.0 | 77.4 | 2.6 | 68.9 | 0.9 |
| PCB156 | 98.8 | 13.7 | 70.0 | 5.0 | 74.5 | 7.8 |
| PCB157 | 86.8 | 7.2 | 85.7 | 9.3 | 73.8 | 5.4 |
| PCB167 | 65.2 | 4.5 | 71.6 | 6.5 | 74.2 | 9.3 |
| PCB169 | 85.2 | 9.8 | 103.2 | 11.9 | 84.1 | 8.2 |
| PCB170 | 81.1 | 4.8 | 83.9 | 8.9 | 78.3 | 2.6 |
| PCB180 | 81.7 | 9.0 | 71.2 | 2.8 | 74.2 | 7.3 |
| PCB187 | 88.1 | 5.4 | 64.5 | 7.3 | 66.4 | 12.9 |
| PCB189 | 89.9 | 7.4 | 84.0 | 6.4 | 83.1 | 7.0 |
| PCB195 | 83.0 | 9.1 | 71.6 | 9.8 | 81.1 | 1.5 |
| PCB206 | 68.8 | 6.3 | 68.2 | 4.7 | 77.8 | 10.3 |
| PCB209 | 68.6 | 12.4 | 66.0 | 3.0 | 76.4 | 0.3 |
2.2.4 基质效应
为准确定量积雪中的PCBs,对积雪样品进行了基质效应评估。使用PCBs混合标准储备液配制质量浓度为1 μg·L-1的溶剂标准溶液与同质量浓度的基质标准溶液,测定后依照公式η=Ai基质标准/Ai溶剂标准(Ai为目标分析物的峰面积)计算基质效应,结果显示28种PCBs基质效应在0.99~1.37之间,部分PCBs呈现基质增强效应。应用内标法对基质标准和溶剂标准进行校正,得到28种PCBs响应比值为0.86~1.05,表明内标法能够较好地消除基质效应的影响。
2.3 积雪样品分析
本研究对我国吉林与内蒙古地区2个积雪样品中的PCBs进行定量分析以验证上述方法。结果表明,吉林积雪样品中∑28PCBs的含量为283.60 pg·L-1,∑7iPCBs(7种指示性PCBs同系物的总和)与∑dlPCBs(12种类二噁英类PCBs同系物的总和)的浓度分别为55.76 pg·L-1、183.02 pg·L-1;内蒙古积雪样品中∑28PCBs的含量为79.33 pg·L-1,∑7iPCBs与∑dlPCBs的浓度分别为16.928 pg·L-1、50.723 pg·L-1,吉林样品中PCBs的含量高于内蒙古样品中的含量。东北地区积雪中∑28PCBs的含量总体上与Casal等[15]在南极洲海岸的积雪样品中检测到的∑41PCBs的含量相当,低于Khairy等[20]在南极半岛西部的冰川融雪中检测到∑29PCBs 的含量;一方面是由于随着时间的推移,PCBs净沉积至冰川的含量不断累积,导致冰川中PCBs的含量显著高于积雪样品中的含量,另一方面,在极地地区黏土及大气颗粒物中有机质含量较低,PCBs等POPs大多分布在融雪中,故在融雪中含量较高[20],城市地区积雪样品中的PCBs可能会倾向于分布在有机质含量较高的颗粒态样品中,除此之外,污染源[13]及积雪的密度[15]等因素也可能会影响PCBs的含量。
不同氯代PCBs的含量百分比见图6(a)。从中可知,吉林与内蒙古地区积雪中PCBs同类物组成相似,均只有四至七氯代PCBs检出,含量依次为六氯联苯>五氯联苯>四氯联苯>七氯联苯。吉林、内蒙古两个地区均为高氯代同系物(五氯、六氯联苯)占主要组成,分别占总PCBs含量的62%和67%。Cui等[33]的研究报道了位于吉林与哈尔滨中心城区松花江沉积物中类似的PCBs同类物组成分布,聂等[34]与陈等[35]同样在松花江吉林市下游沉积物及吉林市土壤中发现了以五氯联苯等高氯代为主的污染特征。结合样品中PCBs同系物的分布特征,发现吉林样品中含量较高的单体为PCB126、81、77及128,内蒙古样品中含量较高的单体为PCB81、128、126及169[图6(b)]。PCB77、81、126及169在燃煤、有色金属冶炼及再生、工业与市政废弃物高温焚烧处理等过程中排放较多[36-38]。根据PCBs的分布特征及相关文献[33-38],初步推断积雪中PCBs的污染除与PCB历史生产、残留有关外,还与燃烧与热工业过程等有关。
图6
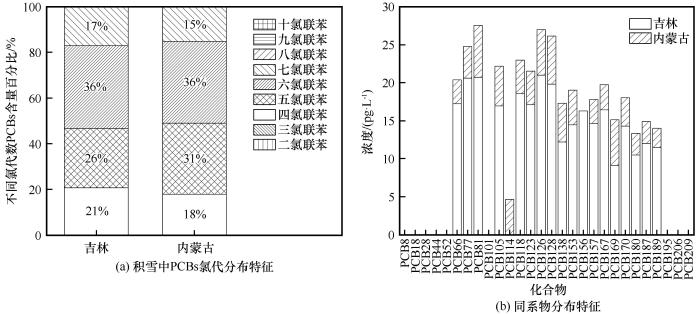
图6
吉林与内蒙古地区积雪中PCBs氯代分布特征(a)与同系物分布特征(b)
Fig. 6
Chlorination distribution characteristics of PCBs (a) and Homologue distribution characteristics (b) in seasonal snow in Jilin and Inner Mongolia
3 结论
(1)本研究建立了以GC-QTOF/MS分析积雪中28种PCBs的方法,即积雪融化后通过固相萃取柱进行PCBs的萃取并进一步浓缩,采用DB-5MS色谱柱对目标化合物进行分离,在发射电流为15 μA的EI电离源下进行检测。该方法提高了离子源的响应,同时利用高分辨质谱的精确质量数,在比较窄的质量窗口提取离子,提高了灵敏度,方法在线性、回收率和重复性方面良好。使得在较少积雪样品量的条件下实现了28种PCBs的定量检测。QTOF质谱属于高分辨率质谱,定量分析时通过提取较窄的质量数窗口,能够较好地降低基线噪音水平,从而获得较高的信噪比,提高检测灵敏度。与三重四级杆质谱(QqQMS)相比,QTOF质谱在定量检测的稳定性和灵敏度方面相对较弱,本研究通过优化离子源灯丝发射电流提高了离子响应,加强了测试过程中的QC样品质量监控保障数据可靠,为QTOF质谱进行积雪中痕量PCBs的定量分析提供了可能。
(2)本研究基于优化的检测方法,对东北典型地区积雪中的样品进行分析。结果表明,积雪中的PCBs均以五、六氯联苯占主要组成,同系物主要PCB126、81、77、128及169为主,初步推断积雪中PCBs的污染除与PCB历史生产、残留有关外,还与燃烧与热工业过程等有关。
参考文献
Health risks and source identification of dietary exposure to indicator polychlorinated biphenyls (PCBs) in Lanzhou, China
[J].
Evidence for major contributions of unintentionally produced PCBs in the air of China: implications for the national source inventory
[J].
High abundance of unintentionally produced tetrachlorobiphenyls (PCB47/48/75, 51, and 68) in the atmosphere at a regional background site in East China
[J].
Atmospheric emission of PCDD/Fs, PCBs, hexachlorobenzene, and pentachlorobenzene from the coking industry
[J].
Passive air monitoring of PCBs and PCNs across East Asia: a comprehensive congener evaluation for source characterization
[J].
Unintentionally produced dioxin-like polychlorinated biphenyls during cooking
[J].
Emission of unintentionally produced polychlorinated biphenyls (UP-PCBs) in China: Has this become the major source of PCBs in Chinese air?
[J].
The occurrence and sources of polychlorinated biphenyls (PCBs) in agricultural soils across China with an emphasis on unintentionally produced PCBs
[J].
Freshwater seal as a source of direct and indirect increased human exposure to persistent organic pollutants in a background area
[J].
Snow buntings (Plectrophenax nivealis) as bio-indicators for exposure differences to legacy and emerging persistent organic pollutants from the Arctic terrestrial environment on Svalbard
[J].
Temporal trends of polychlorinated biphenyls in precipitation in Beijing, China
[J].
Accumulation of perfluoroalkyl compounds in tibetan mountain snow: temporal patterns from 1980 to 2010
[J].
Atmospheric deposition of polychlorinated biphenyls to seasonal surface snow at four glacier sites on Svalbard, 2013—2014
[J].
Deposition history of polychlorinated biphenyls to the Lomonosovfonna glacier, Svalbard: a 209 congener analysis
[J].
Snow amplification of persistent organic pollutants at coastal Antarctica
[J].
Snow deposition and melting as drivers of polychlorinated biphenyls and organochlorine pesticides in arctic rivers, lakes, and ocean
[J].
The role of the global cryosphere in the fate of organic contaminants
[J].
Perfluorinated alkyl substances in snow as an atmospheric tracer for tracking the interactions between westerly winds and the Indian Monsoon over western China
[J].
‘New’ unintentionally produced PCBs in the Arctic
[J].
Levels, sources and chemical fate of persistent organic pollutants in the atmosphere and snow along the western Antarctic Peninsula
[J].
The historical residue trend of PCBs in the Agassiz ice cap, Ellesmere Island, Canada
[J].
Historical profile of Polychlorinated biphenyls (PCBs) in an alpine glacier
[J].
Analysis of a firn core for assessing POP seasonal accumulation on an Alpine glacier
[J].
Determination of coplanar and non‐coplanar polychlorinated biphenyls in human serum by gas chromatography with mass spectrometric detection: electron impact or electron‐capture negative ionization?
[J].
High sensitivity of ortho-substituted polychlorobiphenyls in negative ion mass spectrometry (NCI-MS): a comparison with El-MS and ECD for the determination of regulatory PCBs in soils
[J].
Determination of polychlorinated biphenyl congeners in human milk by gas chromatography-negative chemical ionization mass spectrometry after sample clean-up by solid-phase extraction
[J].
Dietary habits and cooking methods could reduce avoidable exposure to PCbs in maternal and cord sera
[J].
Simultaneous analysis of organochlorinated pesticides (OCPs) and polychlorinated biphenyls (PCBs) from marine samples using automated pressurized liquid extraction (PLE) and Power Prep™ clean-up
[J].
Selective pressurized liquid extraction of pesticides, polychlorinated biphenyls and polybrominated diphenyl ethers in a whale earplug (earwax): a novel method for analyzing organic contaminants in lipid-rich matrices
[J].
Development of a accelerated solvent extraction and gel permeation chromatography analytical method for measuring persistent organohalogen compounds in adipose and organ tissue analysis
[J].
Optimization of the ionization conditions for the trace analysis of PCDD/PCDF with ion trap MS/MS
[J].
Combination of solid phase microextraction and low energy electron ionisation gas chromatography-quadrupole time-of-flight mass spectrometry to meet the challenges of flavour analysis
[J].
Spatial–temporal variation, possible source and ecological risk of PCBs in sediments from Songhua River, China: effects of PCB elimination policy and reverse management framework
[J].
Distribution, sources and ecological risk assessment of polychlorinated biphenyl in sediments from Songhua River basin
[J].
松花江流域河流沉积物中多氯联苯的分布, 来源及风险评价
[J].
Residues and ecological risk assessment of polychlorinated biphenyls in suburban vegetable soils of Jilin City
[J].
吉林市城郊蔬菜土壤中多氯联苯残留特征及生态风险评价
[J].
Dioxin-like chemicals in soil and sediment from residential and industrial areas in central South Africa
[J].
Historical trends of PCDD/Fs and dioxin-like PCBs in sediments buried in a reservoir in Northern Taiwan
[J].
Estimation and characterization of PCDD/Fs and dioxin-like PCBs from secondary copper and aluminum metallurgies in China
[J].

 甘公网安备 62010202000676号