


0 引言
目前对冰湖空间分异的内在驱动因素研究基本停留在对冰湖性质上,使用定量的方法较少。殷永胜等[17]利用逐步回归分析了不同流域的各种因素对冰湖变化的整体影响,是以冰湖变化速率作为分析中的因变量,而自变量主要考虑的是气候因素。不足之处就在于逐步回归要求各因素相互对立,但是冰湖的面积变化影响因素显然是相互影响的,例如温度的变化影响着各区域冰川变化[18]。刘佳丽等[19]分析了西藏区域近25年湖泊变迁及驱动力分析,从气候影响、人为影响分别讨论了驱动该地区湖泊变化的因素,结果说明人类活动影响对西藏湖泊环境干扰越来越严重,但气候仍占主要影响因素。参数最优地理探测器,可以对所有连续型数据进行最优离散化,选择生成q值最高的离散化方法,用以探测冰湖变化背后驱动因子以及各因子之间空间分异性[20-23]。本文以中国西藏自治区为研究区,利用第三极冰湖数据库开放数据,提取了区域内1990年、2015年冰湖数据,使用GIS软件及参数最优地理探测器方法,分析了西藏区域内冰湖的空间分布变化规律,探测西藏区域内冰湖变化的主要影响因子及交互作用机制。本文为西藏地区发生GLOF的潜在风险评估以及危险性分析提供基础信息与数据支持。
1 数据与方法
1.1 研究区概况
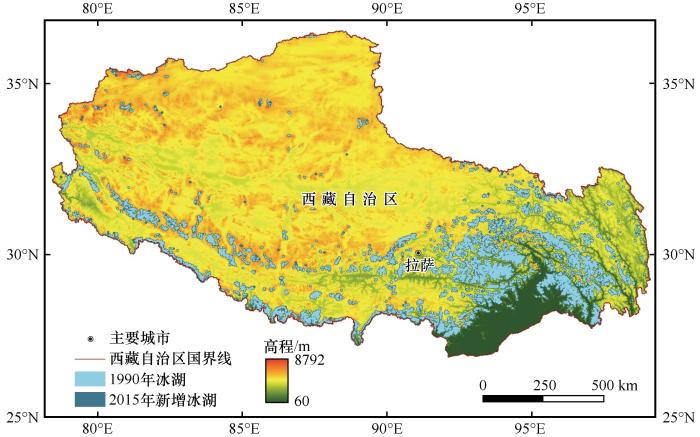
西藏自治区位于26°50′~36°53′ N,78°25′~99°06′ E之间,面积为122.8×10⁴ km²,约占中国陆地总面积的1/8,平均海拔在4 000 m以上。西藏自治区下辖6个地级市、1个地区(8个市辖区、66个县,合计74个县级行政区划单位)[24]。西藏地区受西风带天气和印度洋暖湿气流的影响,干湿季节差异明显,气候变化影响显著。该地区降水主要集中在东南部,并且在西北地区降水极少,时间上也集中在5—9月,占全年降水量的90%左右;大部分地区全年平均温度低于0 ℃,其中只有藏南谷地年平均温度在8 ℃上下[25]。由于西藏区域社会经济系统的脆弱性,暴发频繁、危险性高的自然灾害往往会对当地社会经济造成巨大影响[26]。
图1
1.2 数据来源
(1)冰湖数据。本研究主要数据源来自于学者Zheng等[27]提供的第三极冰湖开源数据:
(2)DEM数据。SRTM数字高程模型(DEM),主要从地理空间数据云获取,分辨率为30 m。使用ArcGIS 10.8提取区域内的海拔。
(4)冰川编目数据。第三极地区冰川编目评价数据(1990—2015年),从国家青藏高原科学数据中心获取,主要反映第三极地区内1990—2015年的冰川状况[33]。
1.3 影响因子选取
表1 冰湖变化影响因子
Table 1
| 冰湖变化Y | 要素 | 因子 |
| 地形 | 冰湖海拔 | |
| 气候 | 年总降水 年平均温度 年平均湿度 | |
| 冰川 | 冰川面积变化 | |
| 人文 | GDP | |
| 人口密度 |
1.4 研究方法
(1)标准差椭圆(standard deviational ellipse, SDE)是一种由社会学家Lefever提出的,能够精确揭示地理要素的整体空间分布特征,反映研究对象的多维空间特征的方法。SDE主要参数的计算公式如下:
旋转角:
式中:(
(2)采用Pearson相关分析揭示冰湖面积变化与各环境因子的相关关系。其中,影响因子的相关系数大于0表示正相关,相关系数小于0表示负相关。相关系数的绝对值越大,表示冰湖变化与影响因子之间的相关性越近。P值用于检验两个变量之间相关系数的显著性。P<0.05表明相关系数在95%的可信度水平下具有显著性,相关性计算公式如下:
式中:n为样本量;x、y为变量的观测值。
(3)地理探测器是由王劲峰等[20]提出的一种新的统计方法,这种方法可以用来检测多种空间单元下多种因素的影响及其相互关系,但传统的地理探测器模型对连续性数据的离散化处理需要人工进行设定,其中存在离散不够准确以及人为主观因素的影响。参数最优地理探测器可以计算所有连续型数据不同分级方式下以及不同间断数下的q值:
式中:
地理探测器还可以用来识别影响因子之间的相互作用,即分析多因子之间共同作用和相互独立作用对冰湖变化的影响力大小。本文使用的影响因子皆存在着相互影响的关系,例如相对湿度影响区域的降水,冰湖海拔影响区域的温度,温度变化又会影响区域内的冰川面积变化。
(4)对影响冰湖变化的七个环境影响因子:冰湖海拔、年总降水、年平均温度、年平均湿度、冰川面积变化、GDP、人口密度,计算五种分级方法:equal(等间距分级法)、natural(自然间断点分级法)、quantile(分位数间距分级法)、geometric(几何间距分级法)和sd(标准偏差间距分级法),以及不同间断等级下的影响解释力(q值),选择q值最高的参数组合。
图2
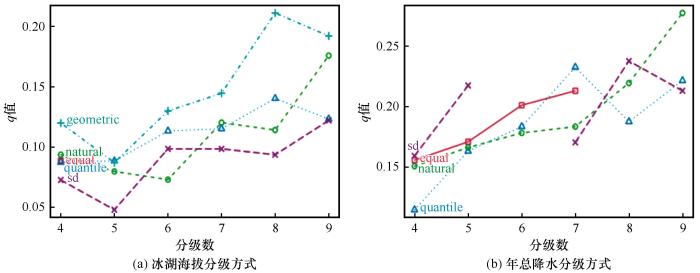
图2
冰湖海拔、年总降水分级方式
Fig. 2
Classification method of glacial lake elevation and precipitation: classification method of glacial lake elevation (a); classification method of precipitation (b)
图3
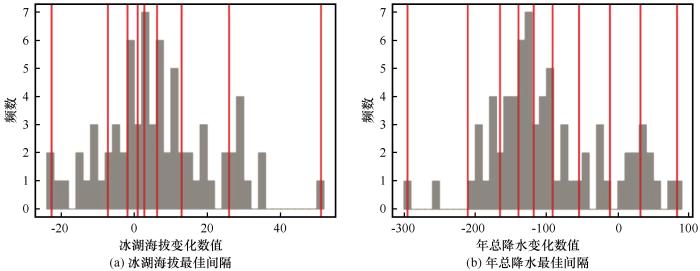
图3
冰湖海拔、年总降水最佳间隔
Fig. 3
Optimum interval between glacial lake elevation and precipitation: optimum interval between glacial lake elevation (a); optimum interval between precipitation (b)
2 西藏自治区冰湖时空变化与影响因素分析
2.1 冰湖时空变化
2.1.1 不同区县冰湖分布变化
对西藏冰湖数量进行统计制图,整体来看,1990年至2015年西藏地区冰湖分布格局并没有显著的变化(图4)。从区域上看,冰湖数量分布东部大于西部,南部大于北部,由藏东南向西北方向逐步递减趋势。由图可知,1990年至2015年间,冰湖数量减少的区县单位数量有30个,数量不变的有4个,数量增加的有37个,25年间增加数量最多的是察隅县,减少最多的是巴宜区。
图4
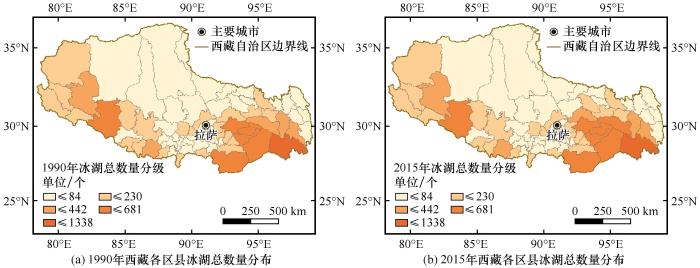
图4
1990年、2015年西藏各区县冰湖总数量分布
Fig. 4
The total quantity distribution of glacial lakes by districts and counties in Tibet in 1990 and 2015: the total quantity distribution of glacial lakes by districts and counties in Tibet in 1990 (a); the total quantity distribution of glacial lakes by districts and counties in Tibet in 2015 (b)
图5
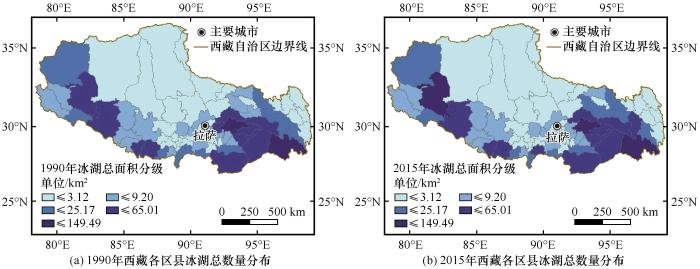
图5
1990年、2015年西藏各区县冰湖总面积分布
Fig. 5
The total area of glacial lakes in Tibet by district and county in 1990 and 2015: the total area of glacial lakes in Tibet by district and county in 1990 (a); the total area of glacial lakes in Tibet by district and county in 2015 (b)
根据数据统计,1990年至2015年西藏地区冰湖数量由1990年的11 164个增加到2015年的11 465个,冰湖增长数量为301个,增长了约2.69%;1990年冰湖总面积约为942.20 km2,2015年冰湖总面积约为1 002.00 km2,增长了约6.34%。
25年间,区县内冰湖总面积分布没有发生显著的变化,只有少部分区县内冰湖面积缩小,整体分布规律与冰湖数量分级图大体一致。25年间,冰湖面积增加的区县数量有32个,增加最多的是巴宜区;冰湖面积减少的区县数量有39个,减少最多的是工布江达县。
2.1.2 不同规模冰湖的分布变化
不同规模的冰湖因高度而异。1990年面积在0.01~0.1 km²之间的冰湖,主要分布在3 500~6 000 m海拔之间,并且规模较小的冰湖分布海拔更高,多在4 500~6 000 m之间;而面积大小在0.1~1 km²的冰湖,大多分布在4 000~5 700 m的海拔;面积大于1 km²的冰湖,数量较少,基本都分布在3 500~5 000 m海拔之中。
图6
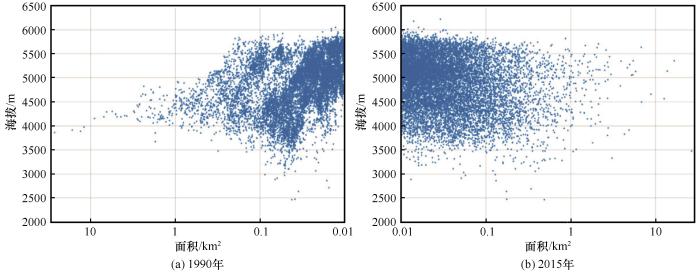
图6
1990年、2015年不同面积冰湖分布
Fig. 6
Distribution of glacial lakes in different areas in 1990 and 2015
2015年,在不同海拔高度,各种规模大小的冰湖在急剧扩张,在3 500~4 500 m之间也开始形成较多面积在0.01~0.1 km²之间的冰湖,而面积大于1 km²的冰湖,在3 000~6 000 m海拔之间均有分布,并集中于4 500~5 700 m海拔。
2.1.3 西藏冰湖空间分布趋势
统计1990年和2015年西藏冰湖的标准差椭圆参数(表2),以每个区县所在地范围内冰湖总数量和冰湖总面积作为统计单元。25年来西藏冰湖不管是数量分布还是面积分布整体呈现增长趋势,并且所有标准差椭圆扁率偏大,冰湖变化方向性显著,数量分布和面积分布离散程度高;1990年和2015年西藏冰湖基本都分布在西藏东部和南部地区,中心向西偏移,说明冰湖数量增长和面积增长略微是由藏东南向藏西南方向发展,受经度影响大于纬度影响。
表2 西藏冰湖分布和面积标准差椭圆参数
Table 2
| 类型 | 时段 | 中心经度/E | 中心纬度/N | 短半轴 | 长半轴 | 扁率 | 方向角度/(°) |
|---|---|---|---|---|---|---|---|
| 冰湖数量 | 1990年 | 91.74° | 29.58° | 6.92 | 1.65 | 3.21 | 94.02 |
| 2015年 | 91.62° | 29.59° | 7.06 | 1.69 | 3.17 | 94.22 | |
| 冰湖面积 | 1990年 | 90.90° | 29.69° | 7.49 | 1.82 | 3.12 | 95.40 |
| 2015年 | 90.78° | 29.68° | 7.55 | 1.86 | 3.05 | 95.26 |
图7
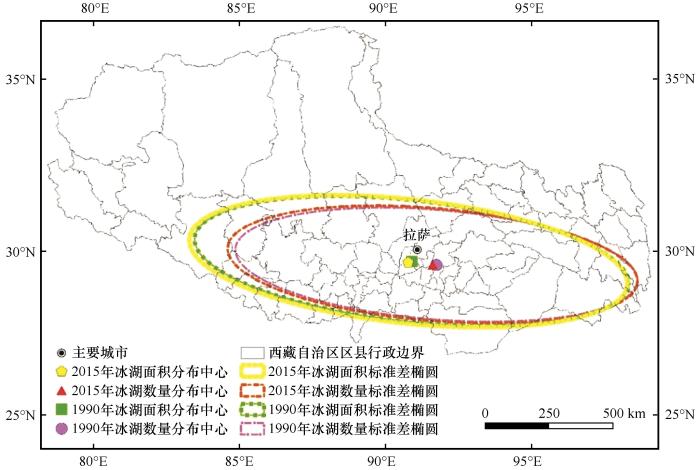
图7
西藏冰湖分布和面积标准差椭圆
Fig. 7
Standard deviation ellipse of the number and area of glacial lakes in Tibet
2.2 冰湖影响因素分析
2.2.1 Pearson相关分析结果
通过Pearson相关分析,揭示所选取各因子的相关性。如图8所示,在0.01级别的显著性检验中,冰湖变化与年总降水因子和冰川面积变化因子相关性显著,这证明了西藏地区冰湖变化主要受该地区降水量和冰川面积变化量的影响。其余因子均存在相互影响关系,例如冰川面积变化因子与年总降水因子和平均气温因子。
图8
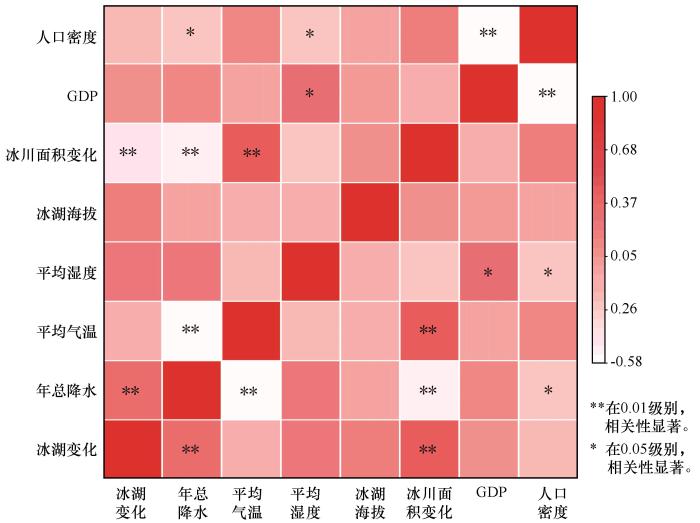
其中,在Pearson相关分析中,冰湖变化与冰川面积变化因子相关性最高,呈中度正相关;其次是总降水因子,呈中度正相关;然后是相对湿度因子和冰湖海拔因子,呈弱正相关,而与人口密度因子则呈弱负相关;最后是冰湖变化与平均气温因子和GDP因子不相关。说明25年间,西藏冰湖变化主要受该地区冰川面积变化大小以及降水量大小影响,冰川面积变化增加,降水量增加,冰湖面积扩张越显著。
2.2.2 参数最优地理探测器分析结果
进一步利用参数最优地理探测器对影响冰湖变化的影响因子进行探测,从空间角度分析各因子对冰湖变化的影响程度,并探索各因子之间的交互作用机制。
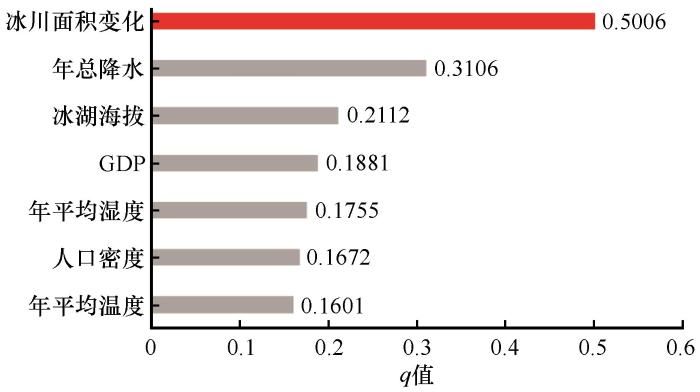
通过参数最优地理探测器,探测出各环境因子对冰湖变化的影响解释力。由图9可知,本文选取的各环境因子,对西藏地区冰湖变化均有不同程度的影响。其中,冰川面积变化对冰湖变化影响强度最高(q值为0.5006),其次是年总降水(q值为0.3106),年平均温度对冰湖变化影响强度最低(q值为0.1601),其余因子对冰湖变化影响强度均低于0.25。q值大小排名:冰川面积变化>年总降水>冰湖海拔>GDP>年相对湿度>人口密度>年平均温度。从因子探测可以看出,冰湖变化主要受冰川面积变化和年总降水量的影响,尤其是冰川面积变化,在其中起主导作用。
图9
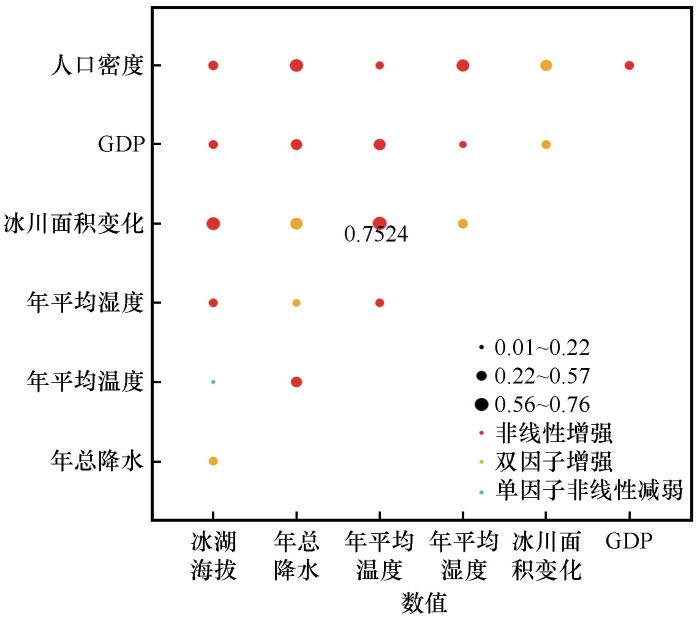
通过交互探测器(图10)可以得知,尽管年平均温度因子单因子影响强度最低,其与冰川面积变化因子交互作用后影响强度最高,q值为0.7542,说明两因子协同作用过后可以解释75%的冰湖变化,但是冰川面积变化与其余气候因子和人文影响因子则呈双因子增强关系,这意味冰川面积变化与其余因子交互作用后对冰湖影响程度稍低。另外,大多数因子之间交互作用呈现非线性增强关系,各因子之间交互作用后的影响力均大于单因子的影响力,说明冰湖变化受各因子交互作用影响强度高。
图10
3 讨论
空间上,不同规模大小的冰湖在不同的海拔高度都有增加,增长最多的是小型冰湖(面积小于0.1 km2)。25年来西藏地区冰湖整体呈现增长趋势,并且冰湖变化方向性显著,数量分布和面积分布离散程度高;西藏冰湖基本都分布在西藏东部和南部地区,分布中心向西偏移,说明冰湖数量增长和面积增长略微是由藏东南向藏西南方向发展。出现这种分布特征的原因可能是因为藏东南区域内分布着很多的海洋型冰川,其退缩速率大于西藏其他区域的大陆型冰川,对冰湖补给量比其他区域多[39]。
通过Pearson相关分析结果和参数最优地理探测器结果,发现两种方法均分析出冰川面积变化和降水量在冰湖变化中起着至关重要的作用,可以解释大部分的冰湖变化。冰湖作为当地居民重要水资源之一,人类活动频繁对冰湖存在一定程度上的影响,人口密度增加,GDP的增加象征着区域内经济的发展,人口增长、经济发展意味着用水量增加,但西藏区域整体呈增长趋势,说明人类生产生活对冰湖影响很有限。其次,气温因子在两种分析方法中影响力均是最低。这表明,在25年时间里,西藏地区地处青藏高原,冰湖对温度变化的响应不强烈,在研究冰湖溃决洪水的潜在危险性时,可以重新考虑温度对其的影响程度。上述分析表明,西藏自治区不同区域的冰湖规模增长速率不同,各地需因地制宜地采取不同方法进行对冰湖溃决洪水的防治。
4 结论
本研究运用标准差椭圆、参数最优地理探测器等方法,对西藏区域内冰湖的空间分布变化规律,冰湖变化的主要影响因子及交互作用机制进行研究分析,得出了以下结论:
(1)西藏地区冰湖总数增加了303个,增长约为2.57%,增加数量最多的区县单位是察隅县;西藏地区冰湖总面积增长了约为6.32%,冰湖面积增加最多的区县单位是巴宜区。各个面积大小的冰湖在不同的海拔都有显著的增长,其中多数增长是规模较小冰湖(面积小于0.1 km2),并且分布在海拔3 500 m~6 000 m之间。25年来西藏冰湖增长方向性显著,数量分布和面积分布离散程度高;1990年和2015年西藏冰湖基本分布在西藏东部和南部地区,中心向西偏移,受经度影响大于纬度影响。
(2)在Pearson相关分析中,冰湖变化与冰川面积变化因子相关性最高,其次是总降水因子,二者均呈中度正相关;然后是相对湿度因子和冰湖海拔因子,呈弱正相关,而冰湖变化与人口密度因子则呈弱负相关;最后是冰湖变化与平均气温因子和GDP因子不相关。说明25年间,西藏冰湖变化主要受该地区冰川面积变化大小以及降水量大小影响,冰川面积变化增加,降水量增加,冰湖面积扩张越显著。
(3)从空间角度利用地理探测器方法探测西藏地区冰湖变化影响因素。其中,冰川面积变化对冰湖变化影响强度最高(q值为0.5006),其次是年总降水(q值为0.3106),年平均温度对冰湖变化影响强度最低(q值为0.1601)。单因子角度上,冰川面积变化因子和年总降水因子对该地区冰湖变化影响程度高。当年平均温度因子与冰川面积变化因子交互作用后对冰湖变化影响强度最高,且呈非线性增强关系,说明二者共同驱动下会影响西藏地区冰湖变化。而人为影响因子对西藏地区冰湖变化影响程度不高,主导因素还是气候变化与冰川面积变化,需重点关注区域内气候变化与冰川退缩对冰湖造成的影响。
参考文献
Definition and classification systems of glacial lake for inventory and hazards study
[J].
冰湖的界定与分类体系——面向冰湖编目和冰湖灾害研究
[J].
Wide expansion of glacial lakes in Tianshan Mountains during 1990-2010
[J].
近20年天山地区冰湖变化特征
[J].
Mass loss from calving in Himalayan proglacial lakes
[J].
A method for estimating the probability of glacial lake outburst floods based on logistic regression and geodetector: a case study of the Himalayan region
[J].
Genetic types and distribution of glacial lakes in Western Sichuan and Eastern Tibet
[J].
川西藏东地区冰湖主要成因类型与分布规律
[J].
Hazard assessment of moraine-dammed lake outburst floods in the Himalayas, China
[J].
我国喜马拉雅山区冰碛湖溃决危险性评价
[J].
Natural hazards in Tibetan Plateau and key issue for feature research
[J].
青藏高原自然灾害发育现状与未来关注的科学问题
[J].
Expansion of glacial lakes and its implication for climate changes in the Chinese Himalaya
[J].
我国喜马拉雅山区冰湖扩张特征及其气候意义
[J].
Glacial Lake variation and hazard assessment of glacial lakes outburst in the Parlung Zangbo River Basin
[J].
帕隆藏布流域冰湖变化及危险性评估
[J].
Increased outburst flood hazard from Lake Palcacocha due to human-induced glacier retreat
[J].
An integrative method for identifying potentially dangerous glacial lakes in the Himalayas
[J].
The responses of glaciers and snow cover to climate change in Xinjiang (II): hazards effects
[J].
新疆冰川、积雪对气候变化的响应(II):灾害效应
[J].
Identification of glacier motion and potentially dangerous glacial lakes in the Mt. Everest region/Nepal using spaceborne imagery
[J].
An overview of glacial lake outburst flood in Tibet, China
[J].
我国西藏地区冰湖溃决灾害综述
[J].
An approach for estimating the breach probabilities of moraine-dammed lakes in the Chinese Himalayas using remote-sensing data
[J].
Characteristics and influence factors of the glacial lake changes in China from 1990 to 2020
[J].
1990—2020年中国冰湖变化特征及影响因素
[J].
Application of remote sensing and GIS for evaluation of the recent morphological characteristics of the lower Brahmaputra-Jamuna River, Bangladesh
[J].
Dynamics and driving forces of lake changes in Tibet during the past 25 years
[J].
西藏近25 a湖泊变迁及其驱动力分析
[J].
Geodetector: principle and prospective
[J].
地理探测器: 原理与展望
[J].
Spatial-temporal pattern and driving factors of flash flood disasters in Jiangxi Province analyzed by optimal Parameters-Based Geographical Detector
[J].
基于参数最优地理探测器的江西省山洪灾害时空格局与驱动力研究
[J].
Study on the relationship between glacier change and topographic factors in the Shiyang River Basin
[J].
石羊河流域冰川变化与地形因子的关系探究
[J].
Research on influencing factors of glacier area change in Sichuan based on geographic detectors
[J].
基于地理探测器的四川地区冰川面积变化影响因素探究
[J].
Challenges to engineering geology of Sichuan—Tibet railway
[J].
川藏铁路对工程地质提出的挑战
[J].
Characteristics of debris flow in polongzangbu basin of Sichuan-Tibet Highway
[J].
川藏公路迫隆藏布流域段泥石流活动特征
[J].
The extreme climate background for glacial lakes outburst flood events in Tibet
[J].
西藏冰湖溃决灾害事件极端气候特征
[J].
Increasing risk of glacial lake outburst floods from future Third Pole deglaciation
[J].
Spatiotemporal trends and attribution of drought across China from 1901—2100
[J].
Assessment of climate change trends over the Loess Plateau in China from 1901 to 2100
[J].
Changes in extreme temperature and precipitation events in the Loess Plateau (China) during 1960—2013 under global warming
[J].
Spatiotemporal vegetation cover variations associated with climate change and ecological restoration in the Loess Plateau
[J].
Assessing the effects of land use and topography on soil erosion on the Loess Plateau in China
[J].
第三极地区冰川编目评价数据(1990—2015)
[DS].
China population spatial distribution kilometer grid dataset
[DS].
中国人口空间分布公里网格数据集
[DS].
China GDP spatial distribution kilometer grid dataset
[DS].
中国GDP空间分布公里网格数据集
[DS].
Prediction of glacial lake outburst floods based on geodetector and SVM: a case study of the Himalayan region
[J].
基于地理探测器与SVM的冰湖溃决预测研究——以喜马拉雅山地区为例
[J].
Change of the lakes in Tibetan Plateau and its response to climate in the past forty years
[J].
近40年来青藏高原湖泊变迁及其对气候变化的响应
[J].
Spatiotemporal variations of Chinese Lakes and their driving mechanisms since the Last Glacial Maximum: a review and synthesis of lacustrine sediment archives
[J].

 甘公网安备 62010202000676号