×
模态框(Modal)标题
在这里添加一些文本
Close
Close
Submit
Cancel
Confirm
×
模态框(Modal)标题
×
ISSN 1000-0240
CN 62-1072/P
RSS
|
Email Alert
Toggle navigation
Home
About Journal
Editorial Board
Authors
Publication Ethics
Journal Online
Current Issue
Online First
Archive
Most Read
Most Download
Most Cited
Subscription
Advertisement
Contact Us
中文
Figure/Table detail
Study on numerical modeling of thermokarst lake evolution and its thermal impacts on permafrost on the Qinghai-Tibet Plateau
Guo’an YIN, Fujun NIU, Zhanju LIN, Jing LUO, Minghao LIU
Journal of Glaciology and Geocryology
, 2022, 44(
2
): 355-365. DOI:
10.7522/j.issn.1000-0240.2022.0042
深度/m
土壤类型
体积含水(冰)量/(m
3
·m
-3
)
参数
a
参数
b
>0
~
2
砂土
0.3
0.07
0.17
>2
~
10
黏土
0.35
~
0.65
0.12
0.15
>10
砂岩
0.1
0.01
0.10
Table 2
Soil texture and the related model parameters
Other figure/table from this article
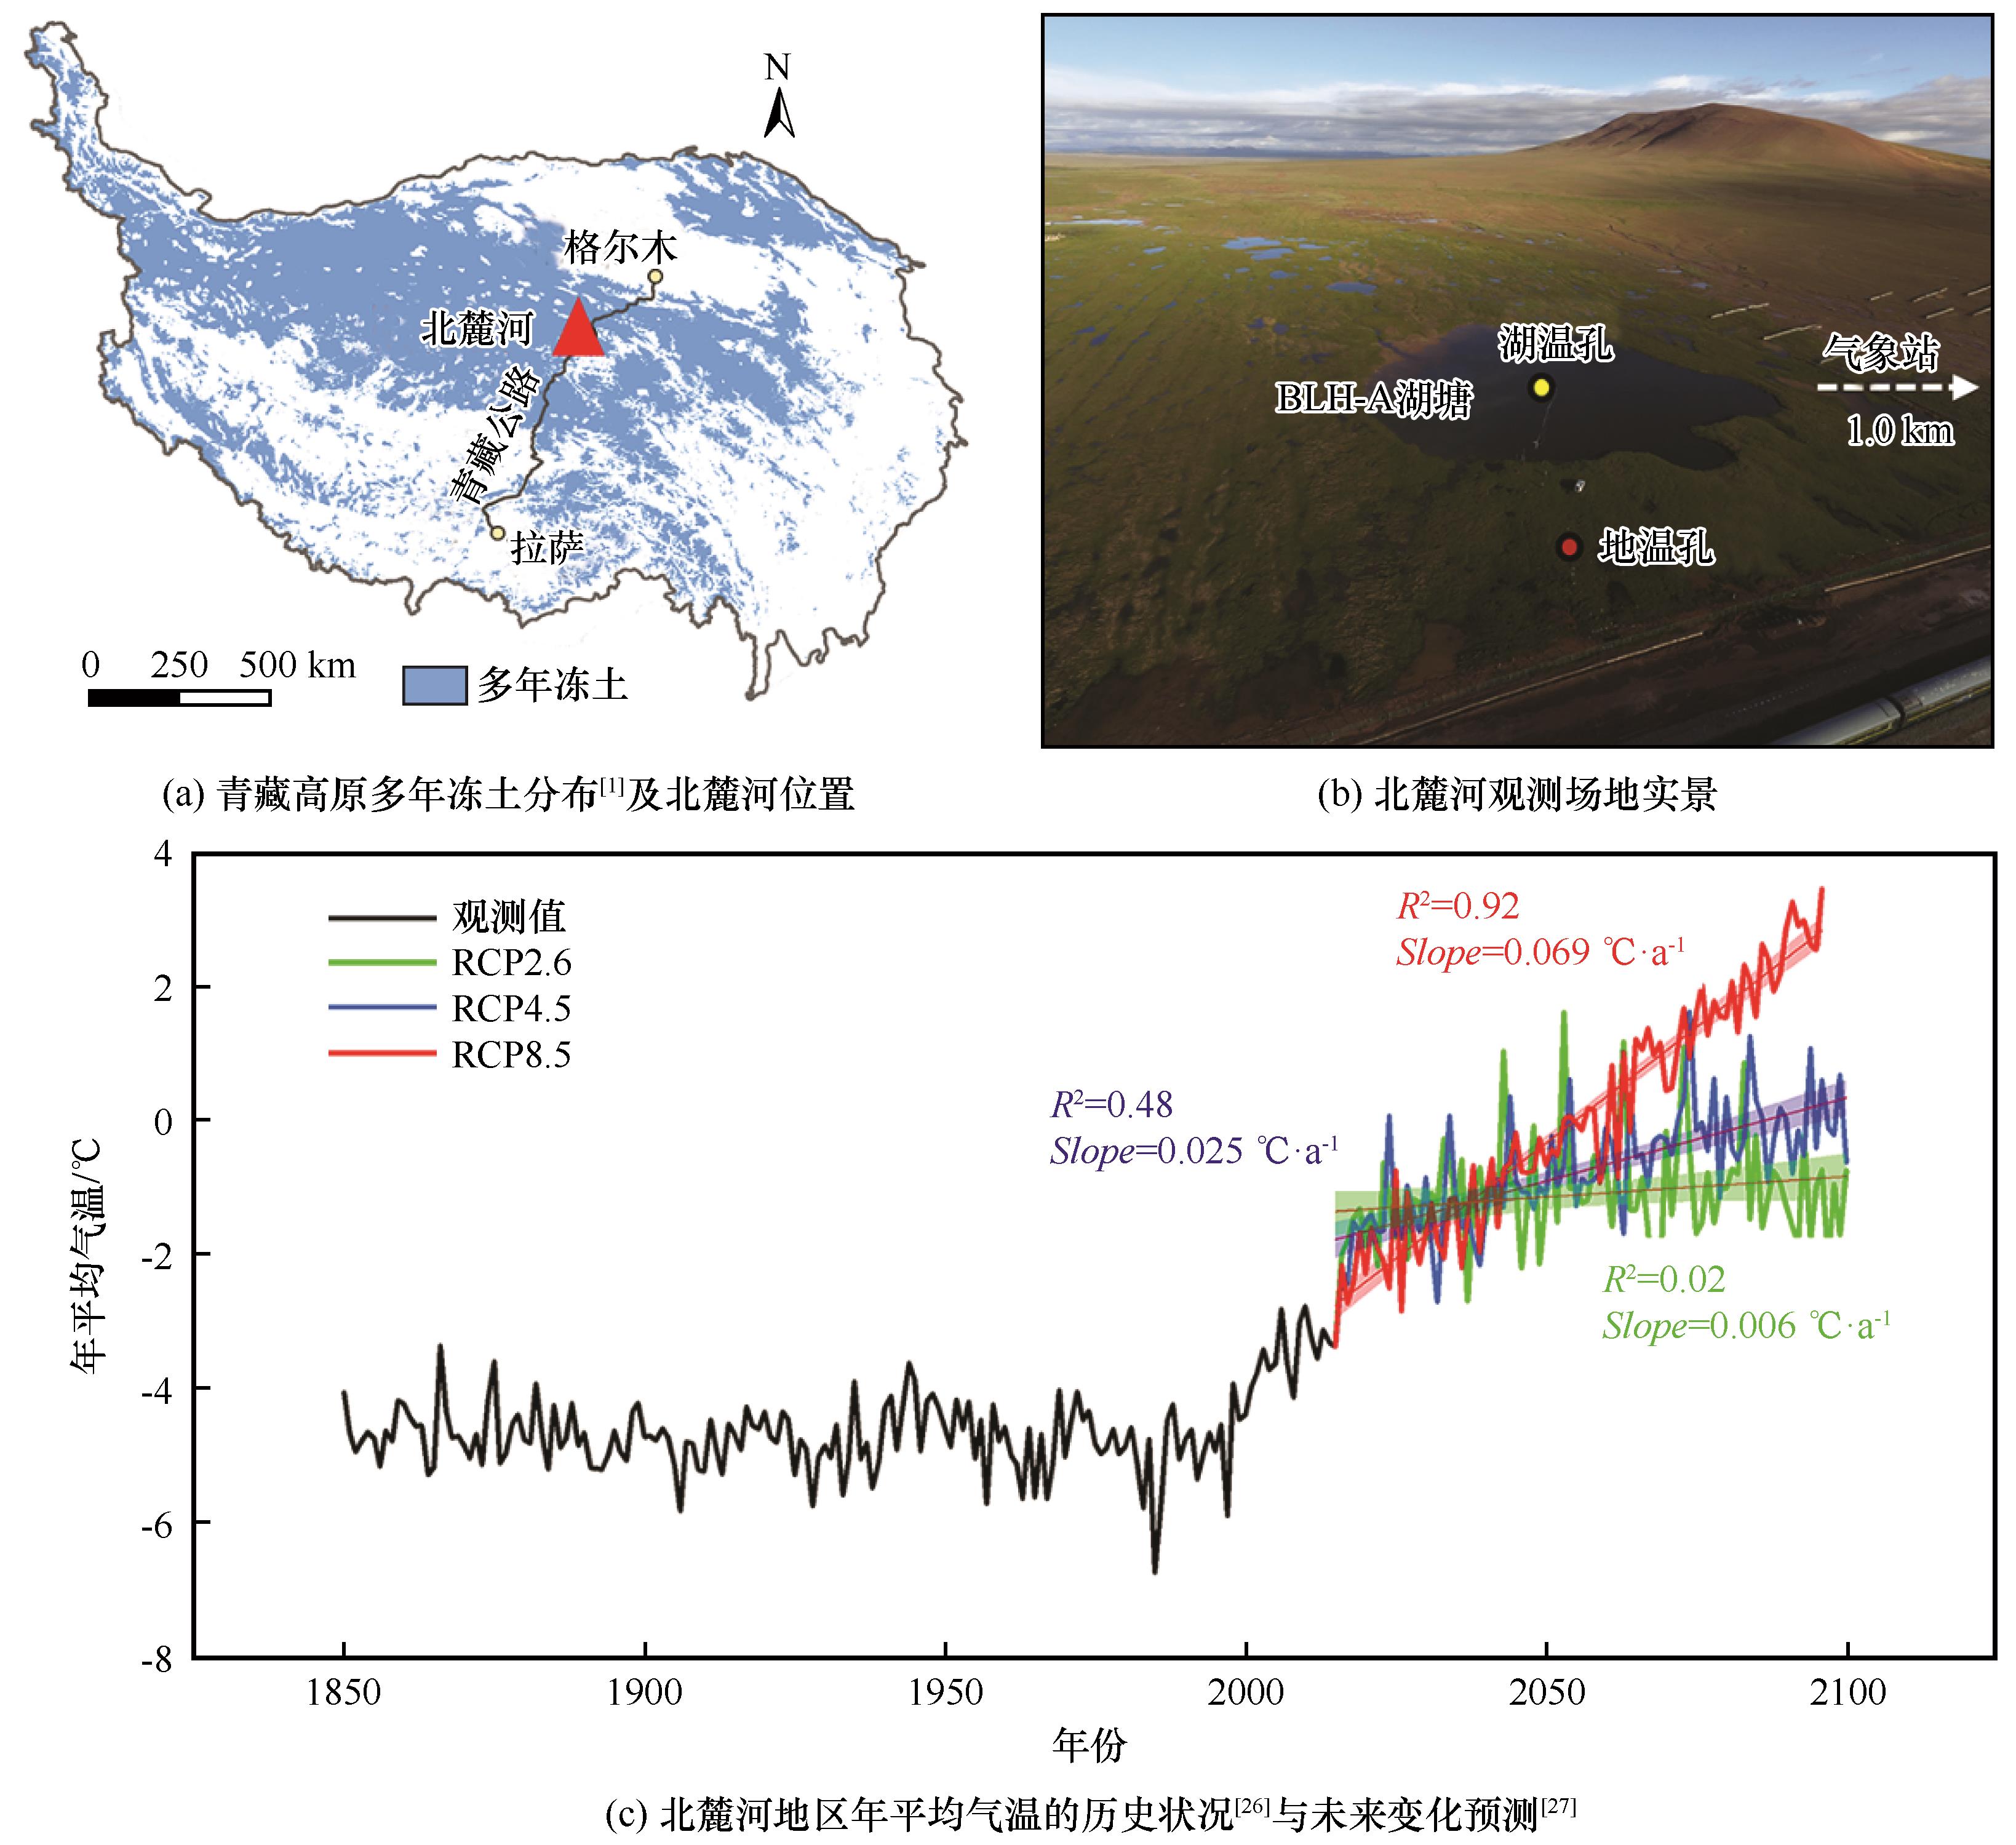
Fig. 1
Basic information of the study area: permafrost distribution on the Qinghai-Tibet Plateau (QTP)
[
1
]
and location of Beiluhe (a), picture of Beiluhe field observations (b) and annual mean air temperature in history period
[
26
]
and projections in the 21th century
[
27
]
of Beiluhe area (c)
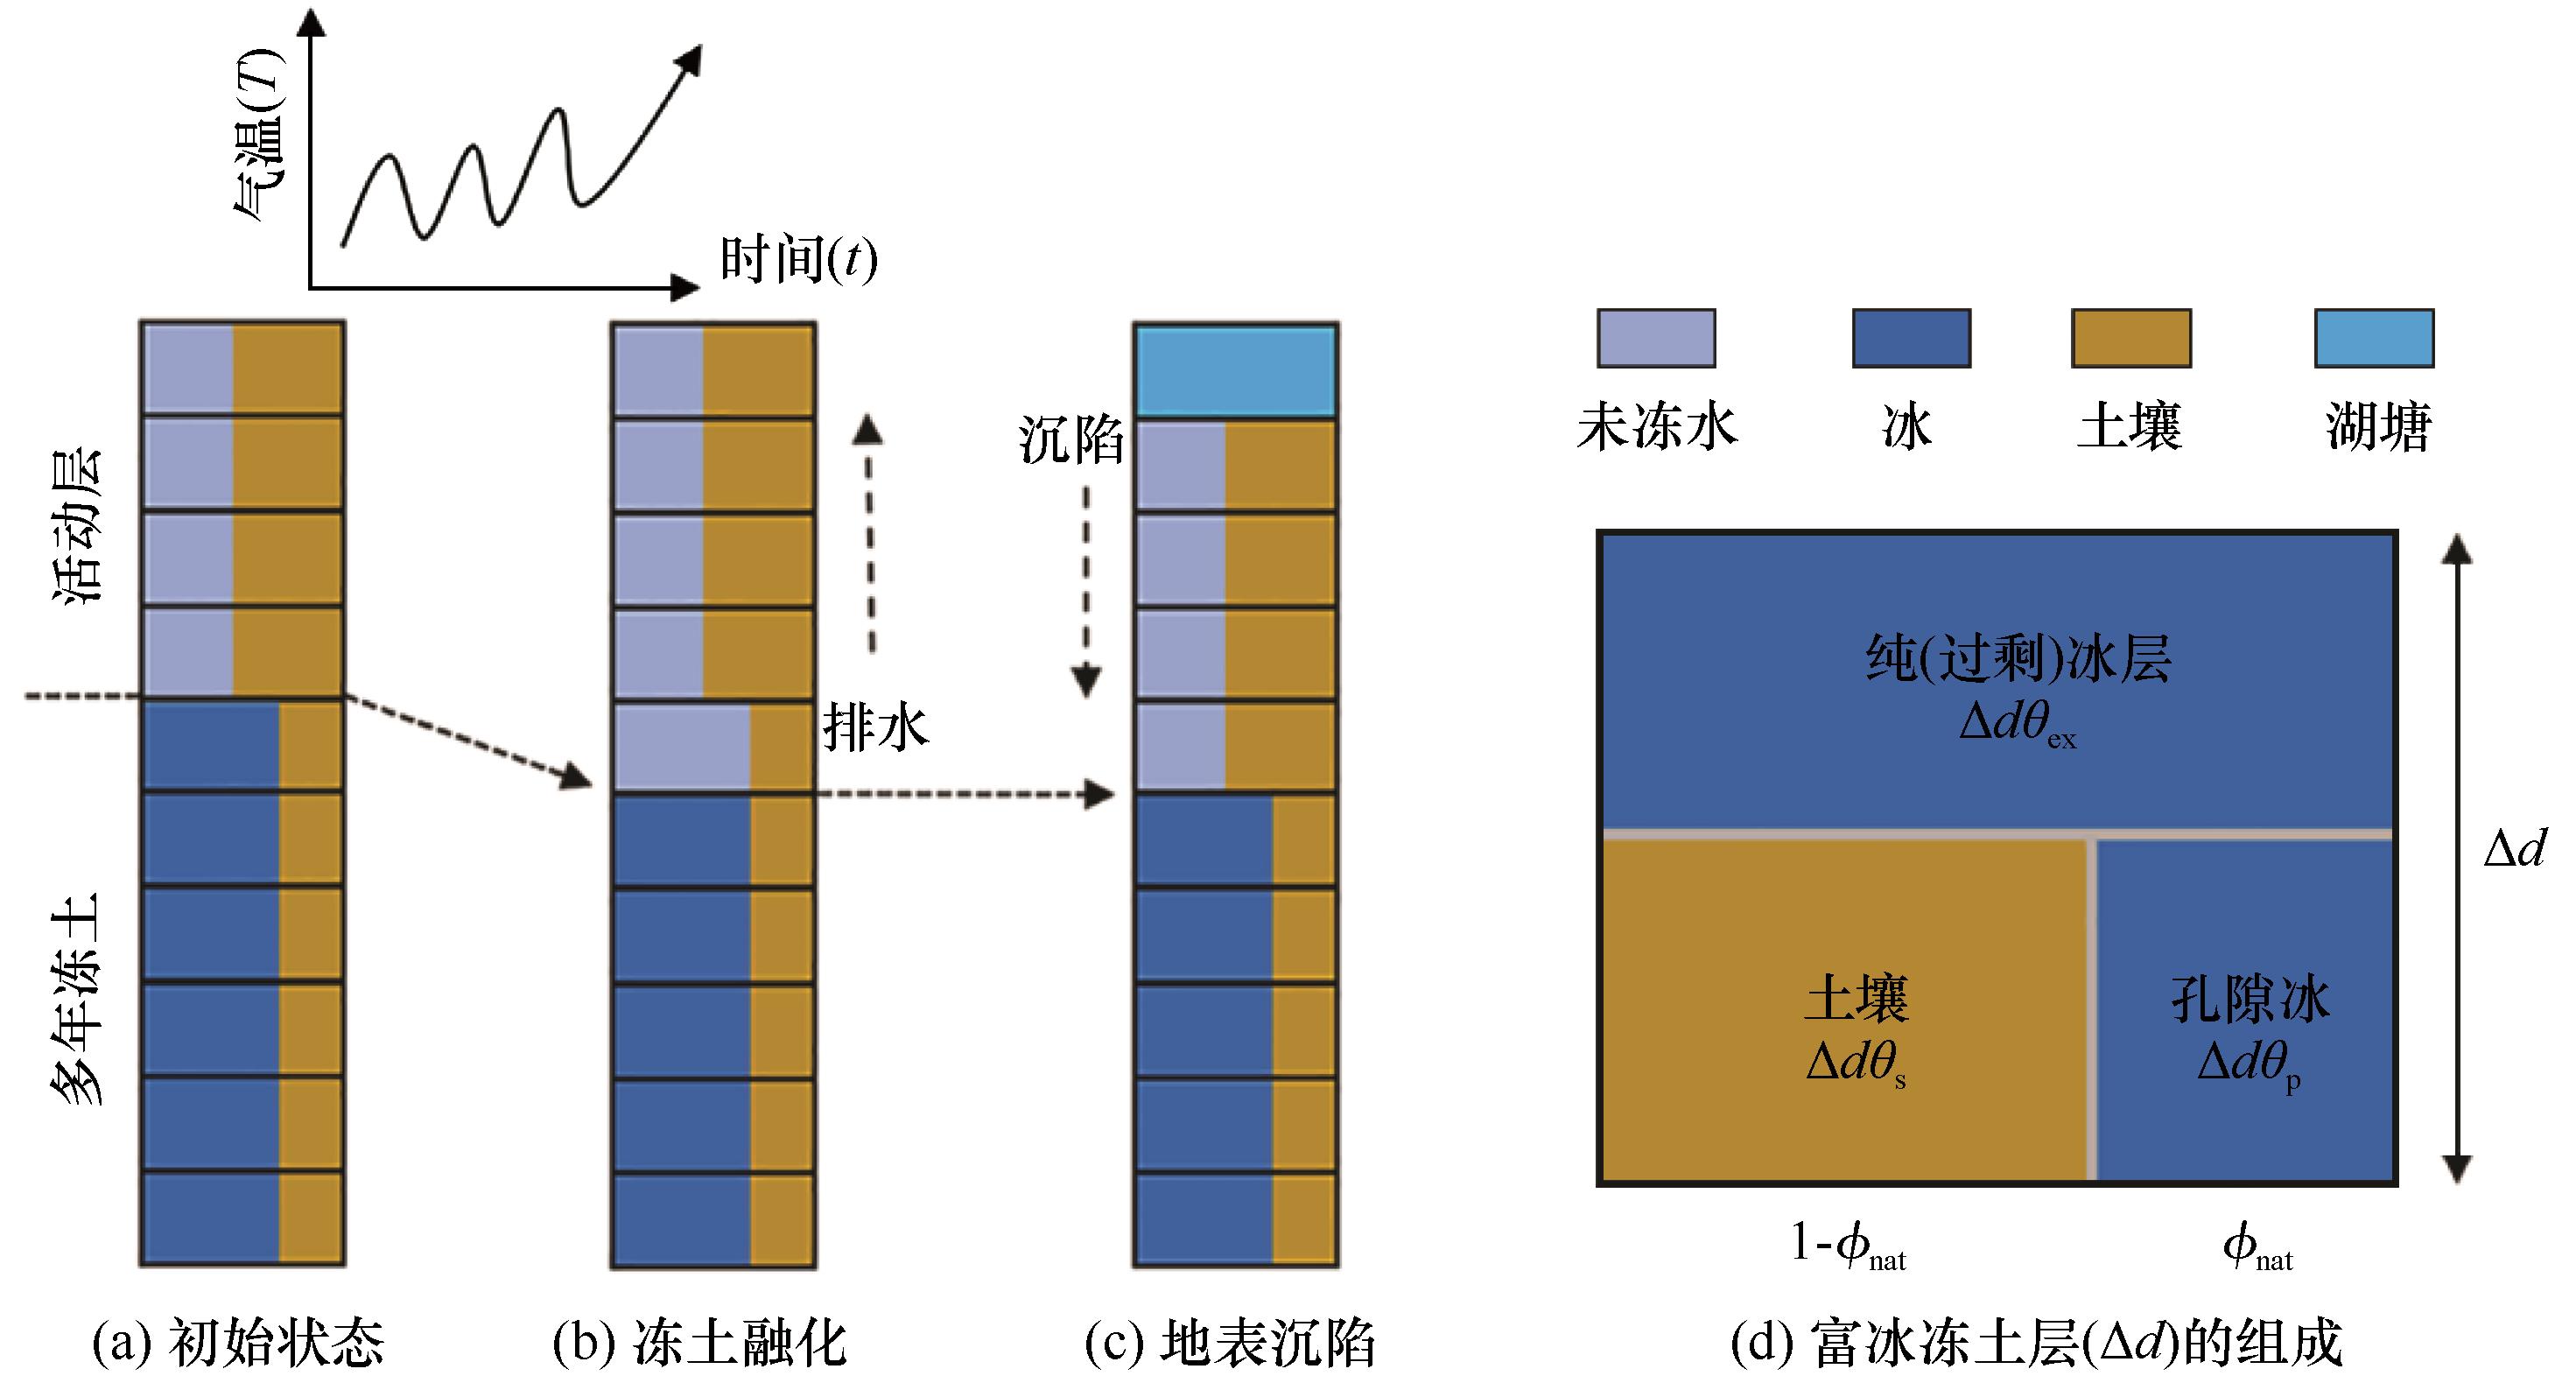
Fig. 2
A model depicting the formation process of thermokarst lake: initial state of ice-rich permafrost with excess ice (a), ice-rich permafrost is warming and the water is draining (b), subsided cells are added to lake depth (c) and schematic illustration of an ice-rich soil layer of thickness (
?
d
) which is composed of excess ice, pore ice and soil matrix (d)
Table 1
Physical parameters related to soil, water and ice
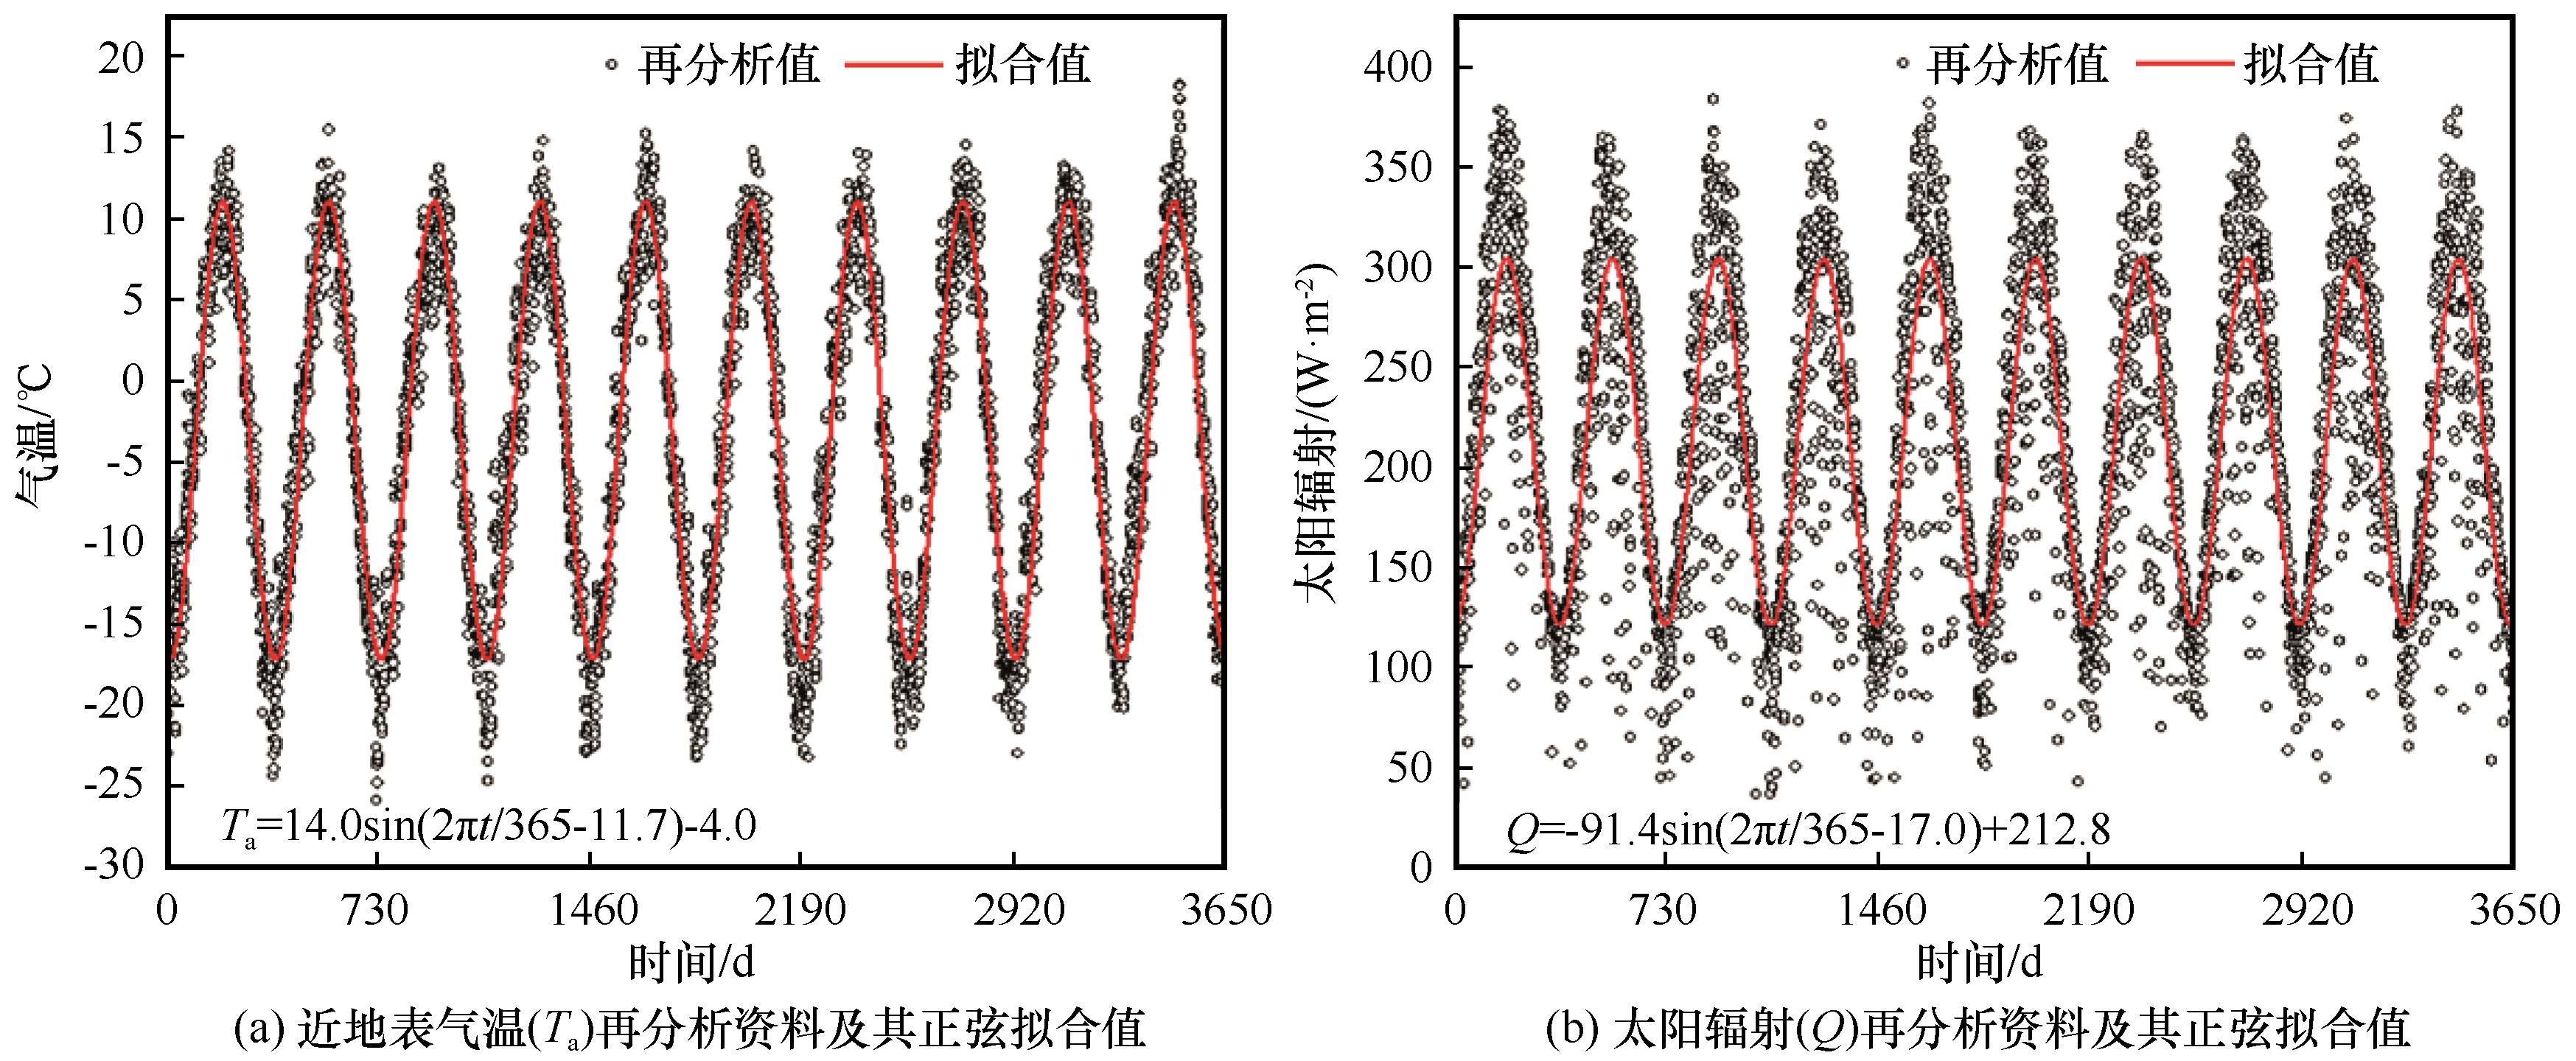
Fig. 3
Reconstruction of historical climate data for upper boundary of the model: daily air temperature (a) and solar radiation (b) (A sinusoidal fit to the data was used)
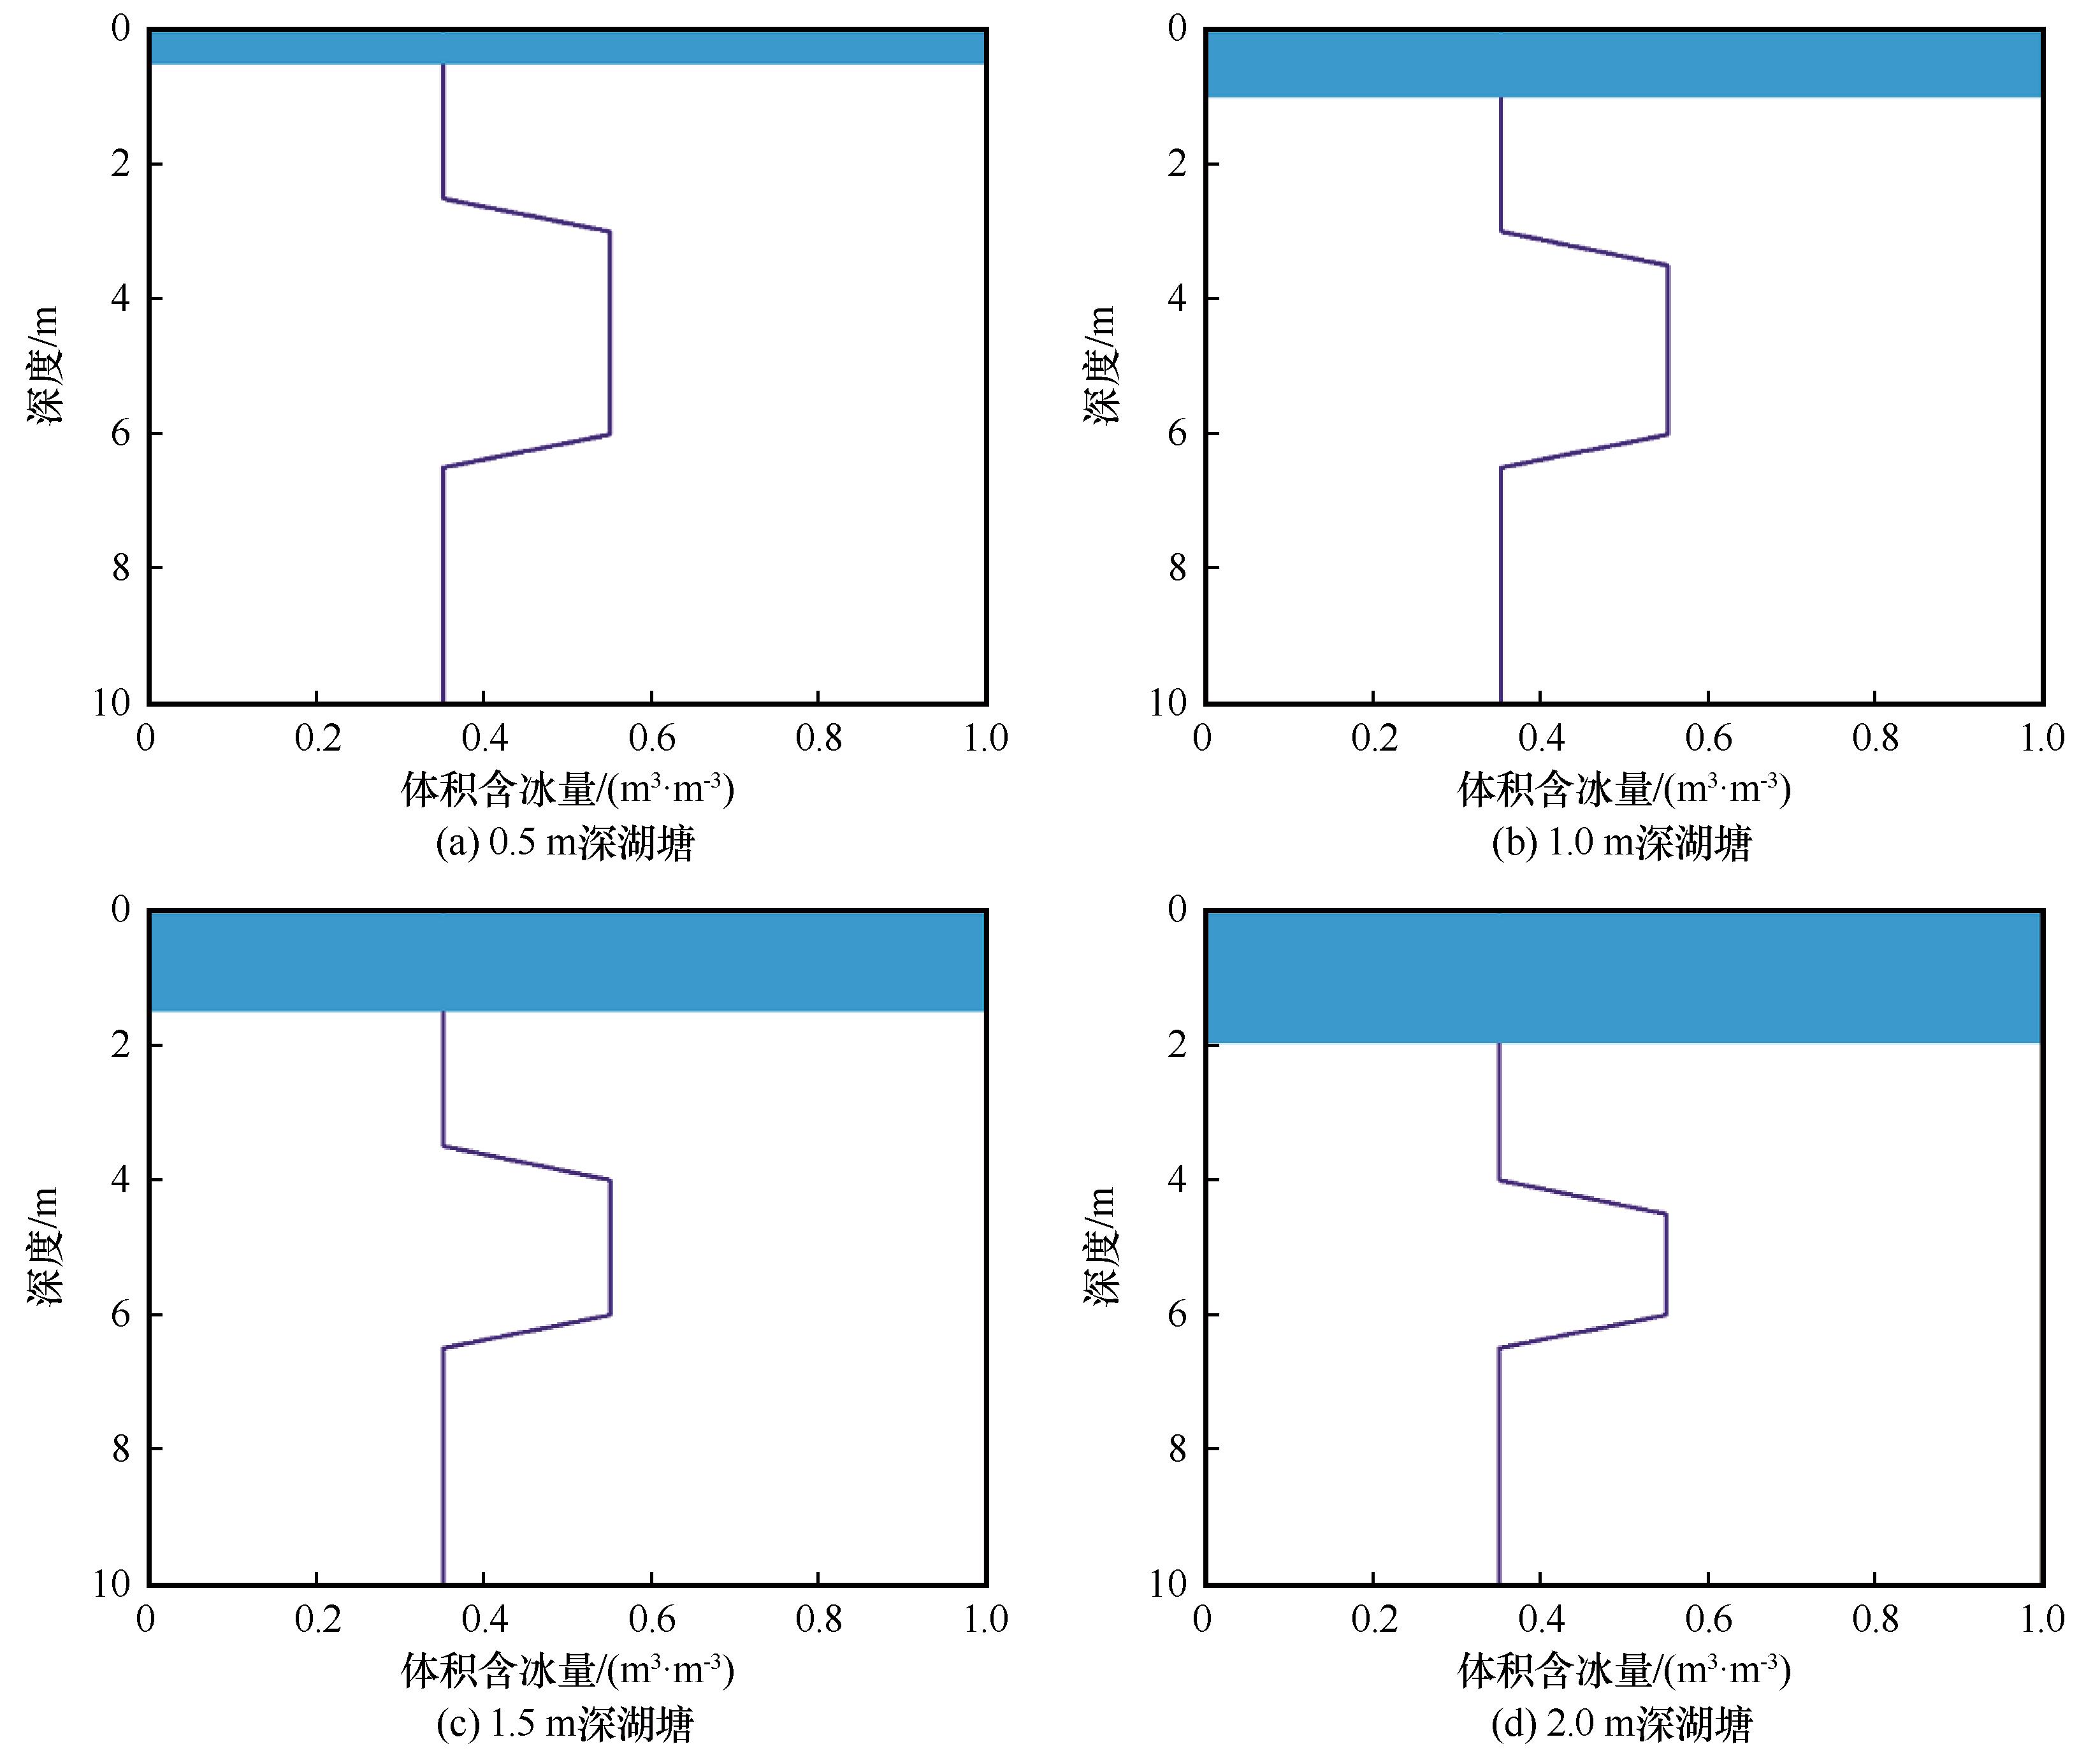
Fig. 4
Initial states of underground ice for the lake: 0.5 m deep (a), 1.0 m deep (b), 1.5 m deep (c) and 2.0 m deep (d)
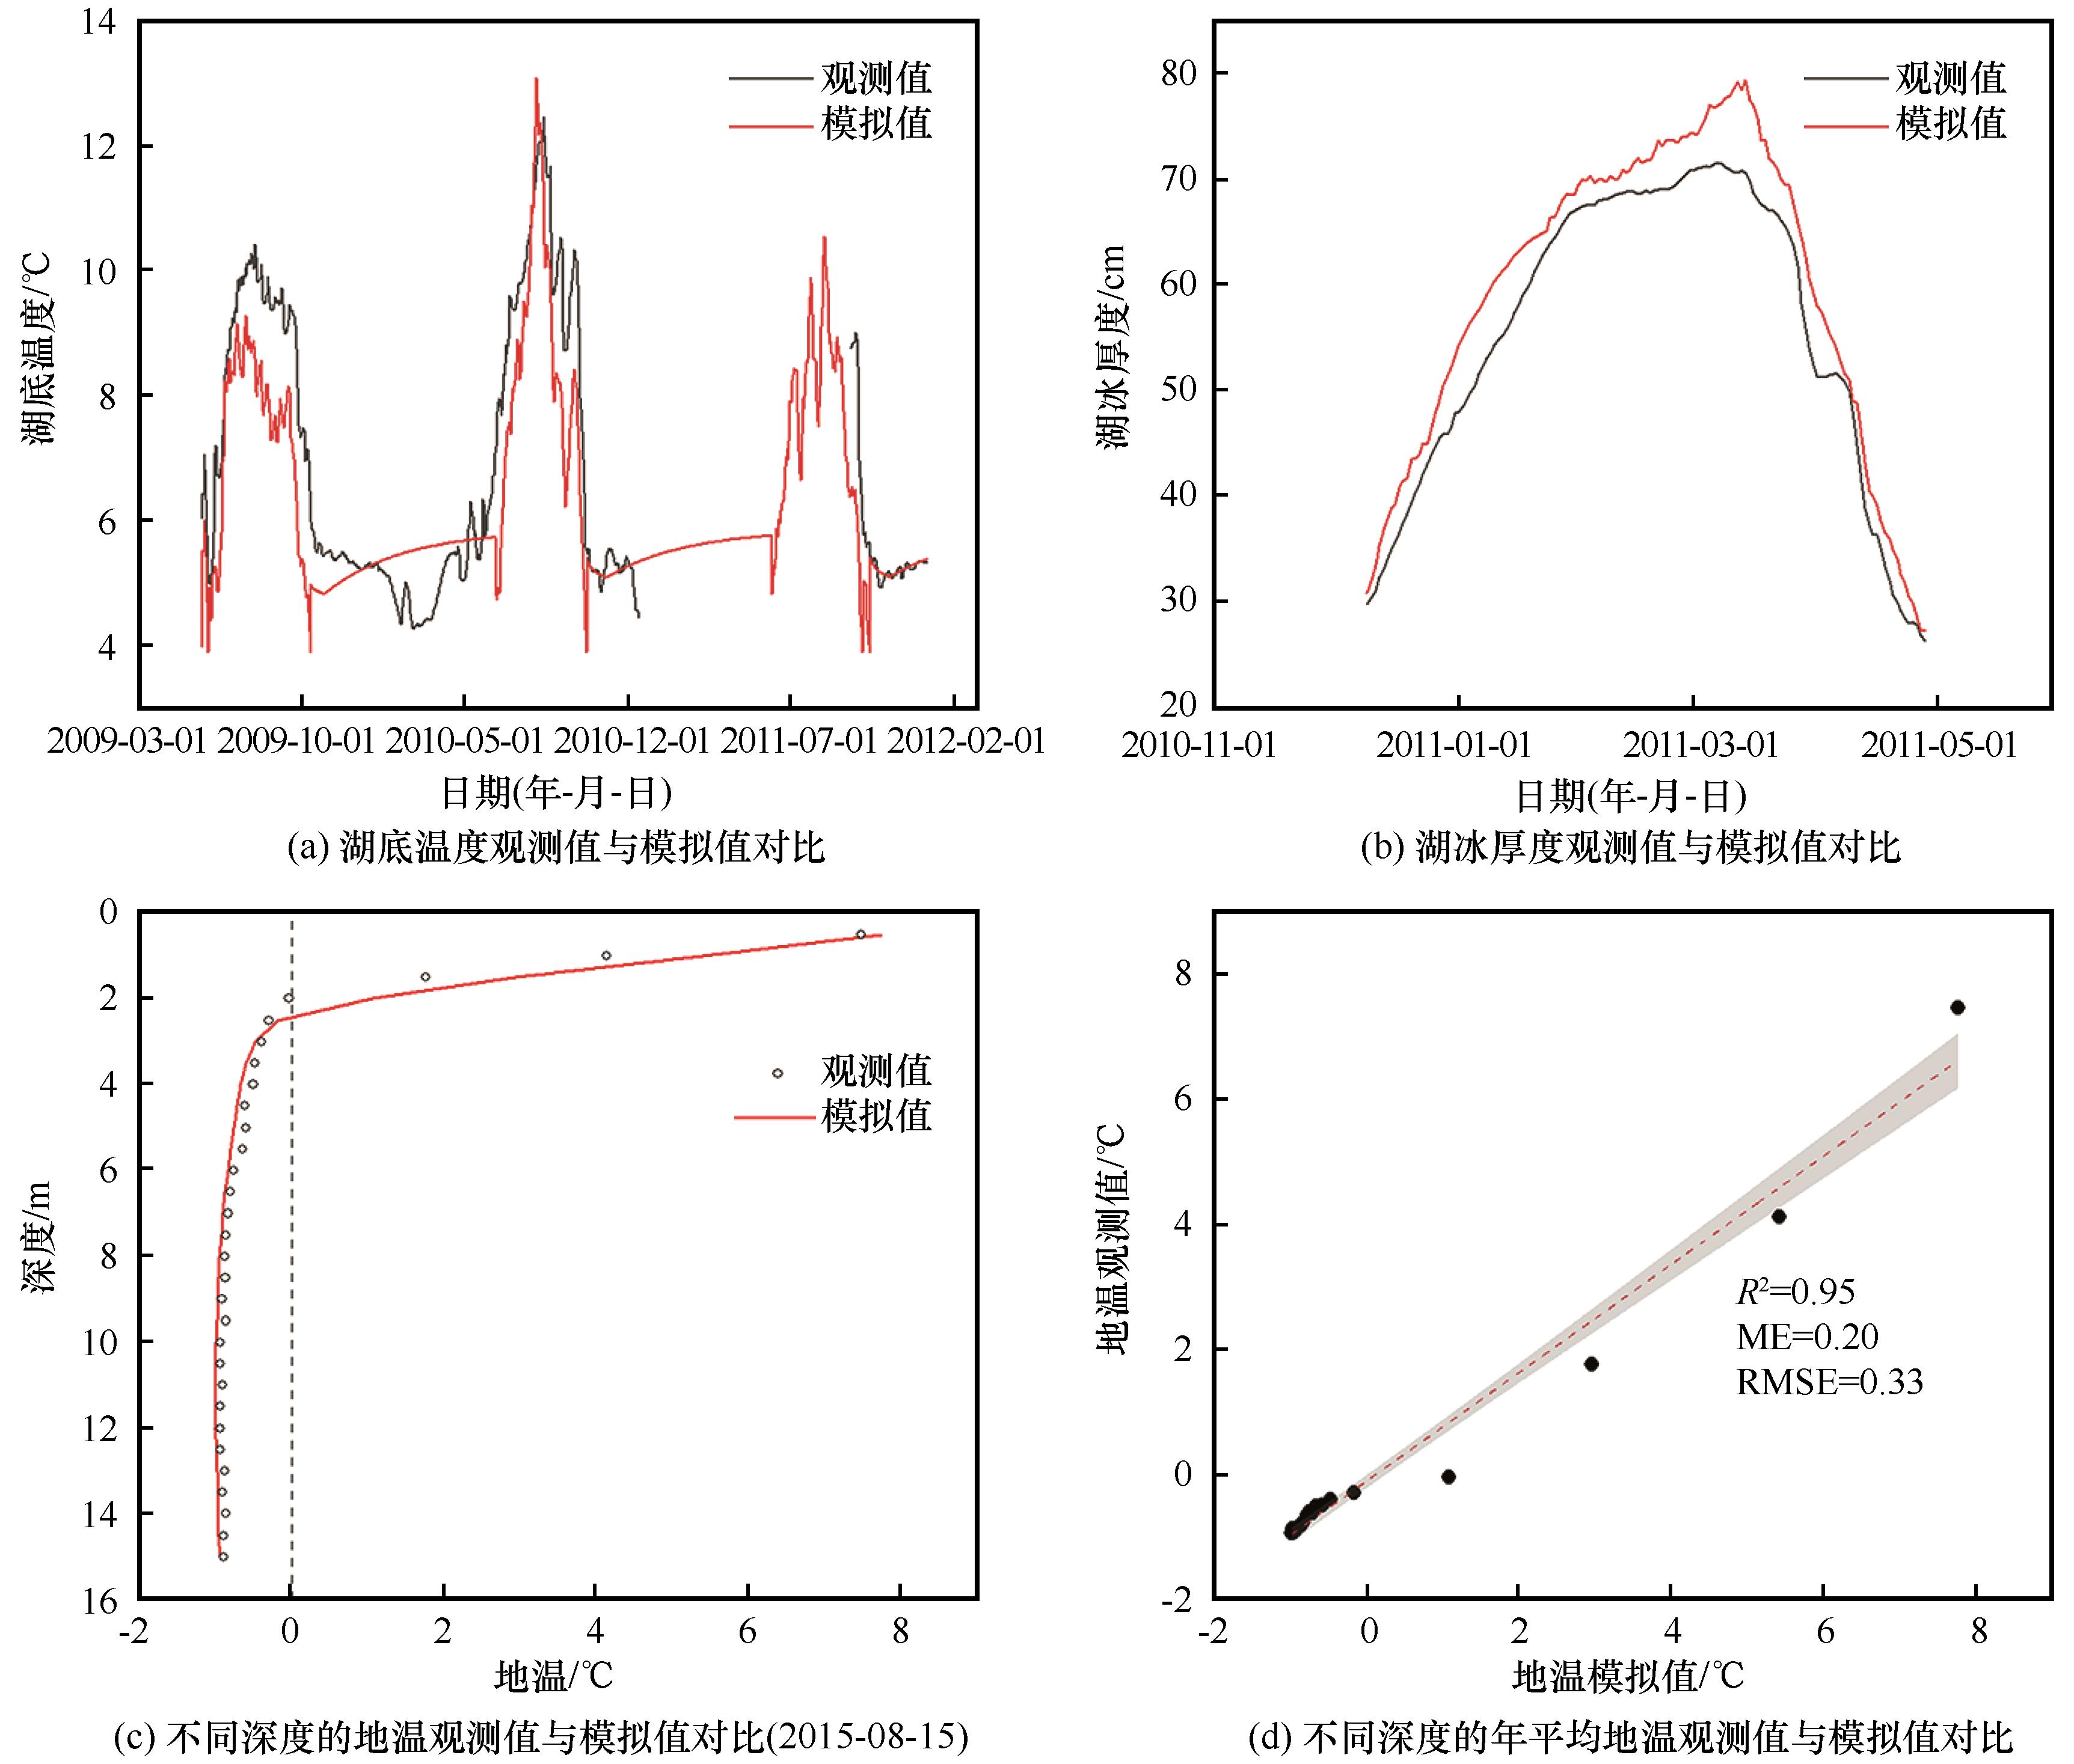
Fig. 5
Model validation: comparison between modeled and measured temperatures at bottom of the BLH-A Lake (a), comparison between modeled and measured lake ice thickness (b), comparison between modeled and measured ground temperatures at different depths on August 15, 2015 (c) and comparison between modeled and measured annual mean ground temperatures at different depths (d)
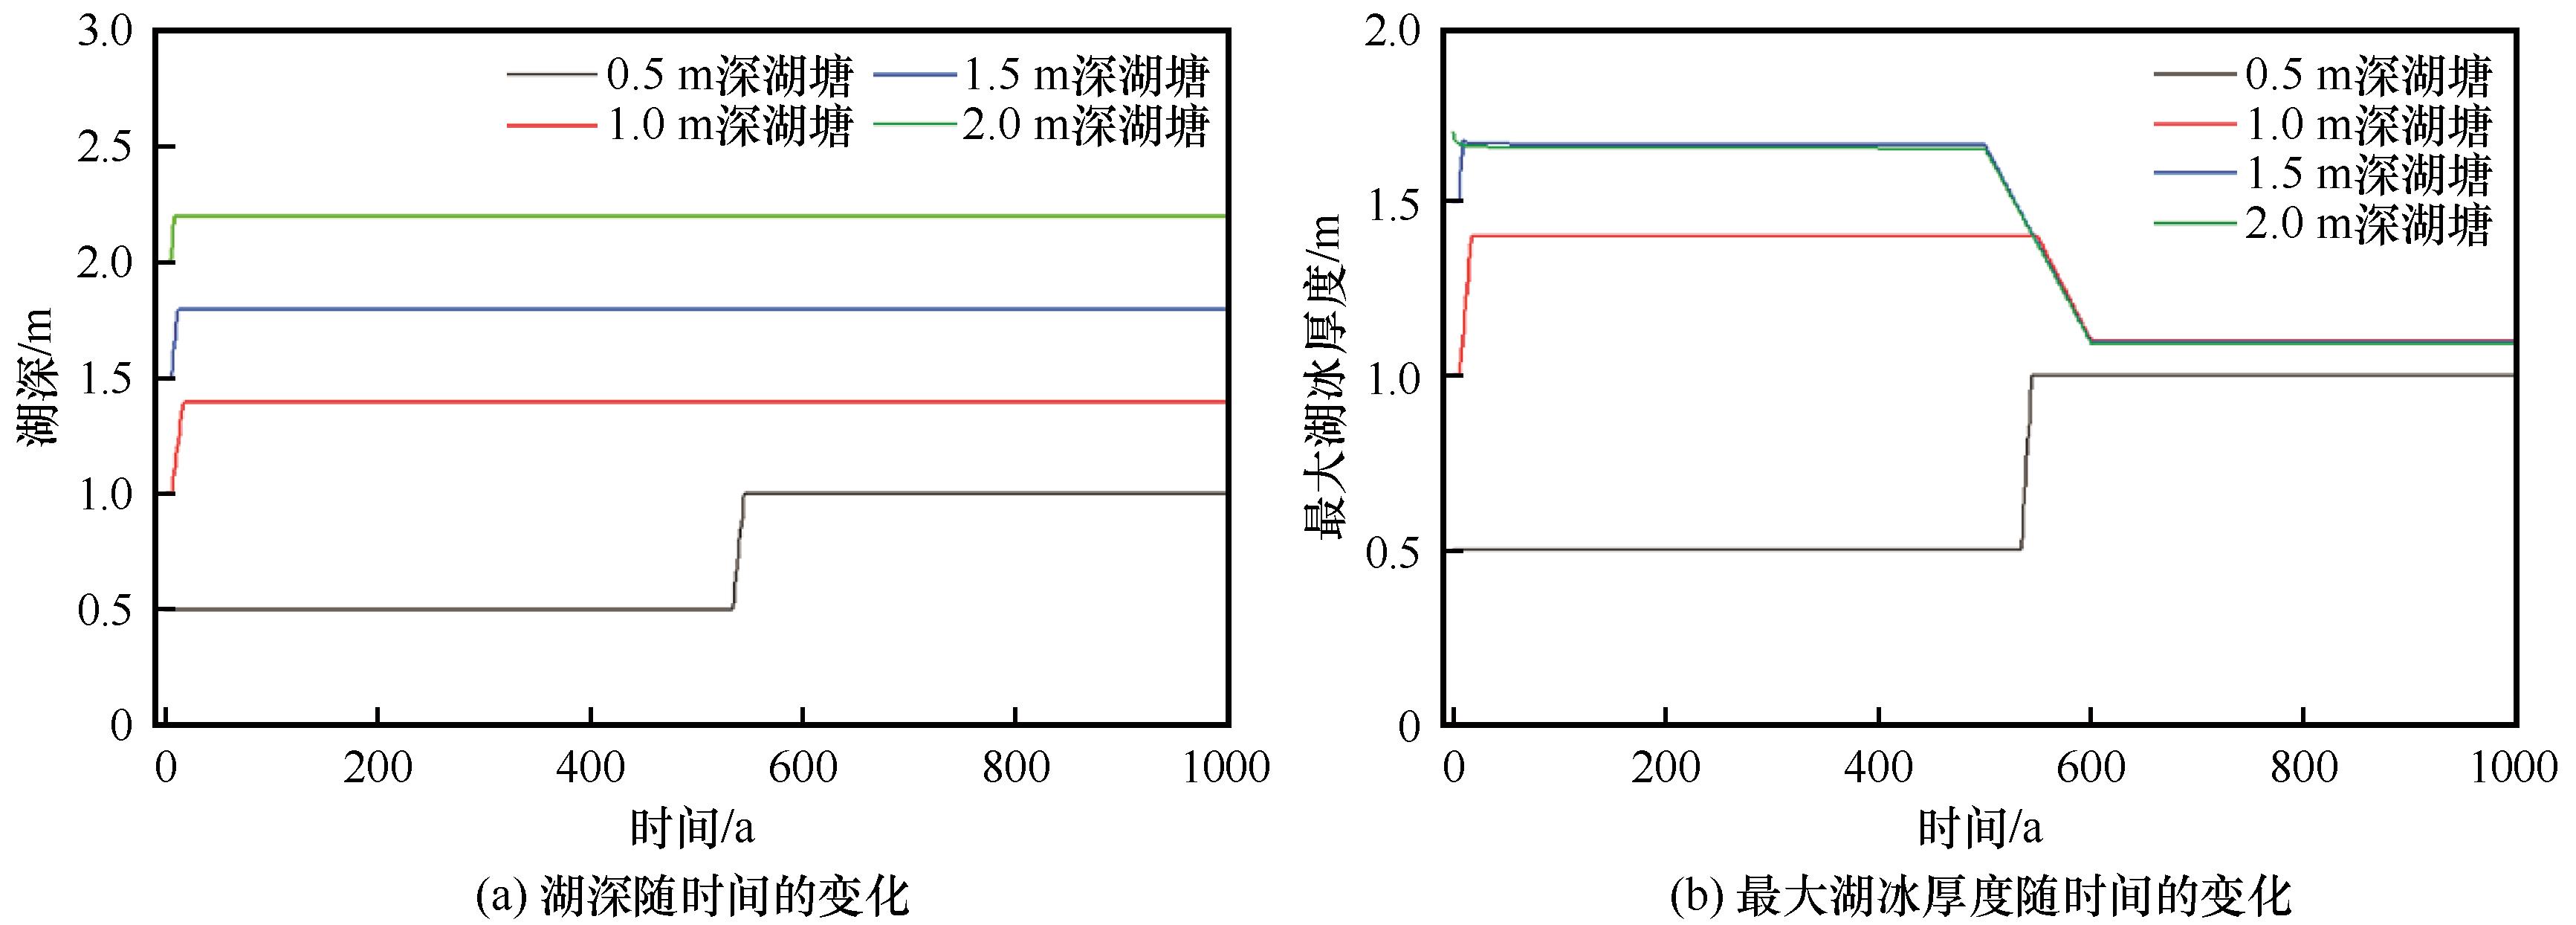
Fig. 6
Simulation results of lake depth (a) and maximum lake ice thickness (b)
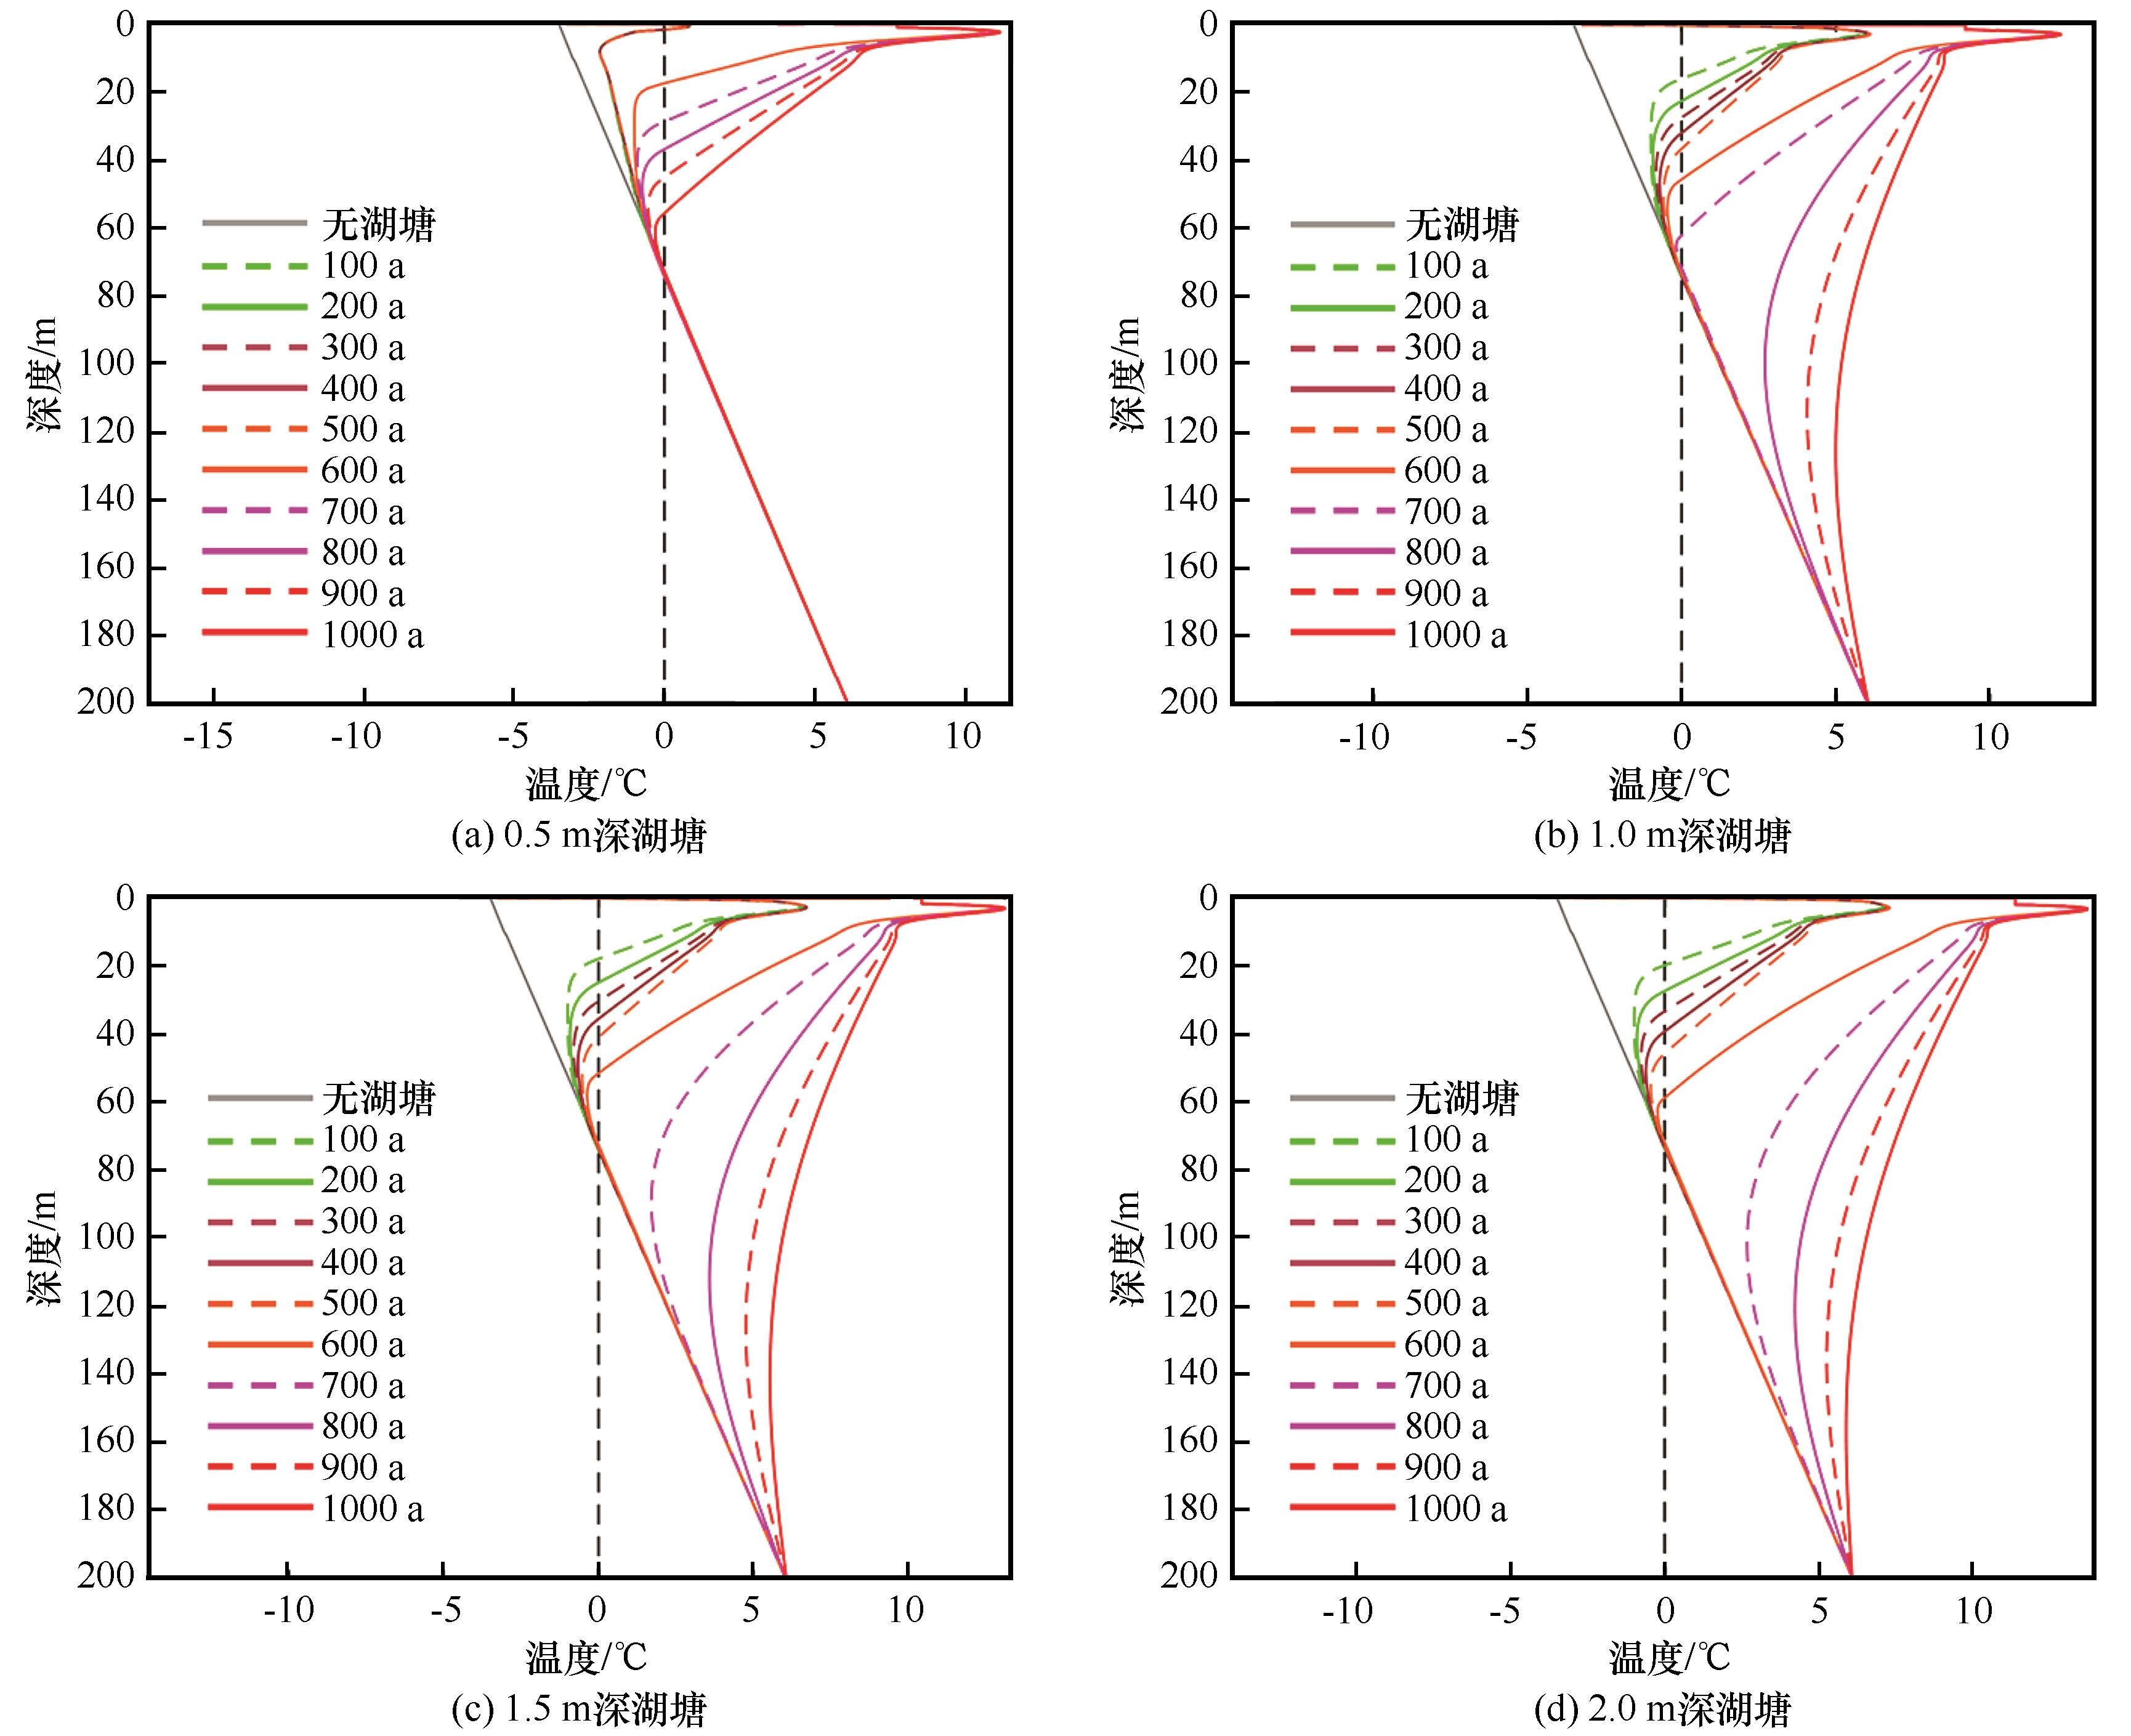
Fig. 7
Annual mean ground temperature profiles during simulation period for the lake: 0.5 m deep (a), 1.0 m deep (b), 1.5 m deep (c) and 2.0 m deep (d)
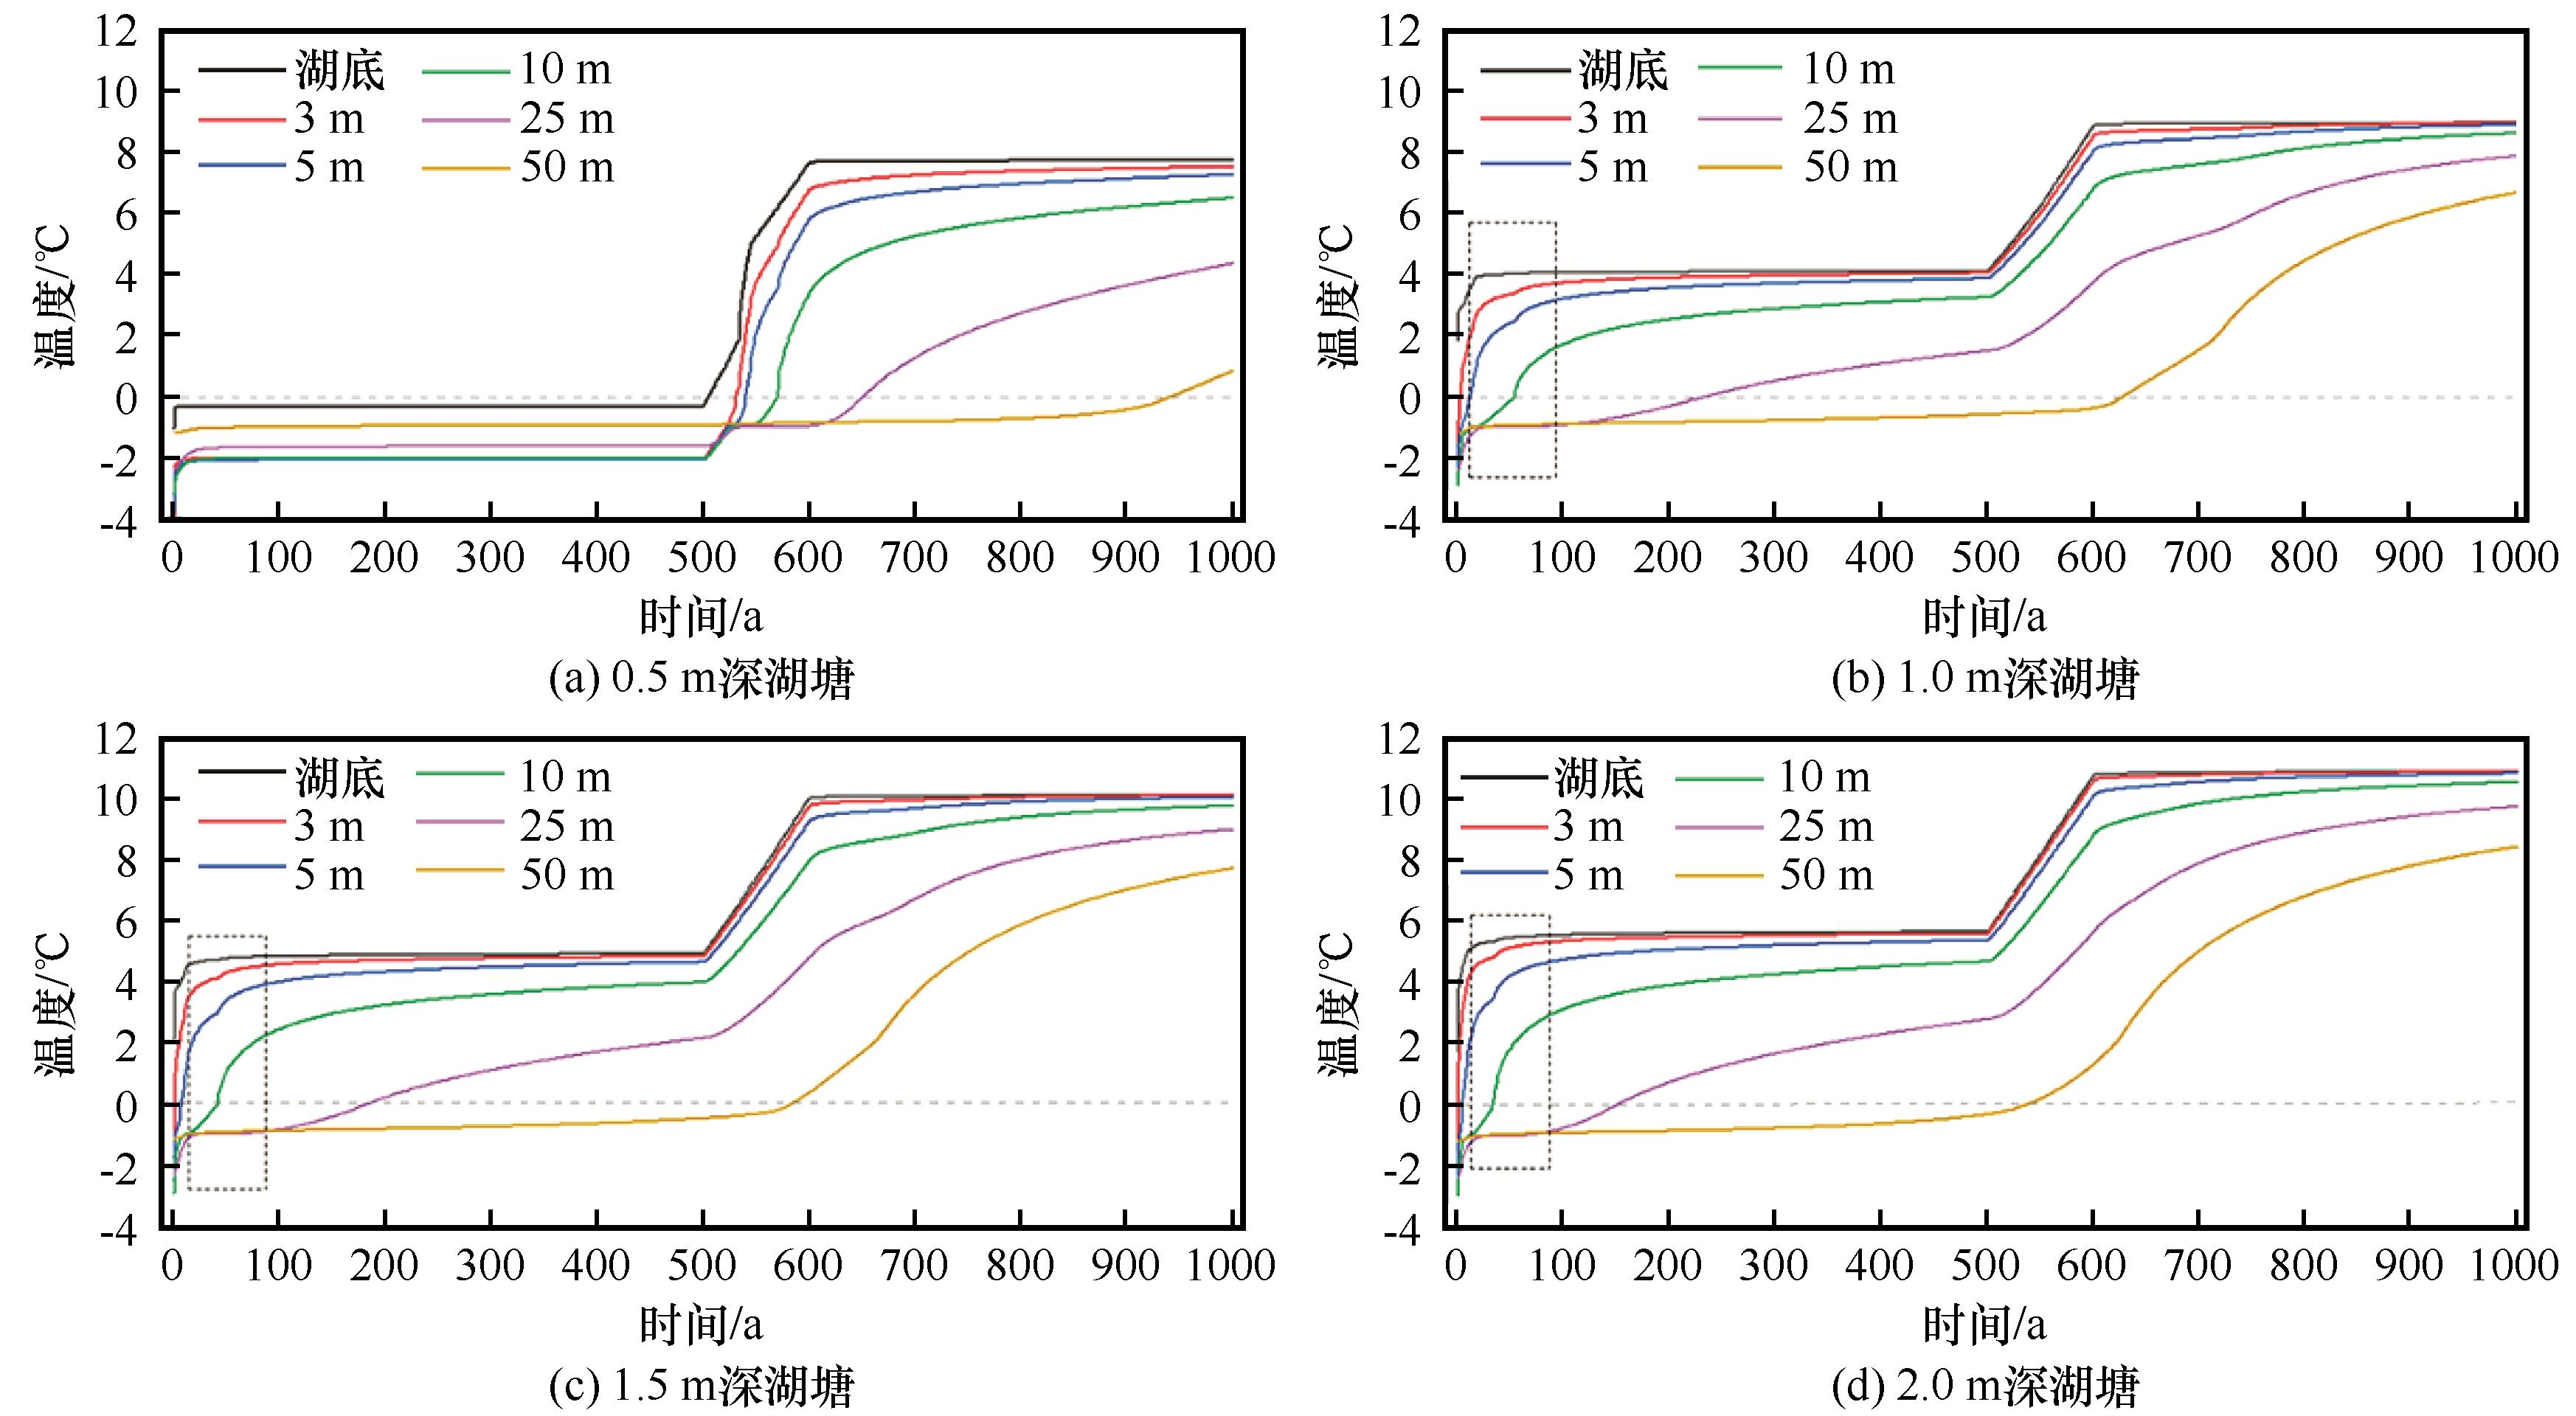
Fig. 8
Variation of annual mean ground temperatures during simulation period for the lake: 0.5 m deep (a), 1.0 m deep (b), 1.5 m deep (c) and 2.0 m deep (d)