

Glacier area changes in Shigar basin between 1993 and 2016 were derived from Landsat data. Glacier mass changes were determined using geodetic methods based on digital elevation models(DEMs) derived from SRTM DEM (2000) and TanDEM-X DEM (2013). Results showed that Shigar basin has 25 surge-type glaciers(area changed by +1.30 km2), 68 advancing glaciers(area changed by +0.86 km2), 50 retreating glaciers(area changed by -3.48 km2), and 376 stable glaciers(area changed by -1.34 km2) from 1993 to 2016. The length and size of surge-type glaciers were concentrated in a large range, the size of advancing glaciers were larger than retreating glaciers which were mostly small size, while the four largest glaciers in basin remained stable. The spatial distribution of different glacier types were different, and the different combination of precipitation and temperature in different elevation made the states of glacier motion are diverse. Surge-type glaciers gained mass at a rate of (+0.17±0.03) m w.e.·a-1 during 2000 to 2013, while advancing glaciers lost mass at a rate of (-0.01±0.03) m w.e.·a-1, retreating glaciers lost mass at a rate of (-0.22±0.03) m w.e.·a-1 of and stable glaciers lost mass at a rate of (-0.01±0.03) m w.e.·a-1. Meanwhile, the elevation changes of surge-type, advancing, retreating, and stable glaciers in different altitudes and slopes and the trends of glacier elevation change along with the normalized glacier length show that surge-type glaciers had a big material accumulation; the material on upper part of the advancing glacier accumulated and moved downward to push the glacier terminal forward; the mass lost in the ablation area of retreating glaciers led to the glacier terminal receding.
A two consecutive years(2014—2016)of research had been conducted on the Large and Small Anglong Glaciers, located in the upper Shiquanhe River, Ngari Prefecture, Tibet Autonomous Region, including simultaneous observation of glacier surface mass balance by stake method and difference GPS, as well as glacier surface flow velocity, change of glacier terminal and ice thickness. The followings were revealed: 1) The results of difference GPS method and the surface mass balance by stake method had differ somewhat for the two glaciers during 2014—2106. The stake method showed that the Large and Small Anglong Glaciers reduced by 72 mm w.e.·a-1 and 219 mm w.e.·a-1, respectively, during 2014—2016. However, the difference GPS method showed that the two glaciers reduced by (442±90) mm w.e.·a-1 and (265±90) mm w.e.·a-1, respectively, at the same time period. 2) The surface flow velocities for the two glaciers were 4.4 m·a-1 and 2.3 m·a-1 in 2015/2016, respectively. 3) During 2014—2016 the Small Anglong Glacier had advanced 11 meters in the first year and then retreated 34 meters in the second year; 4) The volume of the Large Anglong Glacier was 0.452 km3 with an average ice thickness of 67.9 meters and a maximum measured thickness of 216 meters. The maximum thickness of the Small Anglong Glacier was 190 meters.
Glacier ablation can be described using energy-mass balance models. This paper conducts an energy budget experiment to quantify energy components in the Urumqi Glacier No.1, Tianshan Mountains. Based on the automatic weather station (4 025 m a.s.l.) observation data and mass balance field survey data by five individual ablation stakes on the east branch of the glacier, the single-point energy-mass balance was simulated by “COupled Snowpack and Ice surface energy and MAss balance model” (COSIMA) during the ablation season in 2018. Results showed that the modelled accumulative mass balance was (-0.67±0.03) m w.e. during the study period, which agreed well with the in-situ observation. The correlation coefficient between both reached to 0.96. The main energy component causing the glacier ablation were net shortwave radiation (84%) and sensible heat flux (16%). The main energy expenditure were the net longwave radiation (55%), the heat flux for snow/ice ablation (32%), latent heat flux (7%) and ground heat flux (6%). Affected by energy budget, modelled accumulative mass balance mainly depended on surface melt and snowfall. Comparing with the other continental glaciers in China, it is found that mass loss of the Urumqi Glacier No.1 was more significant and that energy fluxes mainly depends on altitude and climatic conditions. In addition, the refreezing and snowfall on the Urumqi Glacier No.1 were significantly less than that on the Qiangtang No.1 Glacier and Zhadang Glacier, probably due to the atmospheric circulation over the single glacier. These findings will enhance our understanding of the mechanisms of glacier changes.
In the context of global warming, an in-depth understanding of the variation trend of marine type glaciers in the southeast of the Tibetan Plateau and their response to climate change is of great significance for understanding the response mode of different types of glaciers to climate change. Based on the remote sensing images of Landsat series and digital elevation data, this paper extracted the glacial periphery of the Que’er Mountains in the southeast of the Tibetan Plateau from 1987 to 2016, and analyzed its change process and characteristics. The results showed that from 1987 to 2016, the glacierized area in the Que’er Mountains continued to decrease, and the average annual rate of change was (-1.69±0.87)%·a-1, which was one of the maximum in many mountain systems in the Tibetan Plateau. The glacier ablation in the study area mainly occurred on the small glaciers less than 1 km2 and the glacier ablation zone below 5 200 m a.s.l., among which the glacier retreat rate in the southwest direction was the largest. The meteorological data analysis shows that from 1987 to 2016, the average temperature in summer in the Que’er Mountains had increased by 1.58 ℃ on the whole, with the mean air temperature rise rate of 0.33 ℃?(10a)-1. Since the average temperature in summer was significantly correlated with the glacier change process, but the annual precipitation in the same period did not change significantly, it was speculated that the rise of the average temperature in summer was the main reason for the rapid retreat of glaciers in the Que’er Mountains. In addition, this paper also found that compared with extracting glacier information based on spectral features only, the classification accuracy of remote sensing glacier classification based on terrain shadow simulation data can be improved to a certain extent.
Glacier length is an important geometric parameter of glacier, which is valuable for understanding the characteristics of glacier change and simulating glaciers’ thickness. Based on the first and second glacier inventory of China and Landsat OLI images, the vectorized datasets of glacier length in 1970, 2010 and 2016 in the Altun Mountains were extracted by using the streamline method of glacier, and the response of glacier length to climate change was analyzed in combination with meteorological data. The results showed that: There were 507 glaciers in the Altun Mountains in 2016, with an area of 272.95 km2 and an average length of 1.02 km; glaciers with a length of 2~5 km and 0.2~1 km constituted the main body of the area and number of glaciers in the mountain system. From 1970 to 2016, the area and average length of glaciers in the Altun Mountains had decreased by 53.07 km2 (with changing rate of -1.15 km2·a-1) and 0.26 km (with changing rate of -5.65 m·a-1), respectively; the relative changing rate of glacier length in west had been significantly faster than that in east; the retreat rate of the glacier from 2010 to 2016 had been significantly faster than that from 1970 to 2010, mainly due to the rise of temperature. Glacier length had a good correlation with glacier area and glacier circumference, and there was a good positive correlation of the change in glacier length with the change in glacier ablation area and the elevation rise of the terminus; in other words, the more the glacier ablation area shrinks, the more the elevation of the terminus rises.
Based on the daily observations of snow cover at 89 meteorological stations in Xinjiang from 1961 to 2017, the spatial-temporal characteristics of initial snow cover date, final snow cover date and snow cover duration in Xinjiang were studied. The periodicity and inter-decadal variations of snow cover, and their relationship with temperature and precipitation in northern Xinjiang and the Tianshan Mountains were also studied. The results showed that: There were distinct differences in initial snow cover date, final snow cover date and snow cover duration over Xinjiang. The snow cover duration on the north slopes of the Tianshan Mountains was longer than that on the south slope. In terms of spatial distribution, Tianshan Mountain, Altay, Tacheng and Ili River valley had abundant snow cover and a relatively long snow cover duration. In the past 57 years, the snow cover duration had showed a decreasing trend in 78% of meteorological stations in northern Xinjiang and the Tianshan Mountains, with a pronounced reduction in the middle Tianshan Mountains, Tacheng region and the eastern Altay. The initial date of snow cover delayed around 67% of meteorological stations, while the final date of snow cover had showed no significant change. The oscillation of snow cover duration in northern Xinjiang and the Tianshan Mountains had exhibited a 2~3 years short period and a 14~15 years long period; the initial date of snow cover in northern Xinjiang and the Tianshan Mountains had been dominated by 12 years and 15 years long-period oscillations, respectively, with a consistent 3~5 years short period oscillation occurring in different time. The final date of snow cover had not showed explicit periodicity. The influence of air temperature on the snow cover duration had been more significant than that of precipitation in northern Xinjiang and the Tianshan Mountains; the initial and final date of snow cover were remarkably correlated with the seasonal mean air temperature.
Using remote sensing data to monitor the phenological characteristics of lake ice has become the main technical means. NPP-VIIRS is a relative new satellite data, which has the advantages of high spatial resolution, more band number and short revisit period. Using these data to extract lake ice information is a useful supplement to this field. Based on the NPP-VIIRS data, in this paper, the threshold method is used to extract lake ice information from typical lakes, such as La’ang Co, Mapamyum Co, Paiku Co, and Pumayum Co. The daily frozen percentages on the four lakes has been obtained, and the frozen and melted characteristics of the four lakes were analyzed. The results show that use of NPP-VIIRS can better extract the information of lake ice; the freezing and melting process of lake ice in this area has affected by wind direction and water flow. Temperature (annual negative accumulated temperature) is the main factor affecting the lake ice area in the region. The freezing and thawing process is mainly affected by wind direction and injection runoff, and geothermal resources are also one of the influence factors.
To study the chemical composition, optical characteristics and sources of atmospheric aerosols on the north slopes of the Himalayas (the south edge of the Tibetan Plateau), 22 samples were collected daily from November 2017 to December 2017 at Qomolangma Station for Atmospheric and Environmental Observation and Research (QOMS, 28.36° N, 86.95° E, 4 276 m a.s.l.). The total mass concentrations of identified species (WSIs+OM+EC) were (3.36±1.06) μg?m-3. The average concentrations of organic carbon (OC), elemental carbon (EC) and water-soluble organic carbon were (1.10±0.38) μg?m-3, (0.13±0.12) μg?m-3 and (0.84±0.24) μg?m-3, respectively, lower than that in pre-monsoon. The carbonaceous matter (OM+EC) was the dominated contributor, accounting for 73.6%, which was similar to the previous research. Absorption coefficient at 365 nm (Abs365) of PM2.5 water-soluble components, typically used as a proxy for water-soluble brown carbon (WS-BrC), correlated well with the WSOC and K+ concentration (R2=0.63, 0.50), but weak correlation with EC (R2=0.01), indicates that they probably originated from biomass burning and secondary formations. The values of AAE and MAE of the water extract of PM2.5 were (4.60±1.47), (0.45±0.13) m2?g-1, respectively. Moreover, the fire spots observed by MODIS and backward air-mass trajectories further demonstrated that in winter, fires in Nepal were most likely sources of carbonaceous aerosol at QOMS. Meanwhile, the unique local wind field on the Himalayas was an important channel for air-pollutant transport.
Black carbon is currently the maximum anthropocentric radiation forcing factor other than greenhouse gases. The three polar regions (Arctic,Antarctic,and Qinghai-Tibet Plateau) are the areas possessing most abundant snow and ice in the world. The black carbon deposited in the snow and ice can reflect the historical changes of anthropocentric activities and may cause the reduction of Alberto and then affect the matter and energy balance. This paper reviews the analysis method,spatial distribution,temporal variation and radiation forcing of black carbon in snow and ice in the three polar regions. Due to different geographical locations and environmental conditions,the spatial and temporal distribution of black carbon in snow and ice in the three polar regions and its radiation forcing are with great regional differences. Among them,the Qinghai-Tibet Plateau is the region most affected by the black carbon deposition and radiation forcing,which has most serious effect on water resources and ecological security potentially. Long time records of black carbon deposition preserved in snow and ice in the three polar regions are ideal medium for studying natural variability and influence of anthropocentric activities on the history of black carbon deposition (such as the rapid rise of black carbon concentration recorded in the ice cores of the Arctic and the Tibetan Plateau since the industrial revolution),and also provides data for modelling the future change. The three polar regions are indicators and amplifiers of global change,and in the background of increasing global warming,black carbon will play a more important role in the climate evolution in the three polar regions in future.
Climate warming is amplified in the Arctic and accompanied by sea ice decline,which makes it possible for resource exploration and opening new sea channels. The importance of the Arctic region is becoming increasingly prominent. With the aim to understand the most influential research forces and fields in Arctic research,to provide the most comprehensive analysis of scientific research information,and to reveal the existing problems in Chinese current research,408 ESI top papers on Arctic research in the last decade were analyzed,including number of papers,authors,research institutions,countries and research areas. It is found that the United States dominates the Arctic research (number of papers,authors,institutions,funding funds).The Arctic research fields include sea ice and oceans,organisms and typical ecosystems (adaptation and protection of biodiversity,boreal forests,tundra,microorganisms),glacier retreat and permafrost degradation,atmosphere,weather and climate system and other related fields. A great number of studies characterized by using large data and model operation,but “uncertainty” is common in all the fields. China conducts Arctic research in a cooperative,participatory,periphery-related and micro-entry manner. There are multiple constraints for China to conduct Arctic research. China may take advantage of the existing achievements in cryosphere research,actively participate in all fields of arctic research and data sharing,and focus on the impact of Arctic climate on mid-latitude regions to provide support in hazards prevention and mitigation,and thus improve ecological environment in China as well.
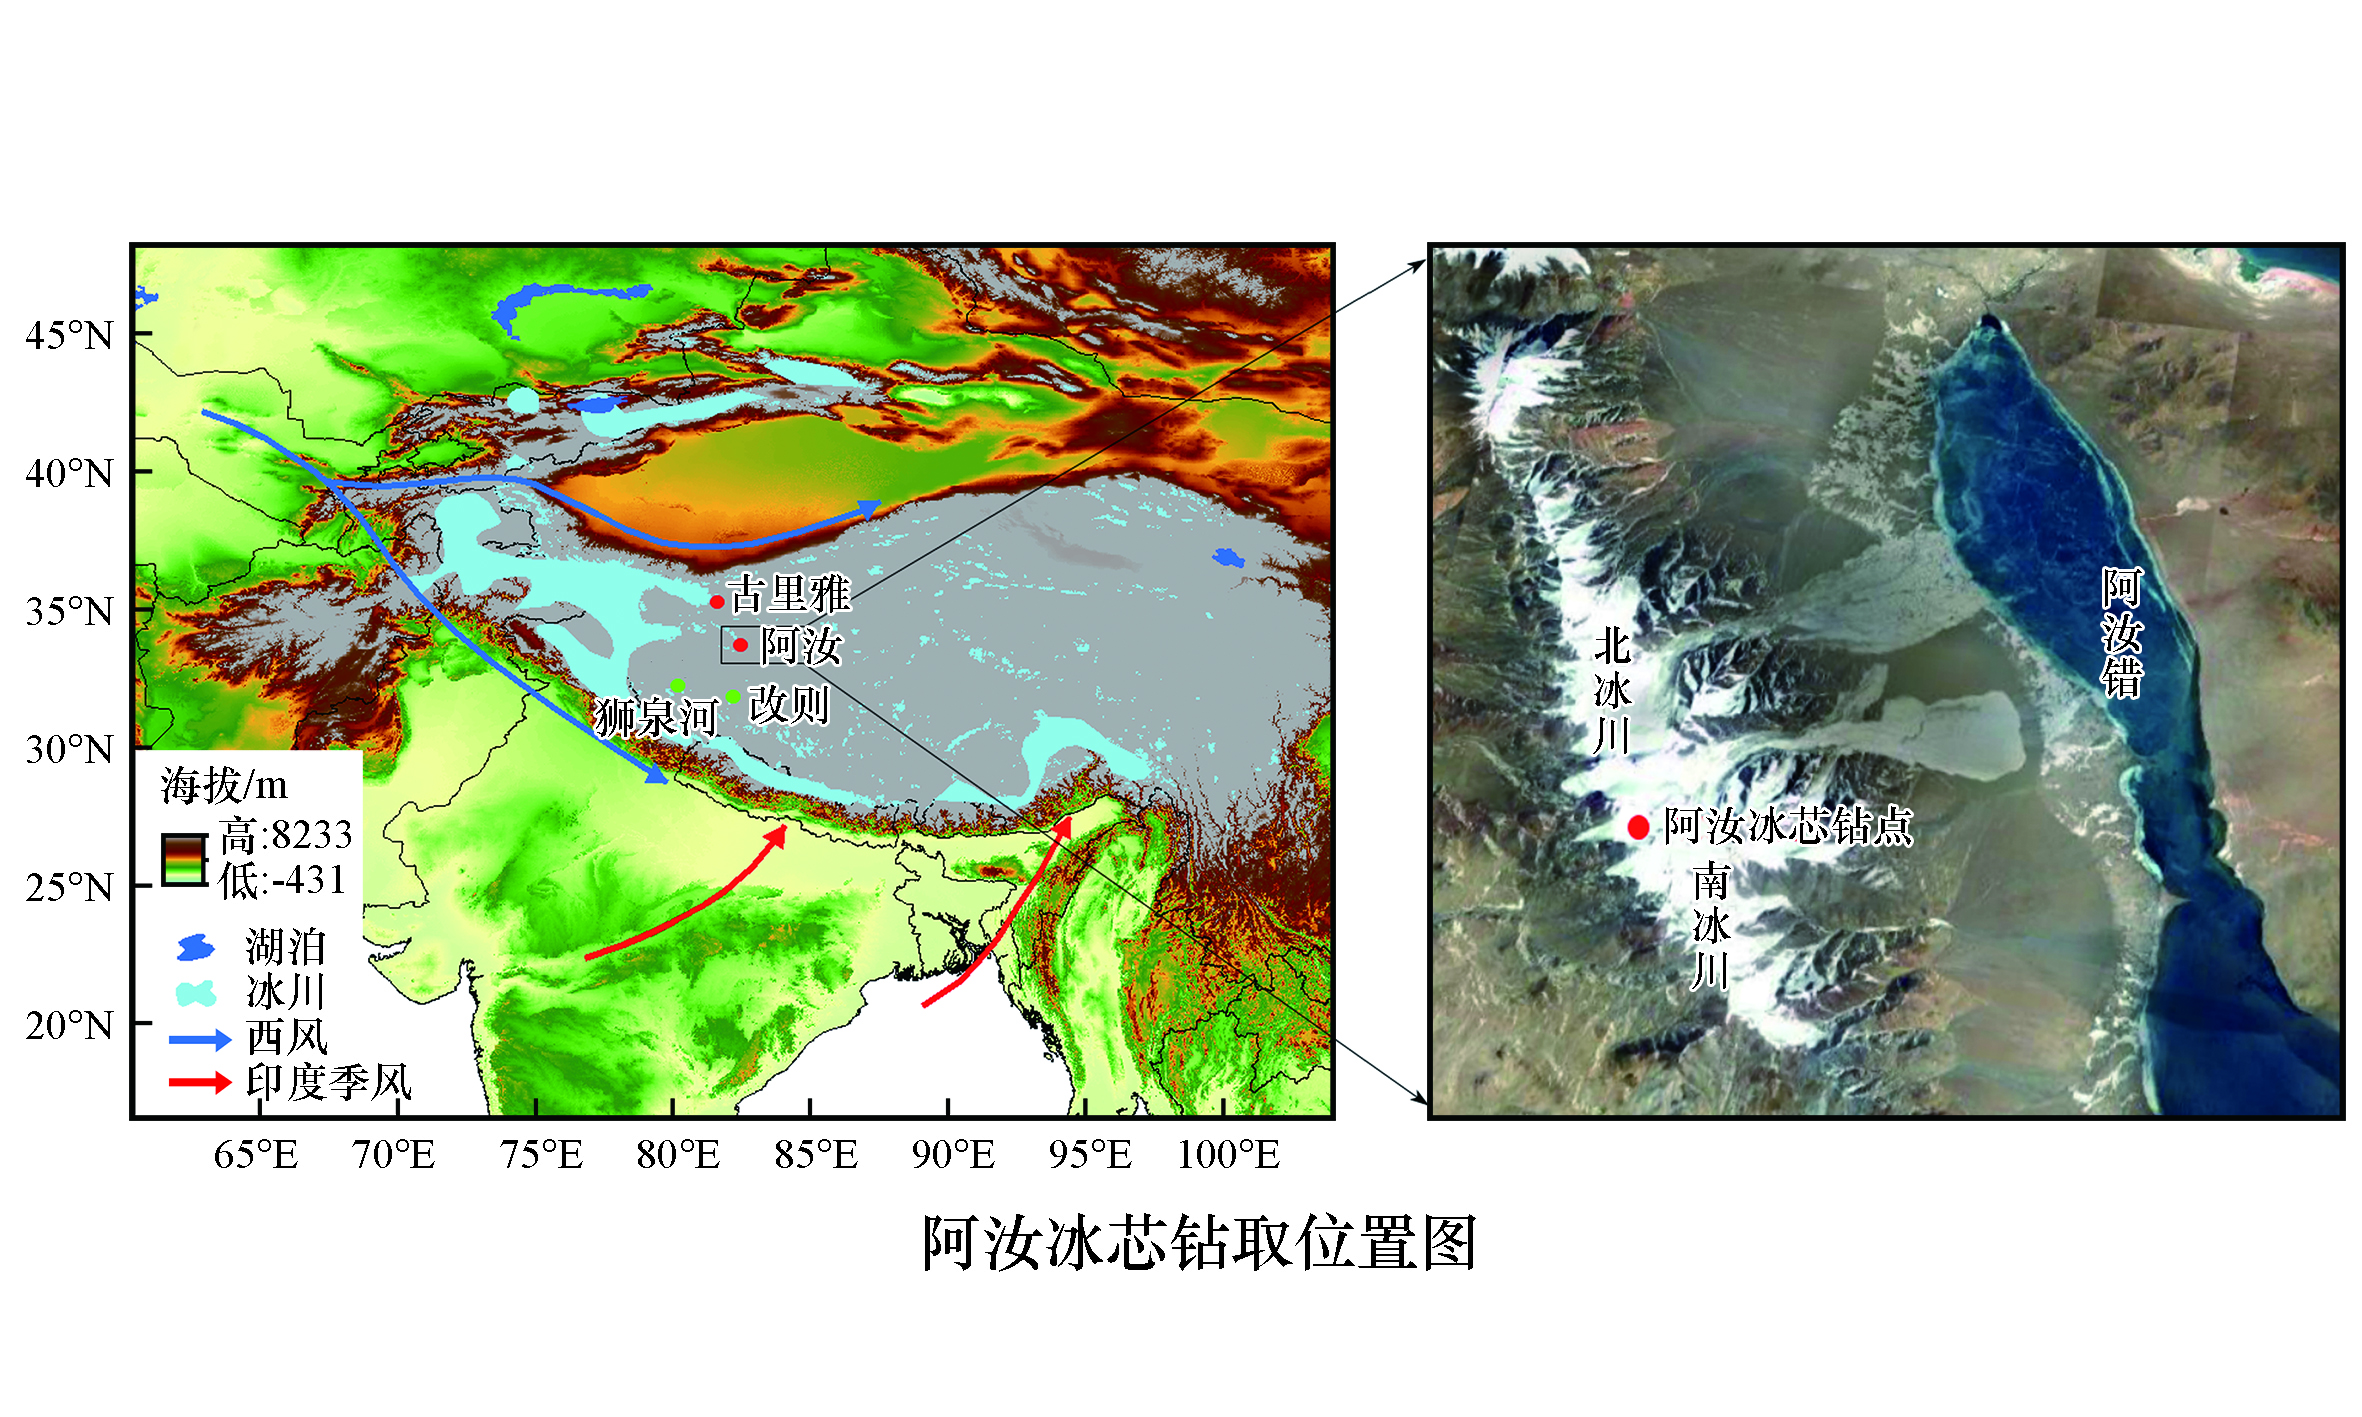
The 55.29 m long Aru ice core,drilled from the Aru glacial collapse area in the western Qinghai-Tibet Plateau in September 2017,was researched,the time series of upper 17.87 m ice core was reconstructed from 1917 to 2016 by δ18O and the Nye model. Combining with the mean summer temperature data of adjacent Gaize and Shiquanhe stations during 1973—2016,based on correlation analysis,linear regression method,and Mann-Kendall (M-K) test analysis,found that the temperature of the ice core and the meteorological stations recorded a significant rise in the past 44 years. According to the M-K mutation test,the 1980s was a transition period in which the temperature changes from high to low to high,and the abrupt year recorded by the Aru ice core increased by about 1.97 ℃ around 1981. Similarly,using the linear regression method and M-K test to analyze the temperature changes jointly recorded by the Aru and the neighboring Guliya ice core from 1917 to 1991,it displayed an overall upward trend by the two ice cores. In the M-K mutation test,the temperature rise started in the middle and late 1930s,reached a significant temperature increase trend in the 1950s,and the temperature recorded by the Aru ice core increased by about 1.1 ℃ around 1949 during the mutation period. The Aru ice core has a consistent rising trend with the temperature changes recorded by the meteorological stations and the Guliya ice core,but the temperature increase recorded by the Aru ice core is higher than meteorological stations and lower than Guliya ice core.
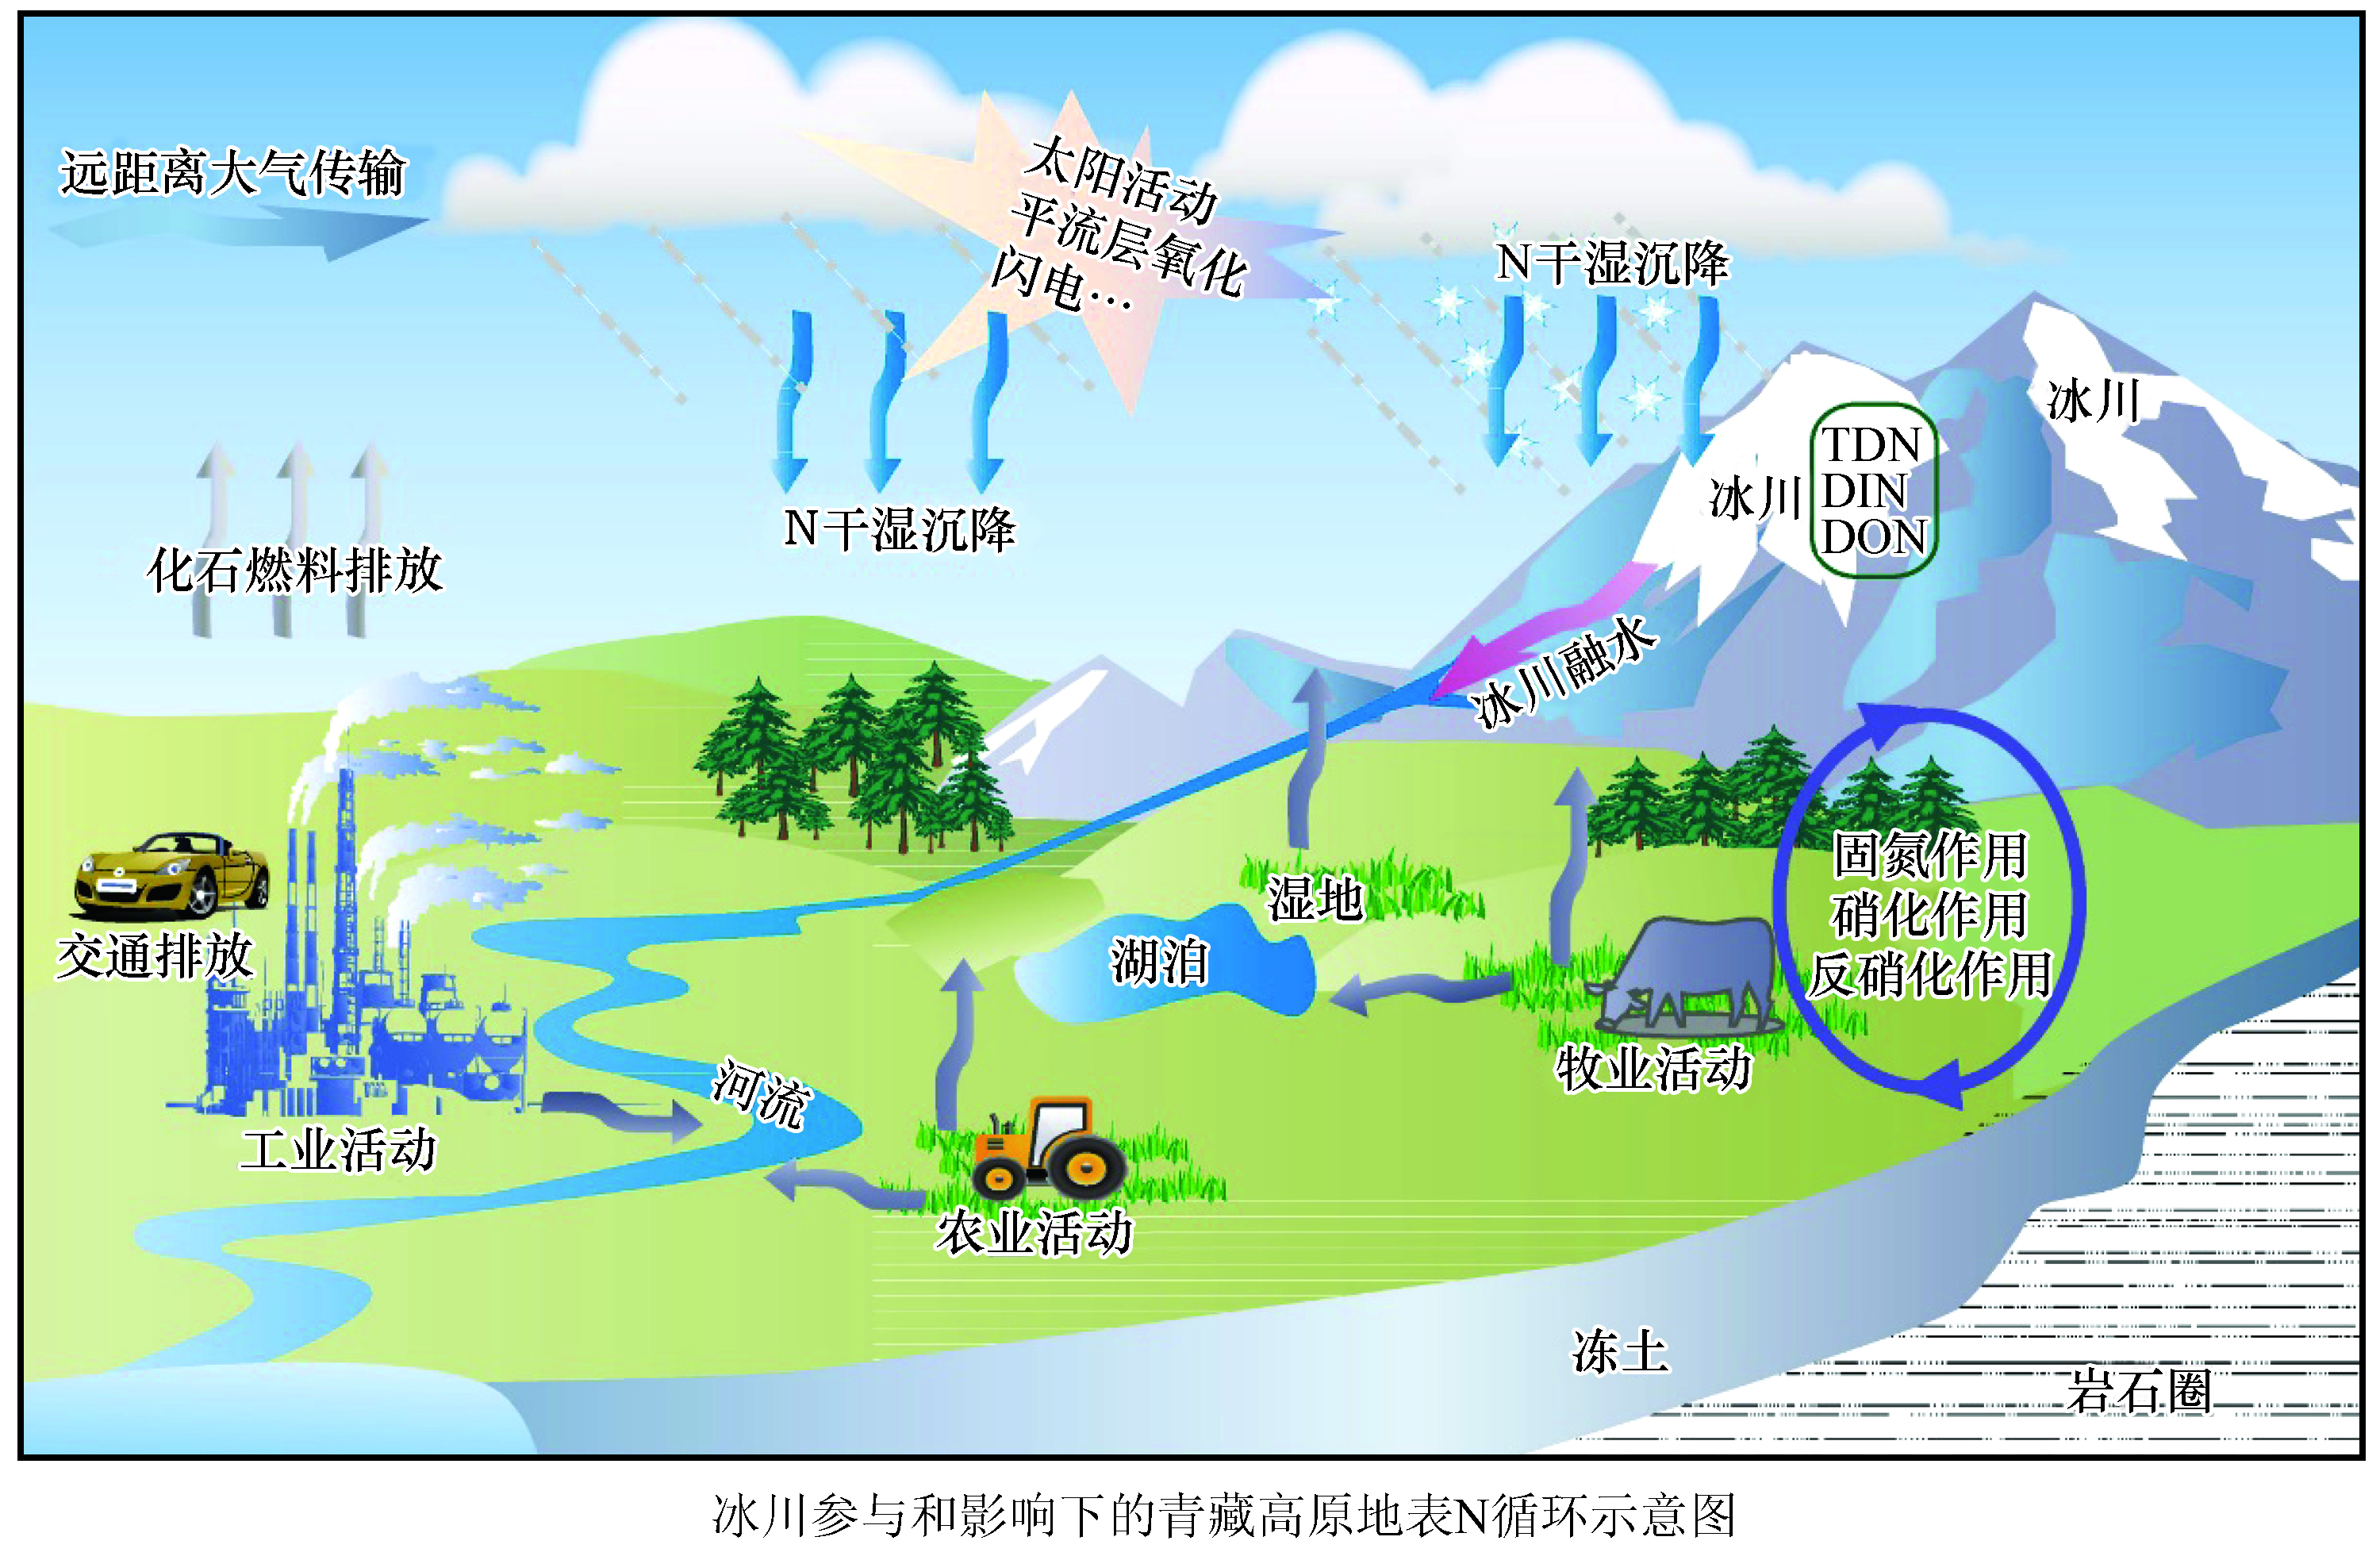
The glaciers in the Tibetan Plateau has been experiencing rapid retreat during recent decades, which may significantly influence the regional climate change and biogeochemical cycles. As an important nutrient matter, the role of nitrogen in the ecosystems has caused many attentions. The migration and transformation of nitrogen components from glaciers are the important linkage of nitrogen cycle in cryospheric regions. Based on the glacier nitrogen (including total dissolved nitrogen, NO3-, NH4+) studies in the Tibetan Plateau, this paper synthesized the different trends of historical nitrogen variations from ice cores in different regions, which indicated the potential impact of anthropogenic emissions from Asia. We also illustrated the spatial distribution features of dissolved inorganic nitrogen from glaciers, which showed high level in the northern Tibetan Plateau, and vice versa. Based on the collected data of glacier mass balance, we estimated the export of nitrogen from Tibetan glaciers under climate change. The results revealed that the annual average dissolved inorganic nitrogen can reach to about 4 700 t?a-1. Upon to the present studies and understandings, we also provided the perspectives on further research on glacial nitrogen. In future, studies on the dissolved organic nitrogen and nitrogen isotopes should be strengthened. The transport and transform of nitrogen from the glacier melt and their impact on the nitrogen cycle in the cryospheric regions of the Tibetan Plateau should also be focused.
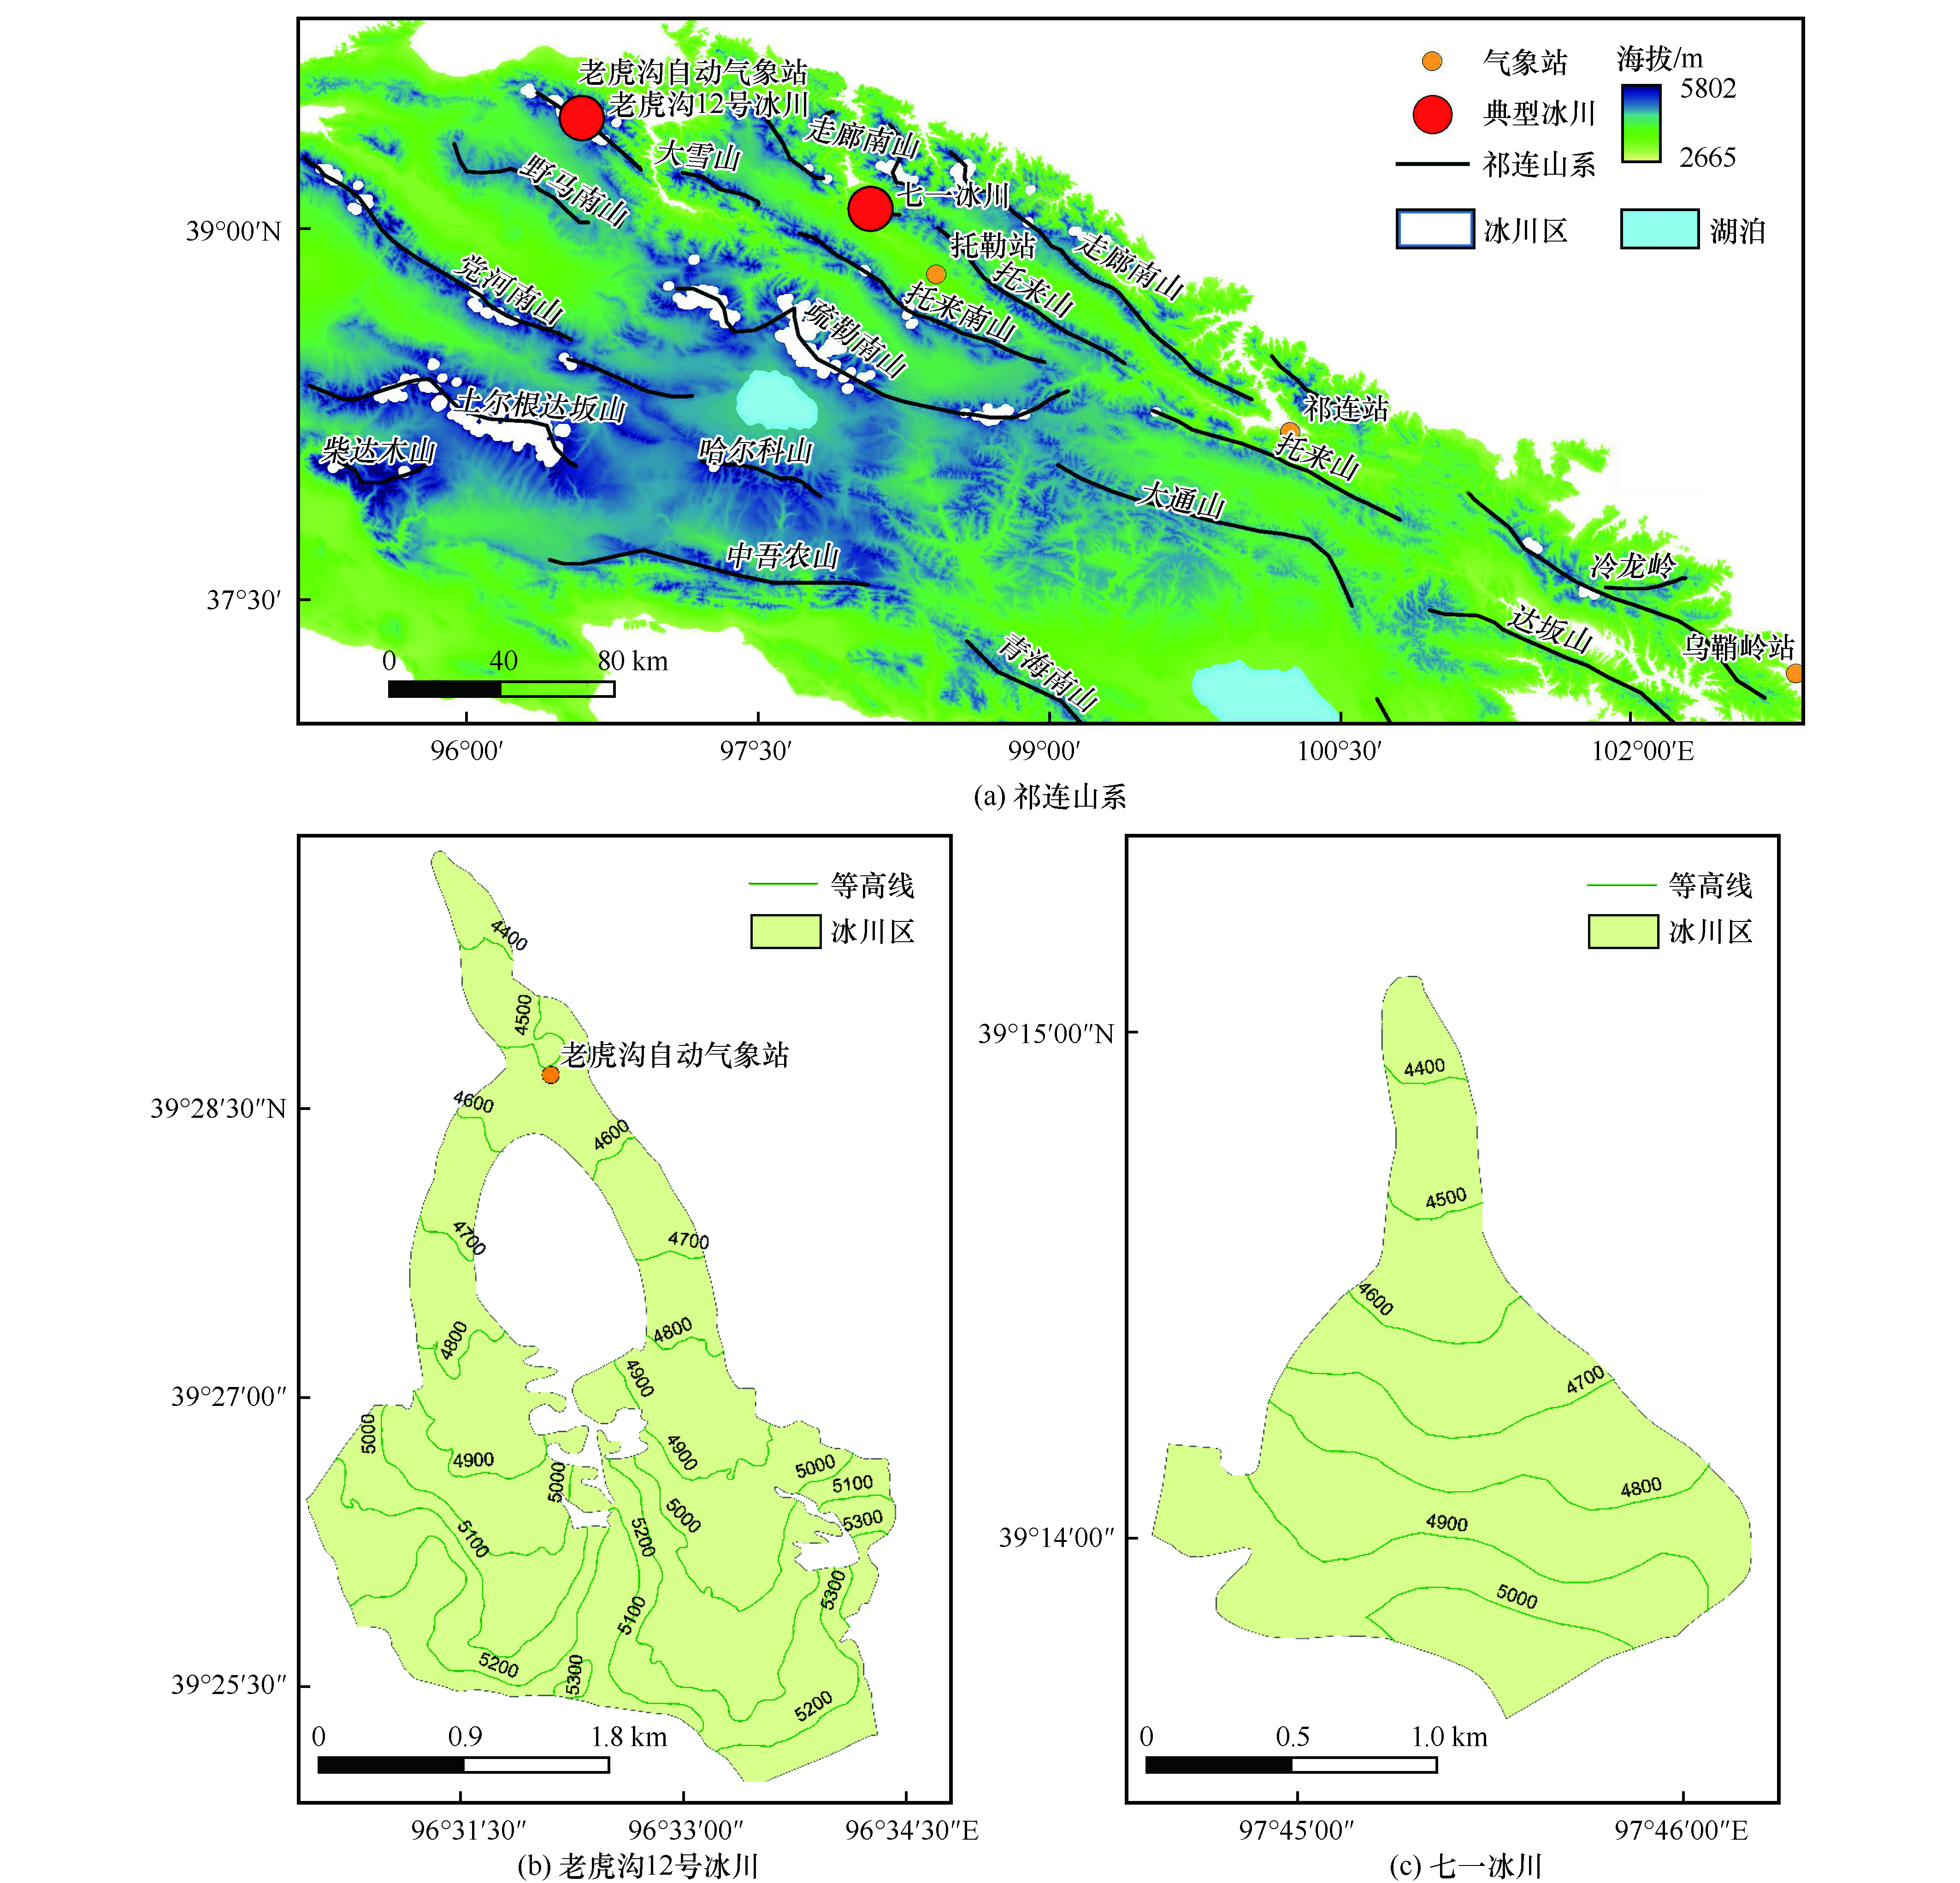
Snow/ice albedo can affect the glacier surface energy budget, making it an important factor to impact glacier melt. Based on vector data of glacierized areas, MODIS daily snow albedo, air temperature and precipitation, and glacier mass balance in the Qilian Mountains, this study addressed the spatial-temporal characteristics of snow/ice albedo, and the relationship between glacier mass balance and snow/ice albedos. The results indicated an average albedo in the study area was 0.532. A positive correlation existed between glacierized area and annual averaged albedo, namely the glacierized area decreased by 1 km2 will cause a reduction of albedo by 0.0025. For the typical glaciers of Laohugou Glacier No.12 and Qiyi Glacier, average albedo during summer (June to August) was significantly positive correlated with annual glacier mass balance, coefficient of determination reaching 0.48 (P<0.05) and 0.66 (P<0.05), respectively. Such result indicated that variation of albedo played a great impact on smaller glaciers, which will further enhance the retreat of smaller glaciers. The average albedo during summer can be considered as an effective proxy for changes of glacier mass balance.
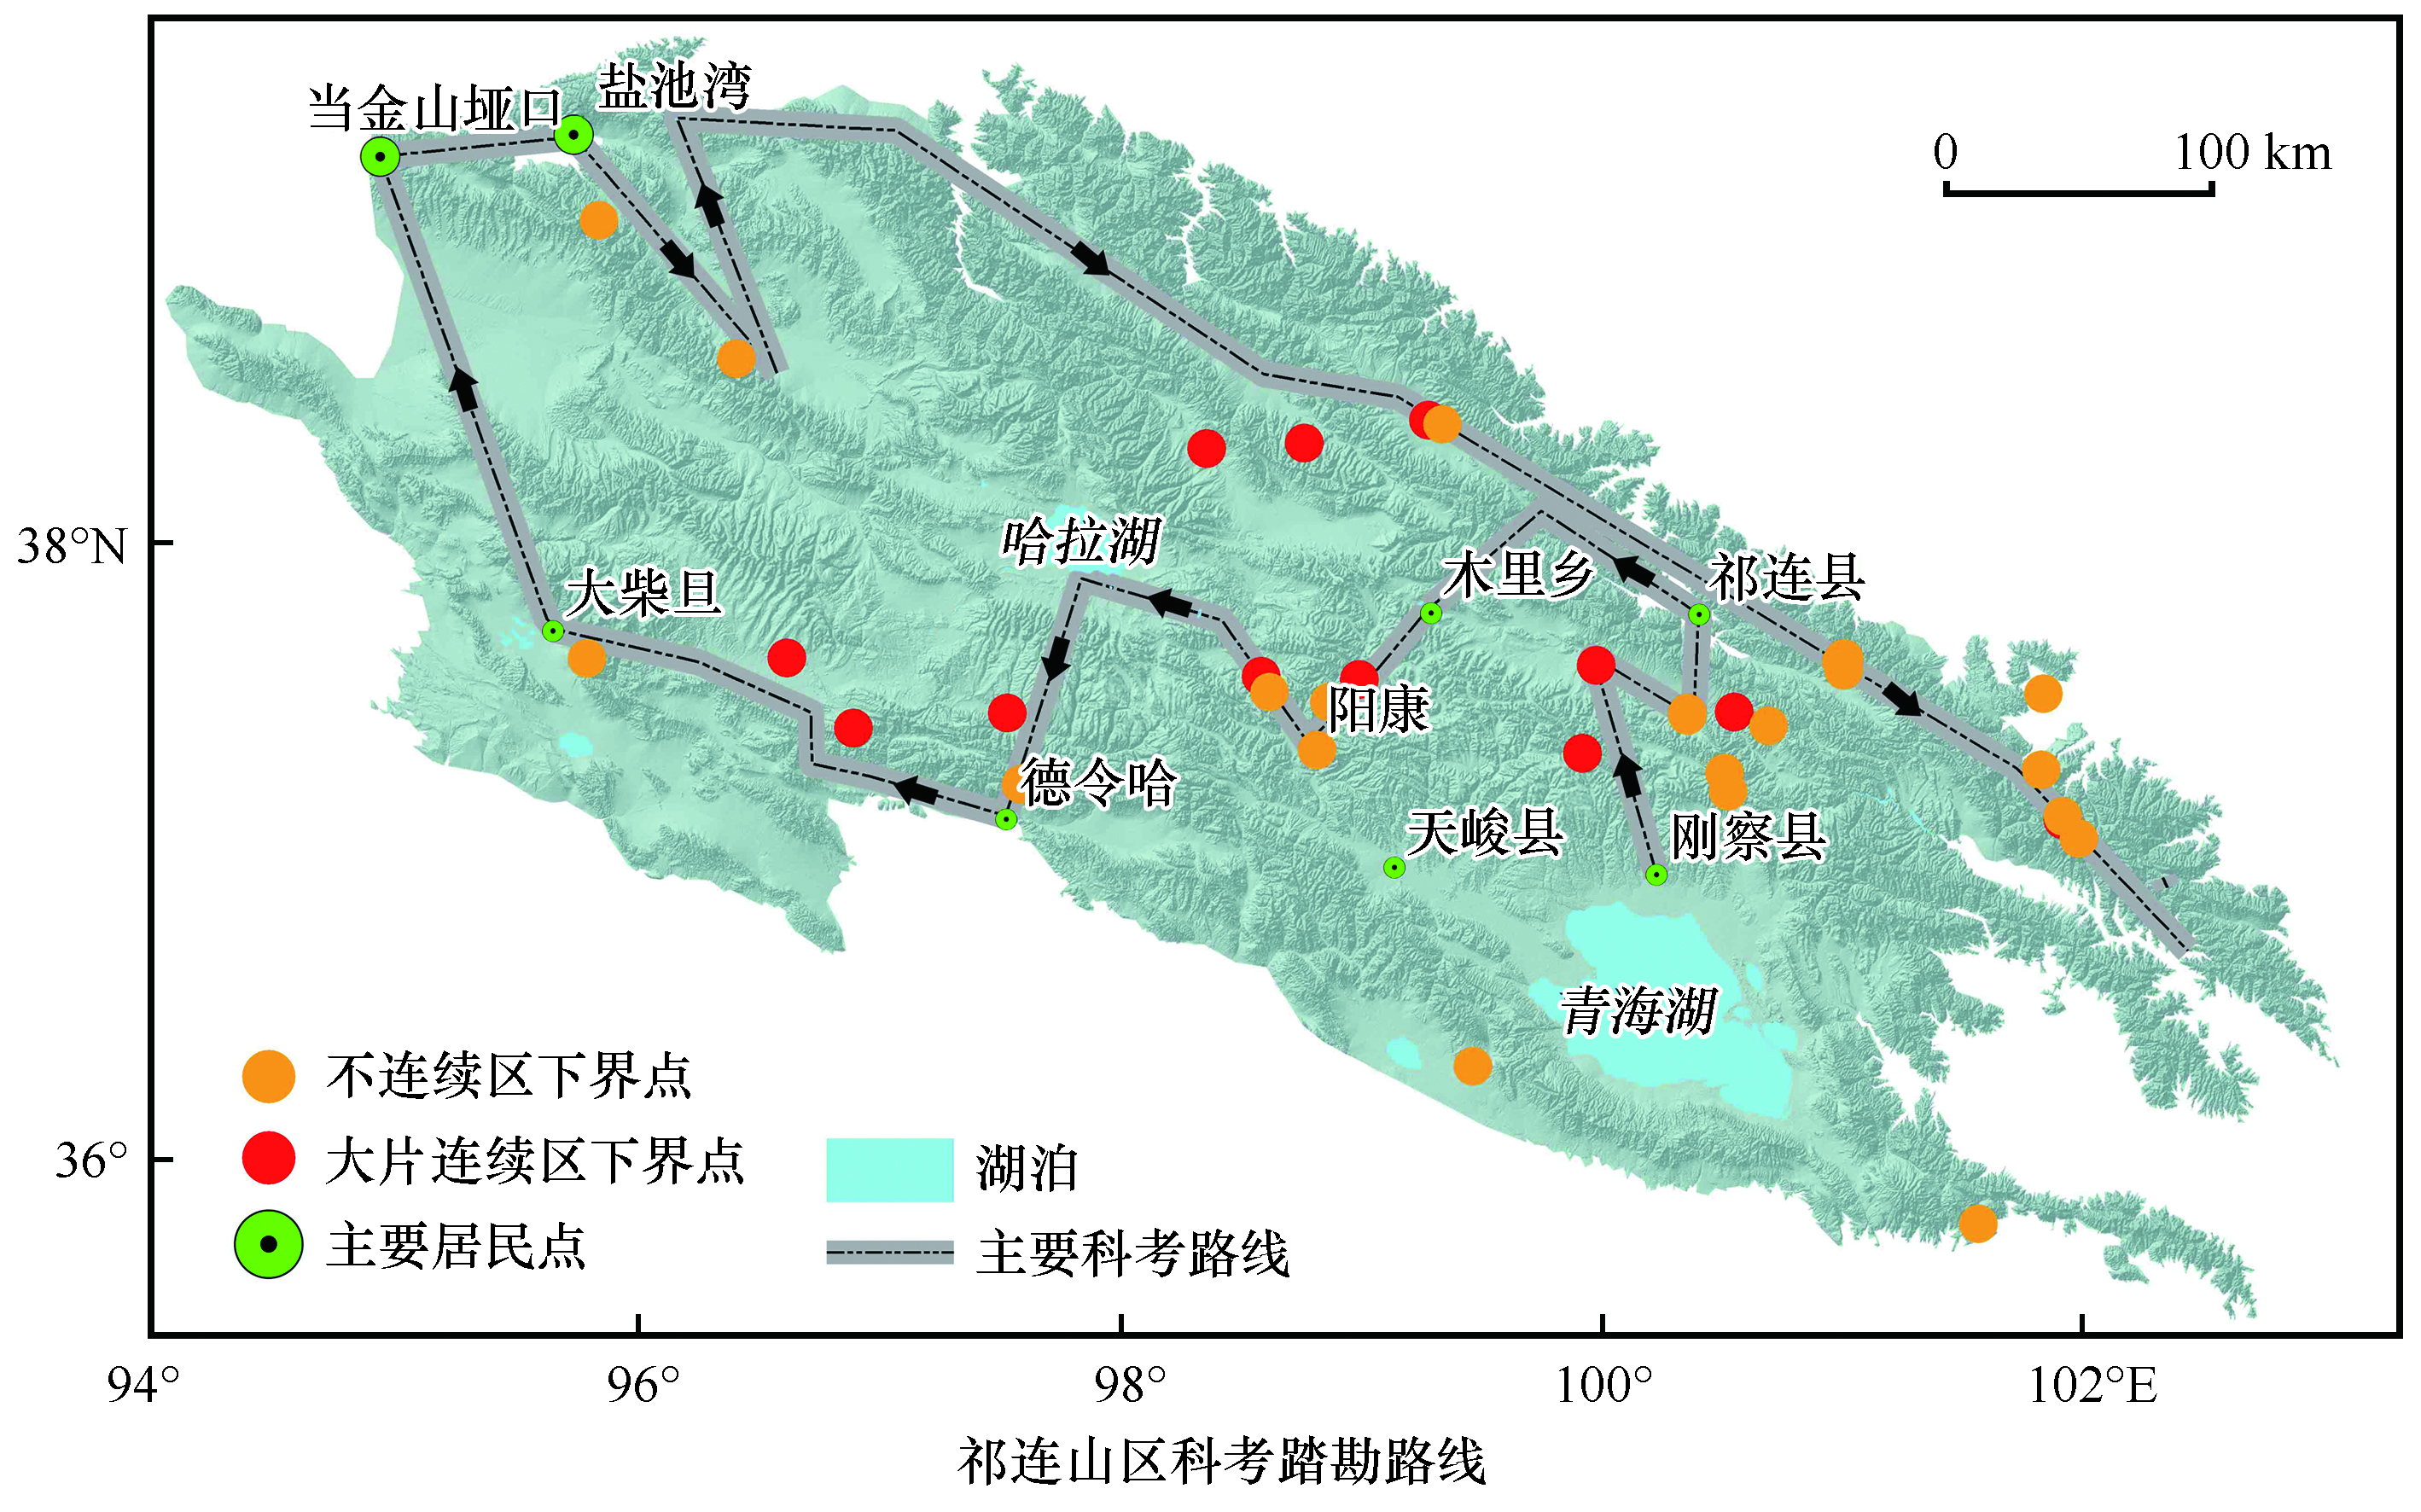
The Qilian Mountains,located on the northeast edge of the Qinghai-Tibet Plateau,is an important part of the Asian water tower. Changing in permafrost can exert great impacts on the ecosystem and regional water balance. Based on the data from the Second Tibetan Plateau Scientific Expedition and Research and the borehole data of road survey along the elevation of lower limit of permafrost,we employed the statistical model of the permafrost elevation using statistical regression. The spatial distribution map of permafrost in the Qilian Mountains was worked out by using the ArcGIS platform and DEM data. The results show that the lower limit elevation of permafrost in the Qilian Mountains has significant zonality,with the lower limit decreases with latitude or longitude. The permafrost in the Qilian Mountains shows a distribution pattern centered at Hala Lake. The total area of the Qilian Mountains is about 16.90×10⁴ km2,of which the permafrost area is about 8.03×10⁴ km2,accounting for about 47.51%. There is a transition zone of island permafrost between the permafrost area and the seasonal frozen soil area,covering an area of about 1.43×10⁴ km2,accounting for 8.46% of the total area.
Zhu Xun, a Chinese geologist, former minister of geology and mineral resources and secretary-general of the eighth committee of the Chinese People’s Political Consultative Conference (CPPCC), first put forward the concept of "stepwise development" as a prospecting law in his book Introduction to Prospecting Philosophy in 1992. He believed that the mineral exploration process, from the general survey, detailed survey to exploration, is the three steps of discovering minerals, evaluating minerals and exploring minerals. He believes that the mineral exploration process, from the general survey, detailed investigation to exploration, is the three steps of discovering, evaluating and exploring minerals, and the three are inseparable and interrelated, which is the objective law that must be followed in mineral prospecting. Stepwise development is a theory widely existing in the fields of nature, society and thought. After more than 20 years of research, stepwise development has become a philosophical category, a universal phenomenon and a universal law that all practical activities and cognitive activities must follow. In this paper, by combing the research process of the frozen soil study system and applying the step-development theory, the development process of geocryology study subsystem is decomposed, and the longitudinal and transverse comparative research is carried out, so as to put forward the prospect of the research method and discipline trend in the future.
The engineering geological mapping of permafrost is one of the basic contents of regional and historical studies of permafrost. The engineering geological mapping of permafrost is a quantitative description of the properties of permafrost under the influence of various natural, engineering, environmental factors at the particular time and space scale. The scientific problems solved by the engineering geological mapping of permafrost have been improved constantly from the distribution of permafrost to regularity and pattern and then to permafrost function. The content of mapping has developed from the study of basic elements, feature elements and functional elements of permafrost to constantly increase practicability. The method has gradually developed from basic geography and engineering geological method to system theory method. In a word, the engineering geological mapping of permafrost shows the periodicity on the time scale and steps on the space scale. The depth and extent of knowledge have increased. It provides basic data and technical support for the basic scientific research, engineering construction, resource and environment conservation in permafrost regions.
Thaw settlement is one of the key factors those could affect the construction and safety of projects in permafrost areas. Through experimental tests, thawing settlement tests of the frozen saturated soil samples with the initial temperature of -1 ℃ under unload, static and dynamic loads are carried out for two soil samples of Qinghai-Tibet silty clay with different initial dry densities at periodical temperature boundary conditions with sinusoidal fluctuations between -8 ℃ and 24 ℃. and the variation of temperature, vertical deformation and pore water pressure in soil samples under different loads are investigated. The results show that the temperature response processes in the soil samples vary significantly under different loads when the temperature boundary conditions are same, reflecting the effect of load on the thawing rate of frozen soil. The vertical deformation of the soil samples under unload shows a linear development trend, and the thaw settlement changes little during each freezing-thawing process. However, the vertical deformation of the soil samples tends to increase rapidly and then stabilize gradually under the static and dynamic loads, and the thaw settlement deformation mainly occurs in the first 3~4 freeze-thaw cycle process. At the end of the test, the final vertical deformation of the soil samples under the static and dynamic loads is greatly larger than that under the unload, and the final vertical deformation is larger when the initial dry density is smaller. The changing amplitude of pore water pressure in the soil samples under the dynamic load is significantly larger than that under the static load, and during the first three freeze-thaw cycles, the pore water pressure dissipation value under the dynamic load is larger than that under the static load, and then the difference in pore water pressure gradually decreases with increasing freeze-thaw cycles. The thaw settlement deformation of the soil samples is closely related to the temperature change, pore water pressure accumulation and dissipation process. The test results could provide a basis for the theoretical study of thaw consolidation under complex boundary conditions and the prediction of thaw settlement deformation of foundation soil in engineering practice.
Permafrost is a special soil that contains ice. The frost heave and thaw settlement of permafrost always occur under natural environment change and engineering disturbance, which threat the stability of the construction in the Qinghai-Tibet Plateau and affect the normal transportation of the Qinghai-Tibet Railway particularly. An embankment in Wudaoliang area is used as an example. Based on the simulated thermal-mechanical model of discrete element method, the temperature and deformation variation of the embankment are calculated. The results show that, compared with the finite element method, the discrete element method can not only simulate the heat transfer and bond action between particles, describe the macroscopic change by explaining the micro level, but also can reflect the heat-mechanics state of frozen soils; with additional time, the degradation of permafrost embankment will occur. In addition, the heat transfer between roadbed particles is complex, especially in 0 ℃ isotherm area and the slope toe of embankment. This study can provide new ideas for the research of permafrost engineering and better serve engineering in cold regions.
Based on freeze-thaw cycling conditions in seasonally frozen soil regions, a temperature shrinkage test of cement modified embankment soil with different cement mixing amount was carried out by using high-low temperature alternating test box and static strain gauges. The test results show that the temperature shrinkage strain of the cement modified soil changes in a screw-type, and the temperature shrinkage strain increases gradually with the increase of cement content. The initial temperature cycle has a great influence on the cement modified soil. After three temperature cycles, the temperature shrinkage strain characteristics of the cement modified soil is quite obvious with a stable changing tendency, and the physical and chemical reactions of the soil have also reached a screw-type stable level. However, the internal reaction mechanism of cement soil with 6% cement mixing amount after multiple cycles has low temperature sensitivity, different from other mixtures, and its temperature shrinkage strain and coefficient are relatively small. The 6% cement mixing amount studied in this paper can be used as the base or basement layer of roads in the seasonally frozen soil regions in northern Hebei Province, which would be useful for the application of cement soil in seasonally frozen soil regions.
In recent years, more and more attention has been paid given to water resources problem under the climate change, relating research has also shifted from water shortage, supply and demand balance to comprehensive research to adjust to sustainable development. Based on the input-output theory, the study of water resources analyze the mobility and sustainability of water resources from the perspective of system cycle, revealing the internal quantitative relationship between various elements in the water resources economic and social complex system, and put forward the value and methodology of water resources for sustainable development. This paper firstly reviewed research on water resources based on the input-output theory from domestic and foreign research from the two main lines of model expansion and practical application. In terms of model, the development and applicability of input-occupancy output model, water resource input-output model and inter-regional input-output model are summarized, meanwhile compared and analyzed the advantages and disadvantages of input-output models between different regions. In terms of application, aiming at the three hot topics of virtual water, water footprint and water resources optimal allocation reviewed through temporal and spatial scales and driving force respectively. It is pointed out that: the research of water resources based on input-output theory is basically based on the value model. Inter-regional input-output model has become an important tool for analyzing environmental problems such as interregional economic structure and resource flow. Secondly, the application of input-output model on cryospheric freshwater resources management was discussed. Finally, the paper prospects the application of input-output theory in water resources research, expected to provide additional information for policy makers to better manage water resources the application of input-output theory in water resources research is looked forward to provide additional information to decision makers in order to better manage.
Hydrological Simulation Program-Fortran (HSPF) model is developed based on the Stanford hydrological model. As an excellent representative of a semi-distributed hydrological and water quality model, the HSPF model can comprehensively simulate processes such as river hydraulics, watershed runoff, soil loss, and pollutant migration, and thus is widely used in watershed hydrology and water environment research. This article outlines the development process of model development and integration, as well as the three main module structures of PERLND, IMPLND, and RCHRES in the model. It also summarizes the various aspects of the model in land use change, hydrological processes, non-point source pollution simulation and model parameter verification. The research progress of the HSPF model found that: the HSPF model still has room for improvement and perfection of empirical formulas and hypothetical estimates; the in-depth analysis of parameters helps reduce the uncertainty of the simulation results; The HSPF model also has higher requirements for the accuracy and standardization of the collected data. Therefore, this article puts forward relevant suggestions on the improvement of the model from the aspects of empirical formula improvement, parameter uncertainty discussion and simulation accuracy improvement.
The forest-steppe zone in the Qilian Mountains is a typical semiarid mountain mosaic landscape of forest and grassland. The vegetation pattern within this zone is characterized by significant patchiness, which is closely related to micro topographic factors. An exploration to the relationships between topographic factors and soil and vegetation in the forest-steppe zone will enable us to take more efficient ecological protection and restoration measures. Based on field plots investigations and general linear model, we investigated the variation of soil properties and vegetation biomass with slope aspects (south-, southwest-, west- and north-facing slopes) and slope positions (summit, upper slope, middle slope, lower slope and valley), and their relationships with water and heat conditions. Results showed that soil organic carbon, total nitrogen, soil water content, above ground and underground biomass on the north-facing slope is 50.79 g·kg-1, 2.82 g·kg-1, 32.86%, 5.09 kg C·m-2, and 6.39 kg C·m-2, which were significantly larger than that on the south-facing slope by factors of 2.54, 3.97, 2.07, 24.62 and 149.30, respectively. Along the slope position gradient, soil organic carbon, total nitrogen, soil water content, above ground and underground biomass were maximal at the valley, reaching to 50.23 g·kg-1, 3.47 g·kg-1, 0.80 g·kg-1, and 32.01%, which were about 1.73, 1.69, 1.56, and 1.30 times higher than that on the summit, and were about 1.92, 2.85, 1.74, and 1.46 times higher than that on the sloping area. Regression analysis showed that soil water content was the dominant environmental control of the spatial patterns of soil organic carbon, soil total nitrogen content, and vegetation biomass, with the coefficient of determination varying from 0.74 to 0.93. The result suggested that soil water availability at different topographic positions should be given priority in terms of soil and vegetation protection and restoration in the forest-steppe zone of the Qilian Mountains.
Agricultural water consumption is the main disturbance factor due to human beings exploit and utilize water resources and affect the ecosystem. Scientifically quantifying agricultural water consumption is the basic work of rationally allocating and regulating regional water resources. However, the traditional statistical method of agricultural water consumption cannot reflect the actual water use dilemma in Xinjiang truly and objectively. Therefore, this study calculates the water consumption of nearly 20 crops in Xinjiang from 1988 to 2015, based on the water footprint theory. In addition, this paper analyzes the spatiotemporal variation of crop water footprint in Xinjiang by Mann-Kendall abrupt test, and discusses the driving factors and mechanisms of crop water footprint. The results show that the total amount of crop water footprint in Xinjiang increases by 257% over the 28 years, and increase trend changes abruptly around 2005, with the increase rate in the latter stage more than three times that of the previous stage. In terms of crop water footprint composition, the green water footprint of crops shows an increasing trend in recent 30 years, but its proportion in the total crop water footprint slightly decreases. Further, the rapid expansion of agricultural planting scale is the fundamental reason for the substantial increase of crop water footprint, and the policy or strategy support under the economic development needs of poverty alleviation and poverty alleviation is the core driver of sustained and rapid growth in agricultural planting (i.e. irrigated area). This paper explores the changes and reasons of crop water footprint, reveals the spatial and temporal changes of agricultural water use, as well as the relationship among crop water footprint, national and local policies, and social activities. The purposes of this paper are to analyze the spatial and temporal evolution relationship among agricultural growth, water resources utilization and ecology in Xinjiang. This study will be useful for related decision and policy making.
It is critical for understanding the relationships between glacier and climate change based on the palaeoclimate derived from glacial landform records. There are two approaches to reconstruct climate based on palaeoglacier. One is climatic reconstruction upon glacier equilibrium-line altitude (ELA) variation, and the other approach is climatic reconstruction based on glacier mass balance variation. With the difference between principle and required datasets of models, the applicability and accuracy of different models are variable. To improve the modeling accuracy, it is essential to apply a variety of models to reconstruct palaeoclimate based on the physical characteristics in the study area. Based on the previous palaeoclimate derived from glacial landform records in the Tibetan Plateau and adjacent mountains, the glaciations were driven by the drop of air temperature and the expansion of the extent of palaeoglaciers were also affected by the change in precipitation. Due to more abundant precipitation during mid-MIS 3 than Last Glacial Maximum (LGM), the extent of palaeoglacier during mid-MIS 3 was more extensive than that of LGM.
Periglacial phenomena are important for rebuilding the paleo-climate and -permafrost environments in the Late Quaternary. China is one of the countries with the most developed periglacial landforms during the late Quaternary and they are largely well preserved, among which the Ordos Plateau is one of the regions in northern China where periglacial phenomena have been extensively identified since 1980s. In order to accurately grasp the regional evolutionary history of periglacial and permafrost environments and their distributive features on the Ordos Plateau, the joint expedition from the Northwest Institute of Eco-Environment and Resources, Chinese Academy of Sciences and Free University Amsterdam, conducted several expeditions to the area. The one during May to June 2018 was focused on investigations for paleo-periglacial environments on the Ordos Plateau. The surveyed and investigated areas range from Jingbian County, Shaanxi Province to Chengchuan Town, Uxin Banner and Dongsheng District in the Ordos area of Inner Mongolia Autonomous Region, China, with an areal extent of about 12 000 km2. It has been found through investigations and summaries of the paleo-periglacial phenomena on the Ordos Plateau that there are two major types of periglacial phenomena, namely, cryoturbations and cryogenic wedges. Based on the analysis of the climatic conditions required for the development of the recently identified cryogenic wedges and cryoturbations, the environmental conditions for the occurrences of periglacial relics were preliminarily studied. The following conclusions were drawn thereupon: The periods with remarkably low temperatures and well-developed permafrost favored for the formation of various kinds of wedges, such as paleo ice-wedge groups, ice-wedge casts, large primary sand wedges, and large thermal contraction polygons. Moreover, the periods with warming climate and degrading permafrost (not yet completely thawed) were conducive to the formation of cryoturbations. The regional and collective occurrences of cryoturbations in groups generally reliably indicate the environmental conditions and the regional degradation of the upper layer of permafrost to a certain extent under a warming or warmer climate. Based on the field observations and Optically Stimulated Luminescence (OSL) dating results, combined with the characteristics of periglacial remains, we preliminarily reconstructed the chronosequence in permafrost environment on the Ordos Plateau since 50 ka BP: A tundra-like or cold desert environment prevailed on the Ordos Plateau during the Last Permafrost Maximum (LPM, 25-19 ka BP), with an extensive occurrence of cold and thick permafrost. Under the next generally warming climate, permafrost gradually degraded from continuous and discontinuous to island, sporadic and isolated patchy permafrost and eventually thawed in to seasonal frost on the Ordos Plateau, forming the present landscapes.
As the “three poles” of the Earth,the Antarctic,the Arctic and the Qinghai-Tibet Plateau are sensitive regions and research hotspots of global change. With the rapid development of the sky-ground integration ground observation technology,the three poles spatiotemporal information presents large-scale,high-efficiency,multi-dimensional big data features. However,due to the lack of effective visualization methods,these data are difficult for non-scientists to understand and recognize. How to quickly and intuitively display the latest data of space-time three poles for different groups of people has become a bottleneck of visual analysis. Based on the characteristics of three poles scientific data and results,this research designs a prototype system (called three poles sphere) based on an open source framework for the discovery of three poles scientific discoveries,focusing on some key technologies such as the distributed data storage,automatic data preprocessing,three-dimensional development engine,screen interoperation,automatic generation of analysis results. Meanwhile,the three typical scenarios are taken as examples to show the scientific discovery of the three poles vividly and intuitively.They are the amplification effect of the Arctic,the comparison and correlation between freezing/thaw of snow and ice the three poles and the impact of the three poles on the climate in East Asia. This system can help managers and the general public to understand the research results such as the changes in the ecological environment of the three poles and the impact on China’s weather and climate,and also have a demonstration role in the display of relevant information in the field of geosciences.
The near-surface soil freeze/thaw (F/T) cycle is characterized as a toggle switch for land surface process because of its strong influence on surface energy balance, hydrological processes, vegetation dynamics, greenhouse gas exchange, and ecosystem function. In addition to the traditional observation methods, passive microwave satellite remote sensing technology has been applied to the research of the near surface soil freeze/thaw status on a global scale. The development of detecting near-surface soil F/T status algorithm has experienced three stages: algorithm development, parameterization/validation, and F/T dataset establishment. Based on different algorithms, the near-surface soil F/T status datasets were developed in different regions during different periods. This study aims to compare the classification results of 3 near-surface soil F/T status datasets established based on single-index algorithm (SIA), double index algorithm (DIA) and the decision-tree algorithm (DTA). Soil temperatures at 0 cm depth (Tg) from 435 meteorological stations across China were used as a reference. Our preliminary results indicate that the SIA’s classification results show best agreement with ground observations. DTA underestimated the near-surface soil frozen status because of utilizing the unique 37 GHz threshold of vertically polarized brightness temperature throughout the whole classification process. Datasets and ground-based measurements of the near-surface soil F/T status show that due to the global warming, the onset of soil frozen for near-surface soil delayed, while the offset of soil frozen advanced. The actual number of frozen days had been decreasing in China. This study compared the different datasets of F/T, and provided a scientific basis for the future improvement and utilization of the satellite passive microwave remote sensing data.
Lake ice phenology is a sensitive factor of climate change,reflecting not only characteristics of regional climate change,but also interaction between regional climate and lake. In this study,long-term time series (1978—2017) of satellite passive microwave remote sensing data,MODIS data and ground-based measured lake ice data (1983—2017),air temperature precipitation/snowfall data (1961—2016) were used to analyze the phenology changes of Qinghai Lake ice and its climate control. Results showed that Qinghai Lake basin showed a significant warming trend (1961—2018) and temperature rises by 2.85 ℃. Under this climatic condition,Qinghai Lake ice on day was delayed (0.23 d·a-1),and initial melt day illustrated an obvious advanced trend (0.33 d·a-1),ice cover duration demonstrated significantly reduced trend,and reduction rate was 0.57 d·a-1. Meanwhile,lake ice thickness was reduced at a rate of 0.29 cm·a-1. In addition,the characteristics of freeze-thaw space of Qinghai Lake were summarized,Qinghai Lake was mainly frozen by eastern Haiyanwan area,ablation began from the western Heimahe area. There are spatial differences in freezing and ablation processes. By analyzing the relationship between freezing and thawing time characteristics of lake ice and climatic factors,winter temperature in Qinghai Lake Basin is the main factor affecting ice phenology. At the same time,wind speed and precipitation (snow) are also important factors affecting the formation and ablation of lake ice.
The distribution of permafrost is affected by local geology, landform and surface cover. In order to explore various factors which have different strength of influence on the permafrost distribution, this paper chooses five typical permafrost regions of the Qinghai-Tibet Plateau as the research area. This study is based on MODIS and SRTM DEM data extraction research of 2003 to 2012, and then, factors in them like: the average land surface temperature, NDVI, surface albedo, number of snow days, slope and aspect of the research area are studied. The geo-detector model is used to study the degree of influence and the difference of each factor on the distribution of permafrost in the research area. The results show that: (1) In all the study areas, the land surface temperature is the strongest factor affecting the distribution of permafrost, followed by the number of snow days. (2) With the increase of spatial scale range, the influence of slope and aspect on the distribution of permafrost is gradually weakened, while that of surface temperature gradually strengthened. (3) The result of interactive detection shows that the interaction of the two factors has a greater impact on the distribution of permafrost than the single one. This study clarifies the law of regional difference of permafrost distribution on the Qinghai-Tibet Plateau and provides a theoretical basis for mapping permafrost distribution at different scales.
It is well known that there is the migration of water-vapor in high speed railways mainly causing frost heaving. Visually tracking the process of water-vapor migration in soil under the freeze-thaw cycles is beneficial to study water migration, and it will provide a theoretical basis for studying the mechanisms of soil frost heave. Because of the difference of the structure between coarse-grained soil and fine-grained soil, the traditional theory used to explain the mechanisms of water migration in fine-grained soils is not applicable to coarse-grained soils. The water-vapor migration is highly probably playing an important role in coarse-grained soil, which is different with the fine-grained soil. However, at present, the research on water migration under the action of freeze-thaw cycles mostly involves liquid water migration and fine-grained soil. The researches of the water-vapor migration in coarse-grained soil under freeze-thaw cycles are relatively few. One of the main reasons is the lacking of device which is visible and can track the migration of water-vapor. In this paper, aiming at the visual tracking requirements of water-vapor migration of coarse-grained soil under freeze-thaw action, a test method based on fluorescein tracing and image processing technology is proposed to establish a soil water-vapor migration measuring device system. The modified double-layer hollow plexiglass cylinder was used as a container to isolate the external environmental temperature. A liquid water isolation device, an image acquisition system, etc. were added. The feasibility of the proposed method and device system was verified by the experiment of water-vapor migration and only vapor migration under open and closed conditions. The results show that using the developed device and under the open condition, the process of external water migration can be effectively tracked; and under closed condition, the change process of the freezing front can be monitored in real time. In coarse-grained soil, vapor migration is existing, moreover, the redistribution of water in coarse-grained soil is mainly caused by the vapor migration.
