

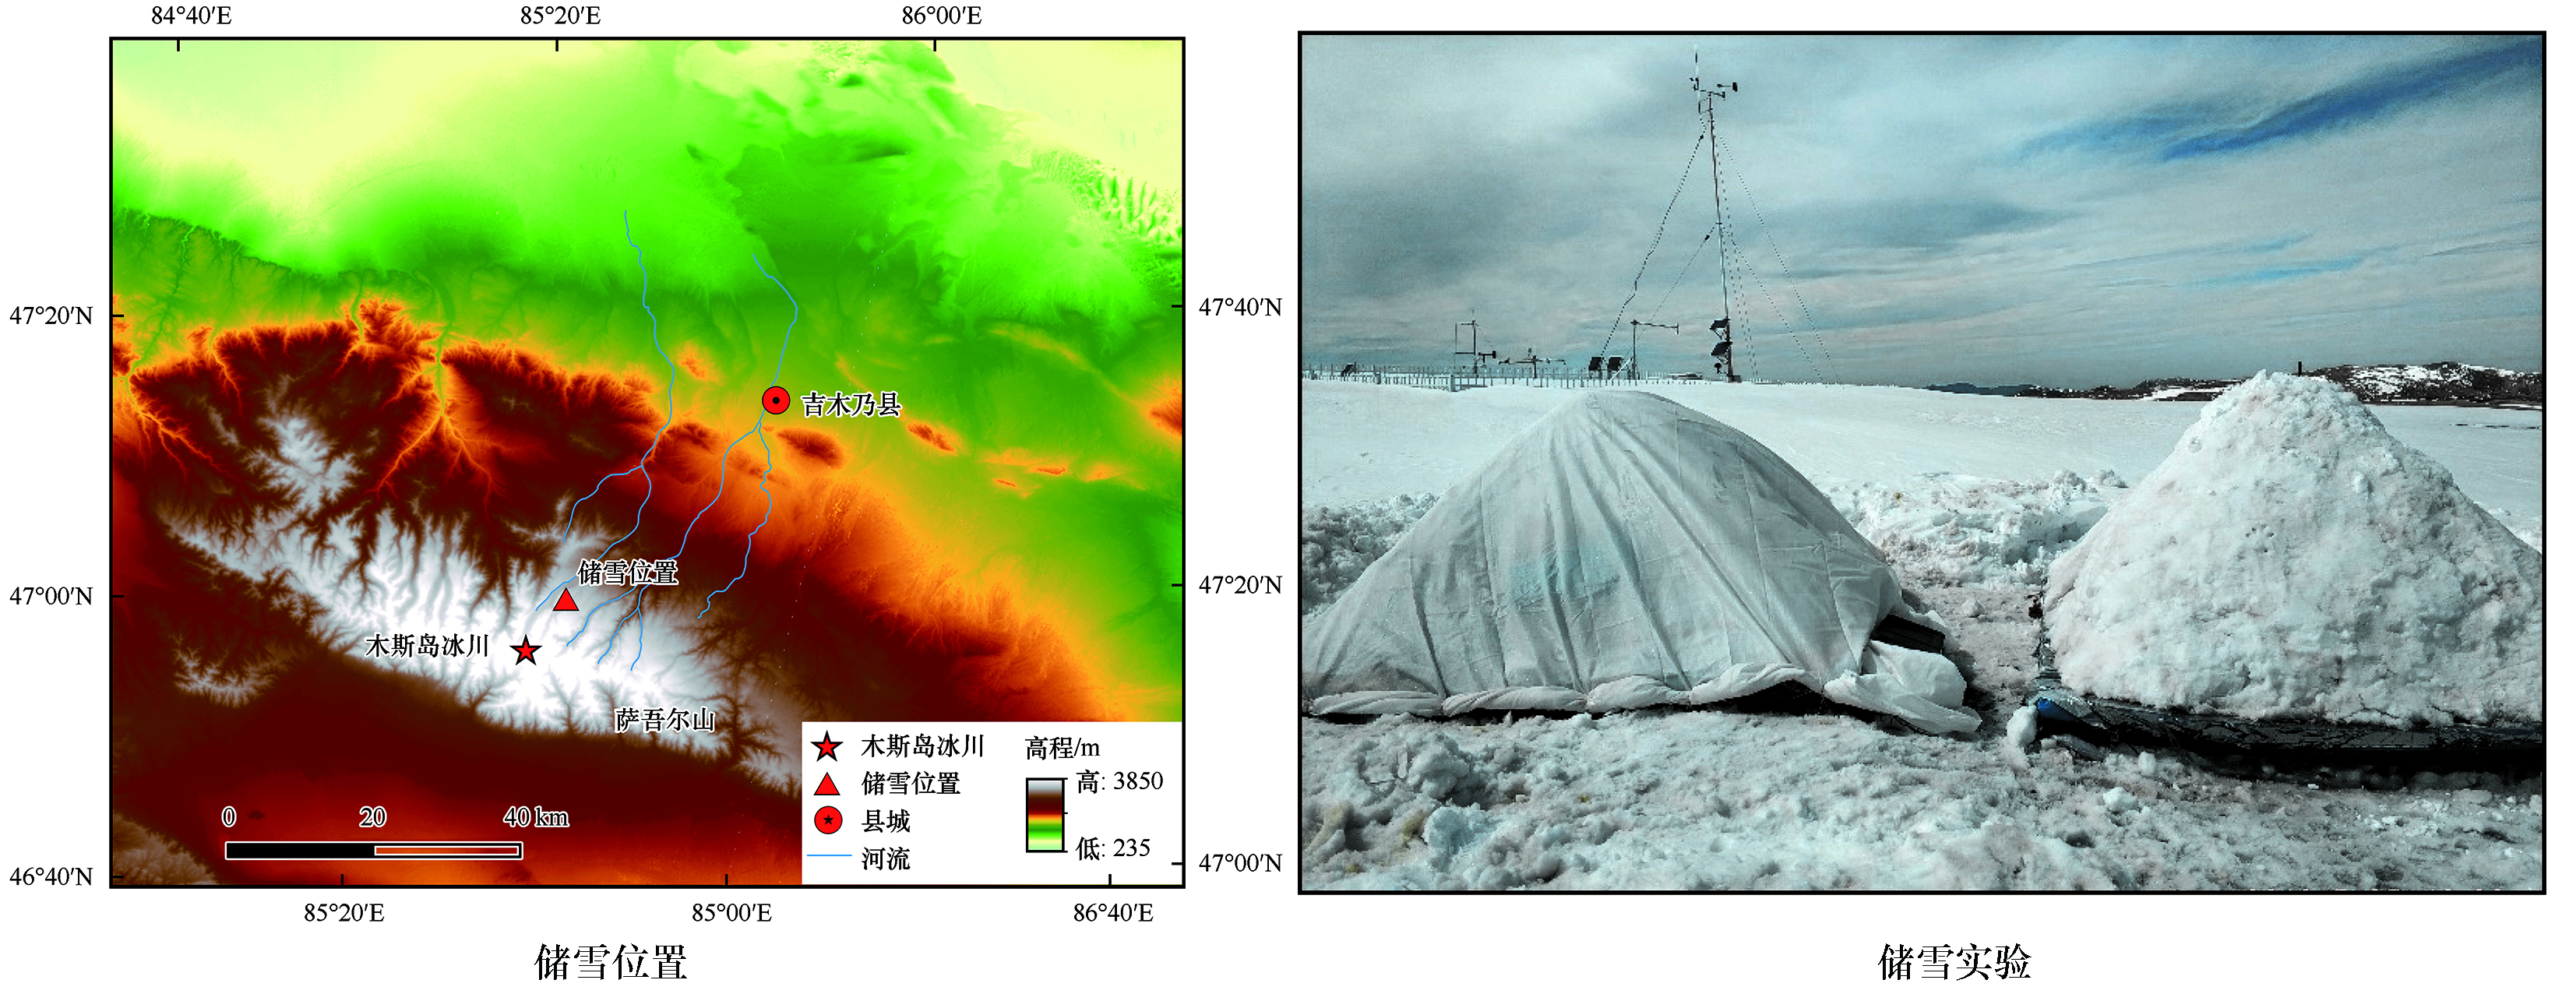
With global warming, skiing sports show sensitivity and dependence on climate change; the skiing season will be shortened to different degrees worldwide. As a coping method, snow storage has been gradually studied and applied in the skiing industry. In this paper, a snow storage experiment was carried out in Jiminay County (47°08′ N,85°35′ E,2 915 m a.s.l.), Altay, Xinjiang in May 2019. The harmonic response method studied the quantitative relationship between the amount of snowpack melting, external air temperature, solar radiation, and thermal properties of the insulation structure. The average melting rate of Snowpack 1 with two layers insulating materials was 18.0 kg·d-1 (equal to 0.85% of the initial weight). In contrast, the average melting rate of Snowpack 2 without insulating material was 120.8 kg·d-1 (equal to 6.67% of the initial weight). Glass wool blanket and aluminum foil reflective film on the upper surface of Snowpack 1 can effectively reduce the amount of snowpack melting. The external air temperature and solar radiation have good periodic variation; the 12 order Fourier series can simulate the change of solar and external air temperature. The weight of Snowpack 1 observed decreased by 1 438.0 kg, and the corresponding simulated value was 1 520.8 kg. The harmonic response method can provide momentous significance for evaluating the performance of the thermal insulation structure and determining the amount of snow storage in advance. Because many physical processes are not considered, there is still uncertainty between the amount of simulated melting and the amount of actual melting. The performance of thermal insulation structures used in snow storage can be measured by reflectivity, total heat transfer coefficient, amplitude decrement and time lag.
Snow cover has an important influence on the thermal state of the active layer and near-surface permafrost. However, the mechanism of snow cover influence on permafrost thermal state at mid and low latitudes largely remains unknown, and reliable field observation data are urgently needed for quantitative research. We analyzed the influences of snow cover on surface energy balance, surface heat flux at 5 cm, and the active layer thickness based on the observation data at two representative sites during 2012—2019. Results show that the snow cover depth greater than 21 cm shows a warming effect during autumn and winter. The active layer thickness range was separately 61~86 cm and 159~164 cm with a mean of 74.2 and 162.1 cm at Eboling (EB) and Yeniugou river basin (PT1) meteorological stations. Additionally, under the thermal influence of snow cover, the active layer thickness differed by 25 cm during 2015—2017. This study quantitative analyzes the influence of snow cover on permafrost thermal state in the upper Heihe River basin in the northeastern of the Qilian Mountains, thus providing a basis for future relevant research in this area.
This study extracted the snow cover fraction (SCF) and snow cover days (SCD) in the Hengduan Mountains by using the snow cover products MOD10A2. MODIS snow products with the advantage of high spatial resolution and high temporal resolution, have become an important data source for the study of spatial-temporal variation of snow cover. The 129 meteorological stations’data are derived from National Climate Center (NCC) of China and local meteorological bureaus, including daily air temperature, precipitation, wind speed, relative humidity and sunshine duration. By using M-K test, correlation analysis and random forest regression model, combined with the meteorological data of 129 meteorological stations in the Hengduan Mountains from 2001 to 2019, the spatial and temporal distribution characteristics and influencing factors of snow cover is analyzed. Random forest model extracts and generates a subset of training samples from the original training sample set by bootstrap resampling technology, and then generates multiple decision trees according to the training sample set. Taking SCD as the explanatory variable and influencing factor as the dependent variable, the random forest regression model was constructed, and the train set and test set were divided according to the ratio of 2∶8. The result would provide an effective reference for climate warming research, ecological protection, and social and economic development in the Hengduan Mountains. The results show as follows: The interannual variation of the annual mean SCF showed an insignificant downward trend; The change within a year is a “single peak” curve, SCF in March was the highest, 55.04%; The SCF over 3 000 m a.s.l. is relatively stable, and SCF between 1 000~3 000 m a.s.l. fluctuates greatly; Affected by monsoon, the SCF of north slope is higher than that of south slope. The distribution of snow cover days in the Hengduan Mountains has latitude zonality, and snow cover is widely distributed in the northern mountainous area and the SCD is high while the SCD in the southern Yunnan-Guizhou Plateau is low. The average SCD in the Hengduan Mountains ranged between 55.16 and 79.47 days, about 28.46% area (2.65% with a significant decline) of the Hengduan Mountains showed a declining trend in SCD, while 21.66% area (0.68% with a significant increase) showed a increasing trend in SCD. Kangding City, Jiulong County and its surrounding areas in the central part of the Hengduan Mountains showed a significant decreasing trend, while the high-altitude mountains along the Zadoi County to Zoige County in the north showed an obvious increasing trend. As a whole, the SCD is positively correlated with precipitation and relative humidity, and negatively correlated with wind speed, air temperature and sunshine duration. The areas with significant positive correlation with precipitation are mainly distributed in Zadoi County and Chindu County in the northwest, the areas with significant negative correlation with wind speed are mainly distributed in Chindu County in the northwest and Kangding City in the middle, the areas with significant negative correlation with temperature are mainly distributed in Jiulong County in the middle and Chindu County in the northwest, the areas with significant positive correlation with relative humidity are mainly distributed in Zadoi County to Serxu County in the north, the areas with significant negative correlation with sunshine duration are mainly distributed in Maqu County in the northeast and Chindu County in the northwest. SCD is most affected by air temperature and elevation, and sunshine duration and wind speed are the secondary factors.
Snow on the Tibetan Plateau (TP) is a vital fresh water source in western China and Himalayan regions, and snow cover variation is also a significant indicator of climate condition in the TP and its surroundings. As a snow cover product based on blended approaches, including active and passive satellite sensors, ground observation and other auxiliary information, NOAA IMS (Interactive Multisensor Snow and Ice Mapping System) is most widely used for large-scale snow cover detection and relevant climate research. In this study, the evaluation of the historical positioning coordinate accuracy of representativemeteorological stations for snow observation in the TP is systematically made for the first time, and then the accuracy and applicability of NOAA IMS 4 km and 1 km products over the TP are verified and evaluated using snow depth data from these stations, and the effect of IMS spatial resolution improvement from 4 km to 1 km on the snow detection accuracy over the TP, and the influence of the difference between the historical and GPS positioning coordinates of meteorological stations on the accuracy of IMS snow detection over the TP are quantitatively analyzed in this study. The results show that: There are great differences between the historical coordinates and current GPS positioning information for some meteorological stations in the TP, such as the longitude of Amdo (Anduo) Meteorological Station recorded by historical positioning is 0.6° smaller than GPS positioning and the latitude is 0.08° greater than GPS positioning information. Overall accuracy of IMS 4 km product on the TP ranges 76.4%~83.2% with an average of 80.1%. The accuracy of snow detection is 35.8%~60.7% with an average of 47.2%, and average commission error rate is 17.1% while average omission error rate is 45.5%, which generally features that the more snow-covered days and the higher average snow depth are observed on the ground, the lower the overall monitoring accuracy and the higher the snow detection accuracy. Compared with IMS 4 km product, overall accuracy of IMS 1 km increased by 2.9% on average, the accuracy of snow detection increased by 0.9%, average commission error rate reduced by 5.1% and omission error rate increased by 4.1%, which is mainly caused by the greater accuracy improvement of several stations while there is little impact on the overall accuracy improvement of snow detection for most of stations on the TP. Except for some meteorological stations, the impact of differences between the historical and GPS positioning coordinates of meteorological stations on IMS 4 km product accuracy over the TP is limited at present. However, with the development of satellite remote sensing technology, remote sensing snow products with higher spatial-temporal resolution will be used for snow monitoring and study in the future. Accurate coordinate information of ground observation station is essential for accuracy validation and practical application of these remote sensing data.
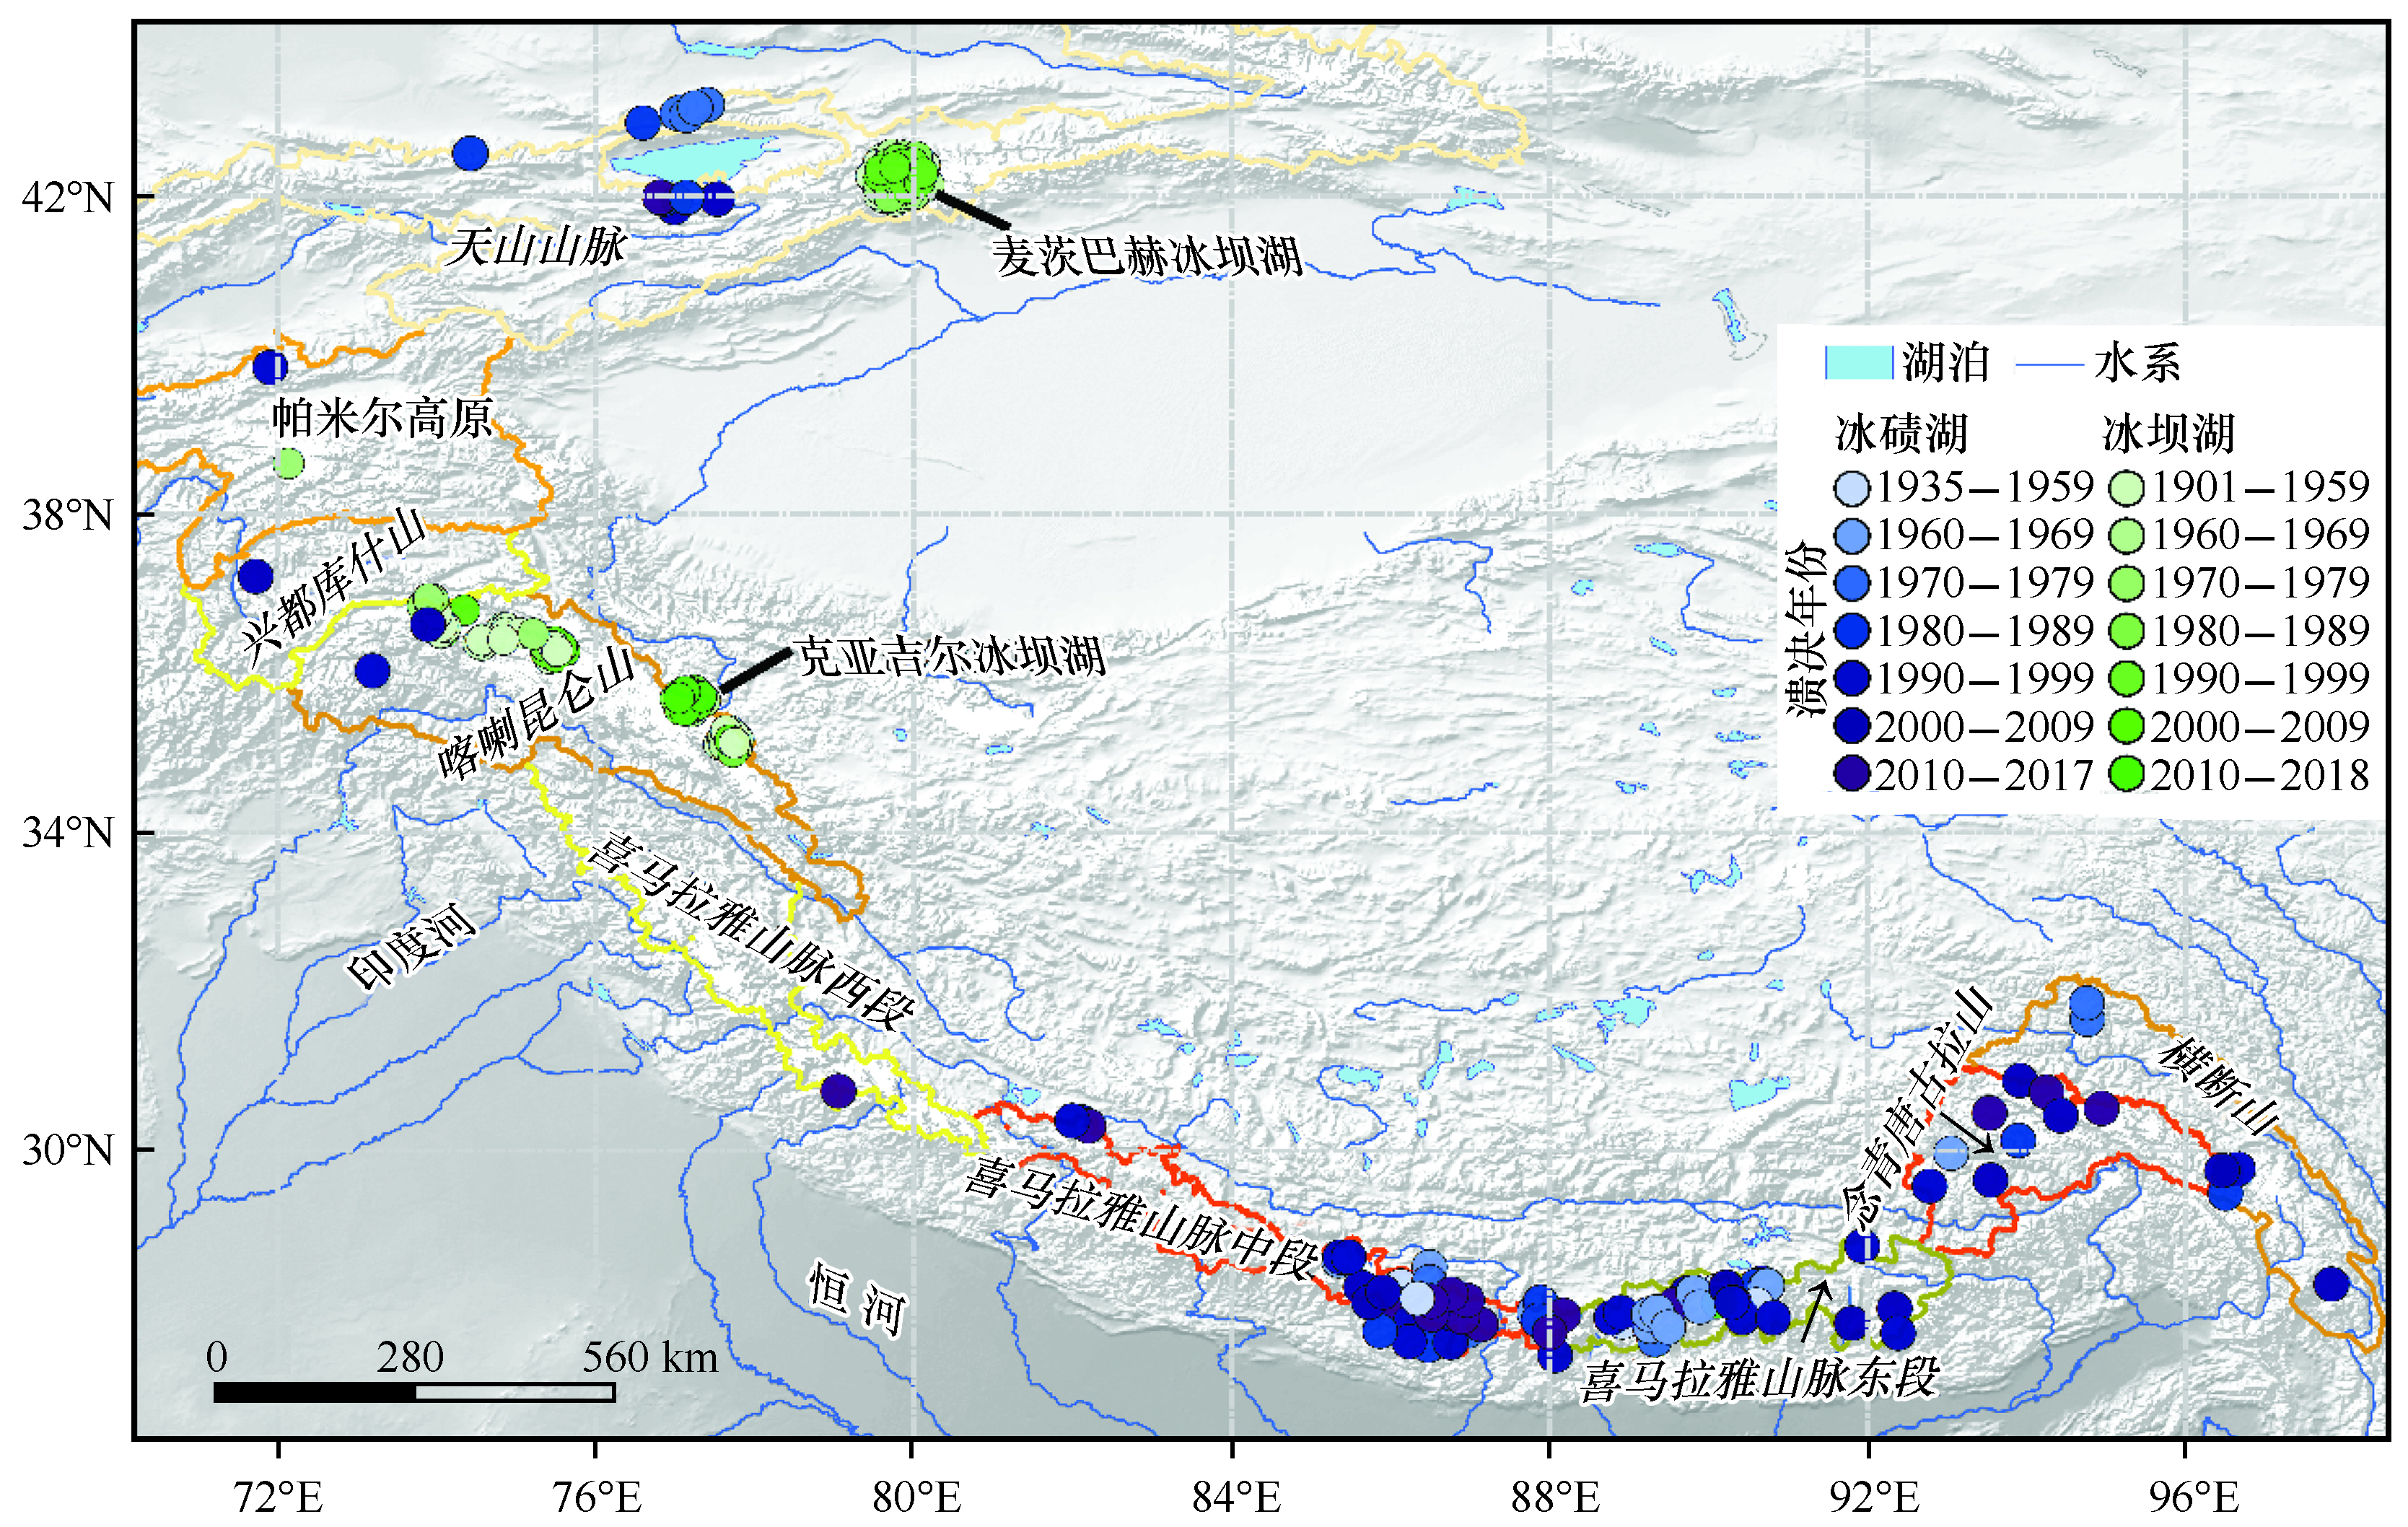
Glacial lake outburst floods (GLOFs) are formed by the rapid and massive release of water from glacial lakes. In the context of global warming, it is imperative to establish a GLOFs database for glacial lake risk assessment and management to strengthen social awareness, response and prevention of GLOF hazards. On the High Mountain Asia (HMA), GLOFs are mainly distributed in the Tian Shan, Karakorum, Himalayas, Nyainqentanglha, Hengduan Shan areas. Since the 20th century, a total of 277 GLOFs have occurred on HMA, including 113 moraine-dammed lake outburst floods and 164 ice-dammed lake outburst floods. The glacial lakes that have drained account for about 0.4% of the total number of glacial lakes in the region. Since 1980, the frequency of GLOFs has shown a slightly increase, with no significant increased change in the glacial lake outburst water volume and peak discharge. With eight GLOFs in the Nepalese and Chinese central Himalayas between 2010 and 2018, the region has overtaken the Tian Shan, eastern Himalayas and Nyainqentanglha ranges, and becomes a region that is vulnerable to GLOFs and requires special attention and prevention efforts. The triggers of moraine-dammed lake outburst on HMA are diverse. Glacier/ice-avalanches have a dominant role, accounting for 50.1%. Moraine dam subsidence or piping, and heavy rainfall or upstream water, both account for about 20%, and landslide-rock avalanches induced moraine outbursts accounted for 7.4%. Facing the increasing frequency of GLOFs in the future, the relevant countries and regions need to strengthen communication and jointly foster a standard prevention and control system to curb glacier disaster damage and protect the natural eco-environment of high mountain areas.
Based on the daily precipitation of 25 meteorological stations from 1961 to 2017, the temporal and spatial variations in extreme precipitation events in the endorheic area in alpine region were analyzed. The results showed that the precipitation in study area delineates a significant increasing tendency, such an increase may largely stem from the contribution of the increase in summer precipitation, and the increasing trend of precipitation was more obvious after 1990s. Except CDD, the extreme precipitation index showed an increasing trend with different degrees, and the precipitation in the endorheic area in alpine region developed to the direction of heavier precipitation, more days, stronger intensity and greater extreme value after entering the 21st century. The percentage of stations with CWD, PRCPTOT, SDII, RX1Day, RX5Day, R95 and R10 showing a significant increasing trend was 5%, 64%, 42%, 60%, 32%, 35% and 43%, and the percentage of stations with CDD showing a significant decreasing trend was 5%.Extreme precipitation events were consistent. As total precipitation increased, the frequency, intensity and extreme value of extreme precipitation also increased, and the increase of light rain days was one of the factors contributing to the increase of total precipitation. The humidification amplitude of the extreme precipitation index increases with the increase of altitude. The increase of precipitation and number of rainy days in high altitude area was the main factor for the increase of total amount of extreme precipitation.
The soil hydrothermal condition plays a significant role on the study of climate change and vegetation degradation and so forth over the Tibetan Plateau. The accurate characterization of soil moisture will also influence the simulation capability of precipitation in local and its downstream areas. Therefore, with soil temperature and soil moisture measurements at Amdo site of Nagqu Station of Plateau Climate and Environment, Chinese Academy of Sciences, and meteorological data at Amdo Meteorological Station during January to December 2014, this paper investigated the distribution of soil temperature and soil moisture along with their relationship with meteorological factors such as air temperature and precipitation in the middle region of Nagqu over the Tibetan Plateau. Results show that: The soil temperature exhibited sinusoid variation at shallow layer, then the curve is gradually close to straight line with the depth of soil. The soil temperature rose rapidly and the cooling process was quite slow. The freezing and thawing date were delayed with the depth of the soil while the freeze-up period was gradually shortened. The intra-day variation of soil moisture was small at different depths. The monthly variation indicated the structure of single peak, and the maximum and minimum values basically appeared in August and December, respectively. The rate of soil moisture increase was much slower than the decreasing process. The regional distribution derived from GLDAS-NOAH was similar to the variation of observation. The variation tendency of soil temperature and soil moisture was not consistent in one year, though there was close positive relationship between them. The temperature gradient of the shallow layer was obviously larger than the deep layer. The soil moisture of shallow layer was largest, followed by the middle layer, and the moisture was smallest at deep layer. With the transition from dry season to wet season, non-adiabatic heating increased due to the increase of solar radiation. The relationship of soil moisture to meteorological factors varied with different periods, but generally soil moisture was positively correlated with air temperature, precipitation and relative humidity while without obvious relationship with wind speed and sunshine duration.
Soil freeze/thaw process (F/T) is sensitive to climate change, accurately monitoring the soil F/T has important scientific significance. The brightness temperature data observed by ELBARA-III, as well as soil temperature and near-surface air temperature at the Maqu site of the of the Zoige Plateau Wetland Ecosystem Research Station, Chinese Academy of Sciences, from June 2017 to June 2018 are deployed in this study. Four soil frost factors (FF) of which are normalized polarization ratio, polarization difference, combined horizontal polarization difference, and combined vertical polarization difference were constructed with the ELBARA-III data. The characteristics of the freeze-thaw process in source region of the Yellow River were evaluated by these four frost factors. The results show: There are agreements between FFs and the F/T estimated from two reference data sets (in situ measurements of soil temperature and air temperature). Frost factor of the normalized polarization ratio and frost factor of polarization differenceget the highest accuracy of 83.6% and 82.8% under the incident angle of 50°, respectively. All frost factors have seasonal changes, the four frost factors were higher in spring than in summer, autumn and winter. The standard deviation of the normalized relative frost factor is the largest in autumn, and the maximum can reach 0.3; it is the smallest in winter and summer, and the minimum is less than 0.2. The brightness temperature difference between H-polarization and V-polarization decreases in freeze/thaw transitions, and the difference in the polarization difference during the freeze/thaw transition period is more significant than that during complete frozen or complete thawed period. The results are potential to provide technical supports for monitoring soil F/T by using microwave remote sensing.
The process and characteristics of glacier surging are important to understand glacier surging mechanism. In this paper, the velocity and surface elevation of Kunchhang Glacier, East Karakoram are obtained and analyzed by using Envisat-1/ASAR, Sentinel-1A, TerraSAR-X/TanDEM-X datasets. The results show that from 2000 to 2012, the average thickness increasing of the central glacier upstream was (10.19±1.79) m, and the glacier receiving area was mainly melting, with an average thinning of (39.71±1.79) m; from 2012 to 2014, the formed bulge moved downward, with an average thickness increasing of (8.21±1.37) m; combined with ICESat-2 laser altimetry data in 2018 and 2020, it is found that the overall thickness of reservoir area decreased by (9.77±3.38) m, and the average thickness of central trunk (receiving area) was (19.67±3.38) m. Surface velocity of the trunk of glacier has increased significantly since 2007, and has experienced two rapid flow periods during 2017—2018, and the maximum velocity of the two stages reaches 2.36 m·d-1 and 2.12 m·d-1, respectively. According to change of elevation and characteristics of flow velocity, we consider that Kunchhang Glacier experienced surging from 2007 to 2019. The time series of velocity shows that Kunchhang Glacier was likely to be formed by mini-surge / avalanche in the reservoir area (surge front), and the two rapid movements suddenly decelerated at the end of summer. It is likely that the opening of the subglacial hydrological channel reduced the hydrostatic pressure under the ice, leading to the surge terminate, which belongs to the Alaskan-type. According to the analysis of ITS_LIVE velocity data, the period of the surge is about 30 years. Comparing with the Landsat images of time series, it is found that the southern branch of Kunchhang Glacier experienced surging from 2004 to 2005, resulting in the disappearance of the small glacial lake between the terminus and the glacier trunk.
In order to study the spatial and temporal distribution characteristics of the insoluble microparticles in snow cover and its environmental implication, six snowpits were dug near the equilibrium line altitude (ELA) and 89 snow samples were collected at Yehelong Glacier, Mt. Anyemaqen by the end of September 2005. Insoluble microparticles concentration and oxygen isotope were analyzed. The results indicated that the mean number concentration of particles (0.56 < r < 400 μm) is 1.1×10⁵ mL-1, particles less than 10 μm accounts for 99%. Mean number-weighted sizes were among 1.1~1.8 μm which suggested the snow contained more fine particles. The concentration and size of insoluble microparticles both were lowest at the middle part of the snow pits, were highest near the dust layer at the lower part, were somewhere in between at the upper part. The number-size distribution of insoluble microparticles in snow cover displayed abnormal distribution. The intensity of the dust source and atmospheric circulation was the main factors that control the characteristics of the insoluble microparticles in snow cover. The concentration and size of microparticles increased when the dust source and atmospheric circulation strengthened, and vice versa. It only when the atmospheric circulation strengthened, the size increased even faster than the concentration of the particle. Combining with HYSPLIT-4 model, the research shows that the variation of size and concentration of particles over the depth of the snowpit could reflect the seasonal change of atmospheric circulation. Westly wind which went through Taklimakan Desert and arid regions of Central Asia brings more small particles to Yehelong Glacier in spring and autumn.
Based on the daily average air temperature and minimum air temperature data of 164 meteorological stations in Northeast China from 1961 to 2016, according to the Chinese national standard Grade of cold wave (GB/T 21987—2017), we applied linear trend, trend coefficient, Mann-Kendall test, wavelet analysis and other analytical methods, and calculated the occurrence frequency, temperature drop and continuous days of the cold wave process of the stations, and spatial and temporal distribution characteristics of the cold wave in Northeast China were analyzed. The results show that the winter average air temperature of each station has a small correlation with cold wave days of three types (super-strong cold wave, strong cold wave and cold wave). The colder areas with lower average temperature in winter and the warmer areas with higher temperature have little difference in the number of cold wave days. There are obvious regional differences in the spatial distribution of the three types of cold wave days. There are relatively more in high-altitude areas, and relatively few in low-altitude and plain areas. This conclusion is consistent with the actual occurrence of cold waves. The distribution characteristics of the three types of cold waves are determined by the cold wave path. When cold air enters from the east, middle, and west routes, the Greater Khingan Range and west side of the Changbai Mountains are most affected, and the Songliao Plain on the east side of the Greater Khingan Range is affected by the foehn effect and low altitude factors. The cold air gradually degenerates, the degree of influence gradually decreases and weakens; the Sanjiang Plain is affected by the regional climate and the blocking effect of the Lesser Khingan Range and the Changbai Mountains on the cold air, the cold wave is weaker, and the number of days is less. On the annual scale, the number of days and station-times of the three types of cold waves showed a decreasing trend from 1961 to 2016, and the rate of decrease was super strong cold wave > strong cold wave > cold wave; On the decadal scale, the three were relatively high from the 1960s to the end of the 1970s, and entered a relatively small period since 1980. There was a small increase after the mid-2000s, but the magnitude was significantly smaller than that of the 1980s. The rate of decrease means that the frequency of cold waves has increased since the beginning of the 21st century, but the long-term downward trend has not changed. Both the number of cold wave days and the number of station-times have obvious short-term periodic changes of 3 to 5 years. Before the 2000s, the period was mainly about 3 years, and in the 2000s, the period was about 5 years. The spatial variation of winter temperature in Northeast China from 1961 to 2016 showed a consistent increase in the whole region, and 66% of the stations increased significantly. The mutation point of the winter temperature was detected in 1981. After the climate in Northeast China warmed, the number of cold wave days and station-times of the three types decreased significantly, with the most significant decrease in eastern Jilin and northeastern Liaoning.
The freeze-thaw of soil is intense, which affects greatly humidity and temperature of soil in spring in Heilongjiang Province. Based on the data of maximum temperature, minimum temperature, mean temperature, precipitation, ground temperature of 64 meteorological stations of 1961—2018 and humidity of the soil of 34 agrometeorological stations of 1981—2018. It analyzed the factors of meteorological during soil freezing. It also studied the changes of humidity and temperature during freezing and thawing in spring. The main conclusions are as follows: The period of soil freezing was shortened from north to south and it was shortened year by year. The average temperature of soil freezing increased from north to south and it increased year by year. The precipitation was less in the west and more in the east and in the north, it increased year by year. The number of freeze-thaw times in spring was less in the plain and more in the mountainous and it was decreasing year by year. The start date of snowmelt was advancing from north to south and the trend was advancing year by year. The warming rate of snow melting was lower in the north and east, higher in the middle and south. Humidity of the soil increased with the increasing of soil depth, and humidity of the soil was affect mostly in the east during freezing and thawing in the spring. During the freezing of the whole winter, Humidity of the soil in the north, middle and east increased, and with the increase of soil depth, the more humidity of the soil increased, while the humidity of the soil decreased in the west, and with the increase of soil depth, the less humidity of the soil decreased; During freezing and thawing in the spring, the average ground temperature of 0 cm was between -17.3 ℃ to 22.1 ℃, the change trend of the south and the whole province was the same basically, the heating trend was obvious, while the heating rate in the north was obviously slower than that in the south. The warming rate of snow melting period is low in the north and east, high in the middle and south.
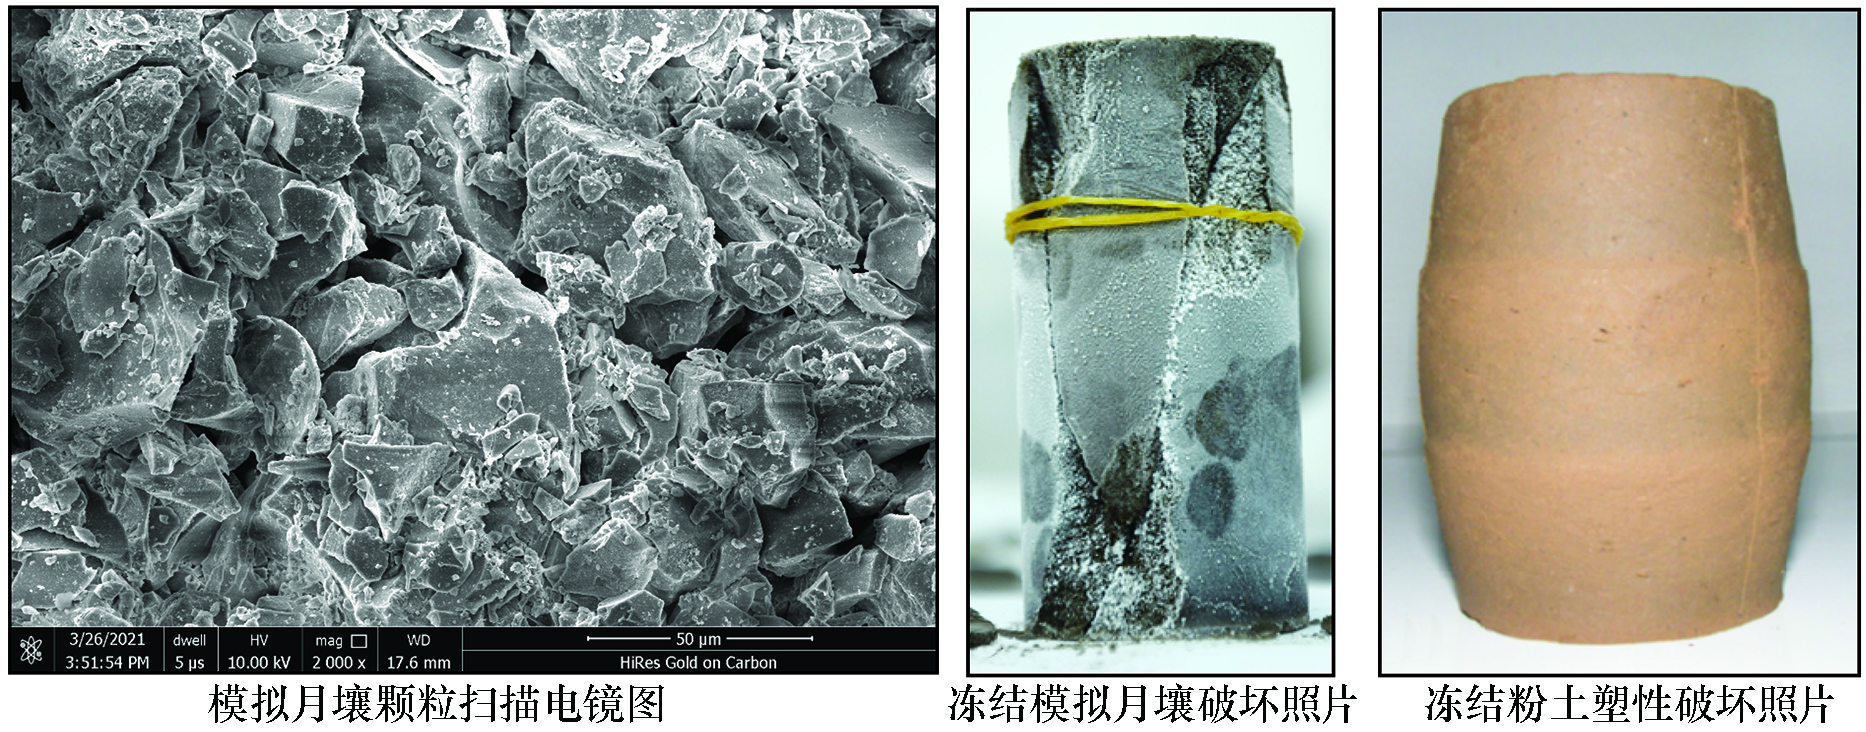
In recent years, more and more detection results show that there is water ice in the lunar soil in the permanent shadow area of the lunar polar region. Water is not only a chemical substance for human survival, but also a key link to understand the unique formation and evolution of the Moon. Therefore, all space powers regard the lunar polar region as an important goal of lunar exploration projects. The thermal conductivity and uniaxial compressive strength of frozen lunar soil are the basis and key parameters of in-situ exploration and sampling in the lunar polar region. The thermal conductivity and uniaxial compressive strength of frozen simulated lunar soil were studied by low temperature test. The results show that the thermal conductivity of frozen lunar soil increases linearly with the increasing of water content. The thermal conductivity of frozen simulated lunar soil is 0.2~1.3 W·m-1·K-1. Brittle failure occurs during uniaxial compression of frozen lunar soil. The uniaxial compressive strength of frozen simulated lunar soil with 5% moisture content is about 5 MPa, and that of frozen simulated lunar soil with 10% moisture content is about 13 MPa. In the initial loading stage, the strain caused by micro crack compaction of frozen simulated lunar soil samples with the same dry density and different moisture content is basically the same; In the online elastic stage, the effective elastic modulus of frozen lunar soil increases with the increasing of water content, which is mainly because the water content increase the freezing strength between lunar soil particles; In the failure stage, the frozen simulated lunar soil with high moisture content shows brittle failure characteristics, and the frozen simulated lunar soil with low moisture content shows more significant plastic characteristics. The results will provide basic scientific data support for the formulation of water ice detection scheme and the development of detector in the permanent shadow area of the Moon.
Based on the ground temperature and frost depth data of 144 national meteorological stations in Northeast China from 1951 to 2016, the spatial and temporal characteristics of ground temperature and frost depth in Northeast China were analyzed by using the statistics and linear models. The results show that the ground temperature in Northeast China decreases gradually from south to north, and frost depth increases gradually. The mean annual ground temperature at each layer decreases by about 1 ℃ per 2 latitudes, the annual mean maximum frost depth increases by about 30 cm per 2~3 latitudes, and maximum frost depth increases by 30 cm per 2 latitudes. The ground temperature significantly negatively correlates with latitude, and the frost depth positively correlates with latitude. The ground temperature and frost depth are not significantly correlate with longitude and altitude in the permafrost areas in the north of Northeast China. The seasonal characteristics of ground temperature at different depths are different, and the seasonal change of surface temperature are consistent with that of air temperature. The ground temperature below 160 cm is highest in autumn, followed by summer and winter, and it is lowest in spring. The surface ground temperature difference between summer and winter was up to 33.5 ℃, while that between the warmest season and the coldest season at 320 cm is only 7 ℃. Climate warming leads to the increase of ground temperature at each layer and the decrease of frost depth. The freezing period days also decrease, especially in the permafrost areas and its adjacent high latitude seasonally frozen soil areas. Compared with other soil layers, the surface ground temperature increased the most. In Yichun, the trend of surface ground temperature rise was 1.16 ℃?(10a)-1, and that of 40~320 cm soil layer was about 0.60 ℃?(10a)-1. The decreasing of frost depth and the decreasing of freezing period days are 23 cm?(10a)-1 and 8 d?(10a)-1, respectively, which may lead to permafrost degradation.
Permafrost regions account for one fourth of the lands in the Earth. As a hydrogeological phenomenon in permafrost regions, the distribution of supra-permafrost groundwater is dominated by local factors, which has changed with the seasonal freezing and thawing of the active layer. The supra-permafrost groundwater has affected the cycle of groundwater, ground surface water and hydrothermal balance of the permafrost environment. The supra-permafrost groundwater is limited by the permafrost in a narrow space and aggravates the permafrost degradation by the lateral seepage and heat transfer. Furthermore, the foundation is threatened by the supra- permafrost groundwater by heat convection. The existed research focuses on the distribution, seasonal change, flow, seepage and hydro-thermal coupling. In this paper, the research advances on supra-permafrost groundwater are summarized based on the characteristics of regional distribution. The influence on engineering stability, hydrologic model, water balance calculation and heat transfer effect of supra-permafrost groundwater are reviewed. The supra-permafrost groundwater has interacted and limited with the permafrost, which will cause the profound effects on the ecological environment in permafrost regions. The research prospect in future is proposed. This paper will be helpful to comprehensively understand the role of supra-permafrost groundwater in the hydrologic process and useful to learn the status of supra-permafrost groundwater.
As the most suitable form of foundation in frozen soil engineering, pile foundation mainly adopts three types of piles, plugging pile, the static pressure pile and the bored pile. Because of the different pile formation process, the difference between the frozen ground and the pile foundation itself is different. In order to research on the influence of different pile formation technologies on the permafrost foundations and bearing behavior of foundation piles. The introduction dead load model test of the single pile under -1.5 ℃ conditions which is carried out to analyze influence laws of the ground temperature field, the ultimate bearing capacity of single pile, the axial force of pile shaft and the friction resistance on impact of using different pile formation technologies in the frozen silt. It is found that the bored piles has a violent disturbance to the ground temperature field, so the temperature of pile side is higher, and large amplitude of changes in ground temperature. With the refreezing of the soil around piles, the ground temperature is gradually decreased. The cooling rate of the bored piles is the biggest; In terms of bearing capacity, the ultimate bearing capacity of the two types of bored piles is about 12.8 kN , and the static pressure pile is 11.6 kN, the ultimate bearing capacity of plugging pile is the minimum, which is only 2/3 of the bored pile; And compared the corresponding settlement of the piles of four piles by using different formation technologies under different load conditions, and reflecting the difference caused by using different formation technologies on the pile foundation settlement; With the increasement of load on pile top, the friction resistance and the tip resistance gradually play. Due to the temperature of 1/3 of pile is lower which makes the friction resistance larger. The temperature was least near the depth of 10 cm, so the friction resistance reaches the maximum value. Compared the transmission of the axial force along the pile body under the load of 5.6 kN. It is found that the static pressure piles are more easy to transfer the load to the deep foundation in the frozen soil; Drawn the rheological curves of four piles by using different formation technologies. It is found that the long-term bearing capacity of the two kinds of bored piles is about 6 kN, the static pressure pile is 4.5 kN and the plugging pile is 3.5 kN. The test result shows that the different pile formation technology has caused some extent of difference in the long-term bearing capacity of the piles in the frozen soil.
Based on the number of deaths, collapsed houses, collapsed sheds, livestock deaths, and the disaster area caused by rainstorm flood disasters in southern Xinjiang between 1980 and 2019, the ratio weight method and the dimensionless linear summation method are used to construct the disaster index of rainstorm flood disaster events. According to the disaster index, rainstorm flood disaster events can be divided into four grades by percentile method: general, heavy, severe, and extra severe. The results show that: The rainstorm flood events in southern Xinjiang are more in northern margin of the Tarim Basin than in southern margin, and more in western than in eastern, and the high value areas are distributed in Aksu Prefecture, Kashgar Prefecture and Kizilsu Kirgiz Autonomous Prefecture. The rainstorm flood events in southern Xinjiang mostly occurred from March to October, and the annual average occurrence frequency showed an obvious upward trend with an increase of 8 times per ten years, which mainly performed the increase in frequency of general disasters. The rainstorm flood disaster index had two mutations in 1985 and 1999, and the disaster loss index showed a “low-high-low” periodic change. The frequency of rainstorm flood disasters is closely related to precipitation, days of heavy rain and rainstorm in southern Xinjiang from March to October. On the whole, the increase of precipitation in southern Xinjiang in recent 40 years has led to the increase of rainstorm flood disasters, which mainly performed the raise of general rainstorm flood events. The average annual disaster loss index is closely related to the number of severe and extra severe disasters, which contributed 87% to it.
Based on the Budyko curve equation, we calculated interannual and seasonal variation characteristics of actual evapotranspiration in the Ebinur Lake oasis from 1960 to 2013. The four remote sensing images of the study area were selected for land use/cover classification, and the landscape pattern index was calculated with Fragstats 4.2. The relationship between actual evapotranspiration and landscape pattern index shows that: The average actual evapotranspiration in the Ebinur Lake oasis is 162.97 mm, which was an upward trend with a tendency rate of 7.76 mm·(10a)-1; the actual evapotranspiration in summer and autumn was an upward trend, while the spring was a downward trend; the mutation in abrupt increase of annual actual evapotranspiration occurred in 1987. As to the seasonal mutation, the abrupt increase of summer and autumn occurred in 1992 and 1975, respectively. However, the actual evapotranspiration in spring did not exhibit mutation. The four periods of land use/cover map show that desert was dominated in the Ebinur Lake oasis, which was more than 50% in area, while cultivated land and urban land had a significant increase, which reached to 409.69% and 704.56%, respectively. Landscape pattern indices showed a significant difference at patch types level, and all landscape pattern indices showed a fluctuate increase at landscape level. At patch types level, the significant correlations were only observed among the actual evapotranspiration with water NP and PD, the correlation coefficient were both -0.981 (P<0.05); at landscape level, a negative relationship was observed among the actual evapotranspiration with LPI, CONTAG and COHESION, while a reverse one was among the NP, PD, IJI, SHDI and AI. The largest correlation coefficient was 0.953 (P<0.05) between the actual evapotranspiration and AI, while the two lowest correlation coefficient both were 0.148 occurred at NP and PD. This indicated that the AI index can better characterize the variation of the actual evapotranspiration in the Ebinur Lake oasis.
Forest litter decomposition plays an important role in maintaining the element cycle and nutrient balance of the ecosystem, which is affected by the freeze-thaw patterns under different levels of snow thickness. Freeze-thaw stage (i.e. freezing onset, deep freezing and thawing stage) is an important period of litter decomposition in permafrost zone, accounting for about a half of mass loss in the whole year. Reduced snow cover would decrease soil temperature and increase freeze-thaw cycles, which would influence litter decomposition. The paper reviewed the effects of snow cover on forest litter decomposition in the recent 10 years. Reduced snow cover would decrease litter mass loss, carbon element release and cellulose degradation during the freeze-thaw period and in the whole year, but increase during the growing season. Freeze-thaw action would result in litter physical fragmentation, and then accelerate litter decomposition in the following growing season. Reduced snow cover usually decreased nitrogen element release, but no clear trends were found in the growing season and whole year. There were some large differences in the results of phosphorus and lignin. Finally, the problems of snow cover effects on forest litter decomposition were discussed and the future research directions were prospected.
The Qinghai-Tibet Plateau (QTP) is a key region with diverse and frequent natural disasters in China. Earthquakes, landslides, mud-rock flows, glacial lake outburst, and snow disasters are widely developed in the region, which have a wide distribution of disasters and huge damage and impact, and have become an important constraint to the sustainable and healthy development of the plateau’s economy and society. The risk levels of natural disasters on the QTP have obvious spatial heterogeneity. The high-risk areas for earthquakes, landslides, mudslides, and glacial lake outbursts generally located in a large area on the southern and eastern edge of the QTP as a whole, which is also the area where multiple disasters occur frequently. Many road networks and pipe networks are located in this area, which has great potential hazards. The QTP has complex topography and landforms, strong spatial heterogeneity of climate change, developed cryosphere, extensive transportation and other infrastructures, and poor economic conditions. These factors have formed the main hazard factors and disaster-generating environment for the development of multi-natural disasters. The QTP is affected by multiple disaster-causing factors, and the multi-disaster-bearing bodies overlap. It is urgent to strengthen the comprehensive management and control of multi-natural disaster risks. The dominant idea of comprehensive risk control is that decision makers use the research results of multiple disasters mechanisms to prevent, mitigate or avoid comprehensive risks of multi-natural disasters through engineering and non-engineering measures with the help of the concept of joint prevention and control of various departments. Specific comprehensive risk management and control strategies include real-time monitoring/observation, information sharing, multi-ministerial consultation, mass observation and mass preparedness, education and training of disaster prevention, disaster insurance, and pre-disaster planning.
At present, there is a lack of comprehensive research on urban vulnerability of western cities in China. Taking Urumqi as an example, according to 50 specific evaluation indexes from 2006 to 2016, this paper makes a comprehensive evaluation and dynamic evolution prediction of its vulnerability from four aspects: resources, ecology, economy and society. The results showed that the urban comprehensive vulnerability index of Urumqi City from 2006 to 2016 was in a state of decline. Ecological vulnerability and economic vulnerability show a decreasing trend in varying degrees, and the overall vulnerability of resources is relatively stable, but the social vulnerability gradually increases, especially during 2014—2016 the growth trend is more obvious. The main influencing factors of urban vulnerability are extracted by using the contribution rate calculation method and the correlation coefficient analysis method, then the prediction model is constructed and the model with the highest precision is selected for prediction. The results show that the urban vulnerability of Urumqi City will fluctuate slightly and increase during 2016—2019, and then decrease after 2019. Finally, the paper puts forward the problems to be improved in future development of Urumqi City. This study can provide a reference for the study of urban vulnerability in other central and western cities in China, and also provide scientific basis for urban vulnerability control and decision-making in Urumqi City.
Luoji Mountain is located in the eastern margin of the Qinghai-Tibet Plateau and the central part of the Hengduan Mountains. The well-preserved Quaternary moraines in the Qingshui Valley exhibit great potential for reconstructing paleo-glacier extents and examining climate changes in the region. Three sets of moraines were successively preserved, from the cirques to the mouth of Qingshui Valley. These glacial moraines can be assigned to Penultimate Glaciation (MIS 6), early stage of Last Glaciation (MIS 4), and late stage of Last Glaciation (MIS 2). Guided by the Quaternary moraine features, this study used glacier reconstruction tools to reconstruct paleo-glacier surfaces and glacier equilibrium-line altitude (ELA) for three Quaternary glacial stages in the Qingshui Valley. Researchers previously considered modern terrain instead of ancient ice height when employing the accumulation area ratio (AAR) and area altitude balance ratio (AARB) methods to calculate the ELA, which resulted in an underestimation of the ELAs of ancient glaciers. In this study, the AAR and AARB methods were used to calculate the material balance line height during various periods after ancient glacier restoration to increase the ELA calculation accuracy. For 30 years, from 1990 to 2019, temperature and precipitation data from six weather stations of the National Meteorological Data Center demonstrated that the air temperature decline rate was 0.54 ℃·(100m)-1. By combining this data with the precipitation-temperature and temperature lapse-rate models, we obtained the climate conditions of different ice ages. The primary findings are as follows: The surface heights of the glaciers were 2 125~3 826 m, 3 380~4 055 m, and 3 765~4 043 m, the glacier areas were 3.44 km2, 2.22 km2, and 1.20 km2, and the glacier volumes were 0.19 km3, 0.12 km3, and 0.07 km3 during Penultimate Glaciation, early stage of Last Glaciation, and late stage of Last Glaciation, respectively. The ELAs of Penultimate Glaciation, early stage of Last Glaciation, and late stage of Last Glaciation were 3 132 m, 3 776 m, and 3 927 m, which were reduced by 1 716 m, 1 071 m, and 920 m, respectively, compared with the modern ELAs. Scale of the glacier was affected by both temperature and precipitation. The large drop (8~12 ℃) in temperature in MIS 6 was the cause of the largest glacier. The precipitation in MIS 4 was about 80% of the current value, but the temperature drop (6~7 ℃) was smaller than Penultimate Glacial Period, so the glacier scale was smaller than that of Penultimate Glacial Period. The precipitation in MIS 2 was only 60%~80% of the present, and the temperature drop (4~8 ℃) was not large, so the glacier scale was the smallest.
Since 1990s, Chinese glaciers have shown a trend of comprehensive and accelerated retreat affected by global warming. Changes in the temporal and spatial distribution of water resources and the water cycle process caused by glacier changes will undoubtedly have a profound impact on the social and economic development of western China, especially in the arid regions of Northwest China. In order to slow down the rate of glacier melting and improve China’s ability to adapt to climate warming, the author’s team carried out a series of experimental studies on artificially slowing glacier melting. Specifically, from August 5 to October 17, 2020, the Dagu 17 Glacier was used as the research target to conduct manual intervention to slow down glacier ablation. The surface of the glacier was covered with a photothermal barrier, the geotextile fabric, and the glacier ablation in the test area and the non-test area was observed. The results showed that during the test period, the glacier ablation rate in the test area was 0.011 m w.e.?d-1, compared to 0.017 m w.e.?d-1 in the non-test area; the 500 m2 geotextile fabric reduced the total ablation in the Dagu Glacier test area by 34% and reduced 204 m3 w.e. glacier ablation; while installing a photothermal barrier cover can effectively slow down glacier ablation, considering the cost, environmental, and labor constraints, this method could be promoted only to the minor glaciers or glacier landscapes in the northwest. Our test of slowing down glacier ablation by artificial intervention has to some extent filled the gap in China’s engineering efforts in response to glacier ablation and laid the foundation for subsequent engineering-based glacier ablation slowdown tests. However, our research is still in the starting stage yet and more controlled tests are needed to validate its effectiveness on a larger spatiotemporal scale in the future.
Accurate simulation of permafrost hydrothermal process is of great significance for understanding and predicting the impact of cryosphere changes on water resources and ecology, in which thermal conductivity and unfrozen water are two key parameters in permafrost hydrothermal simulation. On the basis of VIC-CAS model, this study attempts to replace the thermal conductivity and unfrozen water algorithm in VIC-CAS model with the thermal conductivity algorithm of EBM and unfrozen water algorithm of CLM 5.0, respectively, and carries out the numerical simulation contrast experiment using the observation data of Tuotuohe station in the source region of the Yangtze River, and analyzes the influence of different thermal conductivity and unfrozen water algorithms on the simulation of soil layered temperature and humidity. The results show that the EBM thermal conductivity algorithm is better than the original algorithm in simulating the temperature of shallow soil, but worse in deep soil; The improvement of the shallow soil moisture simulation is not obvious, and it becomes worse in the deep soil. CLM 5.0 unfrozen water algorithm has little influence on soil temperature simulation, and soil moisture simulation becomes worse in shallow soil, but it is better than the original algorithm in deep soil. The comparative experiments of the two algorithms in this study provide a reference for further improving the algorithm of frozen soil hydrothermal process in VIC-CAS model.
As a new discipline, the cryospheric science is prone to misuse of some terminology in manuscripts by scholars and media workers due to interdisciplinary, rapid integration and development, and improper translation of foreign words. Accurate use and correct understanding of cryosphere terminology are the basis for the development of the discipline, and it is also the premise for the popularization of this discipline.In the process of long-term review of manuscripts and reading relevant scientific and technological news, the author often finds the phenomenon of misuse of cryosphere terminology. Combined with the recent hot topics on terminology in the WeChat Group of the Chinese Society of Cryosphere Science, it is considered necessary to further analyze some commonly used terminology.Therefore, based on the authoritative reference books of cryospheric science:Glossary of Cryospheric Science (revised edition), English-Chinese Dictionary of Cryospheric Science (revised edition), and the interpretation ofrelevant authoritative scholars and experts.This paper gives the correct name, english translation and analysis of the misused terminology in cryospheric science. It is expected to comprehensively improve the academic and professional quality of relevant scholars and promote the rapid development of the discipline.
