


0 引言
IPCC指出,大气温室气体浓度已达到过去80万年以来的最高水平,全球地表及浅层海水的温度迅速升高,海平面也加速上升[9]。气候变暖对冰冻圈的影响最为显著[10]。近20年来,冰盖的冰储量持续减少,冰川普遍退缩,冻土层厚度逐渐减薄[9]。在冰川加速消融背景下,夹带着泥沙的融水径流向下游输送了大量的生物活性元素(如Si、C、Fe、N和P),当这些元素进入水库、湖泊和海洋后[7]会影响生态系统和生物地球化学循环[11-21]。活性Si元素可被硅藻等硅质海洋生物吸收利用并形成细胞结构,细胞死亡后将Si沉降到海底参与Si的生物地球化学循环过程(图1);硅藻的呼吸作用会固定大气CO2,因此活性Si的增加会促进硅藻繁殖、影响海洋初级生产力和全球碳循环,进而对气候变化产生反馈作用[22-27]。近期研究表明,冰川很可能是海洋中生物活性Si的重要来源之一[19]。与其他来源相比,冰川Si的活性高,很可能是海洋初级生产力的重要限制因子[28-29]。随着气候持续变暖,从冰川中释放的Si大大增加,进而可能显著影响下游生态系统和碳循环,最终影响气候变化。然而,已有研究主要关注可被生物直接利用的可溶性Si(DSi,Dissolved Si)、忽视了悬浮泥沙附着的颗粒态Si(ASi,Amorphous Si)的输出潜力和贡献,因此大大低估了冰川Si的释放率及其对Si循环的影响,导致针对Si循环收支平衡的重建研究具有较大误差[5,30-31]。此外,Si稳定同位素比率(δ30Si)是一种重要工具,可用于追踪Si的来源、迁移转化和沉积等循环过程,可为现代及历史时期的生物地球化学循环过程研究提供可靠资料[7]。
图1
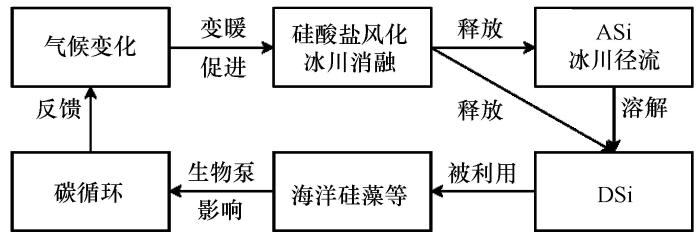
图1
冰川消融与生态系统和碳循环的关系
Fig.1
Relationship between glacier melt and aquatic ecosystems and carbon cycle
涉及冰川Si的研究始于20世纪90年代。初期关注流域硅酸盐的风化机制及其对溶质释放的影响,同时指出硅酸盐风化可能影响万年尺度上的碳循环[22,32-40]。本世纪以来开始关注冰川消融对Si浓度/通量及δ30Si的影响。随着研究的深入,逐渐认识到冰川在Si循环中的角色可能比以前认为的更加重要。随着δ30Si测定技术的发展,Si循环研究也相继展开,目前已获得一些岩芯、基岩及径流的δ30Si资料,同时指出冰川可能影响δ30Si的时空分布并提出了可能的影响机理[7,13,20,41-44]。然而,专门针对冰川Si的监测研究仍较少,主要集中在格陵兰冰盖和一些冰川流域[19,40,44-46],已有资料的时间和空间连续性非常不足。本文综述了冰川径流中各种形态Si浓度/通量及δ30Si的数量级,对比分析了各形态Si浓度/通量及δ30Si的空间变化特征,并指出了存在的问题与亟待加强的研究方向。
1 研究方法回顾
1.1 实验分析方法
冰川径流中的Si(简称冰川Si)由DSi和ASi组成。DSi是过滤后滤液中包含的Si,ASi是滤膜附着的泥沙中包含的Si。研究方法一般包括样品采集、实验分析和数据处理。
(2)实验分析。通常应用流动注射分析仪、原子吸收分光光度计、电感耦合等离子体质谱仪和直读光谱仪等测定Si浓度[19,25,34-35,39,43,46,48-51]。一般用标准钼酸比色法[44,47]和分光光度计法[23,52]测定DSi浓度。在测定ASi之前需要对样品预处理和碱性提取。一般步骤为:先将样品风干,后称取定量样品并装入HDPE瓶中,随后加入Na2CO3溶液,接着在水浴中加热,然后在不同时段移取定量溶液并分别置于微量离心管中,最后冷藏保存;实验分析时,先移取定量冷藏溶液至离心管中,再加入盐酸溶液稀释并中和多余的碱溶液[19,24,44]。Si的稳定同位素有28Si、29Si和30Si[53],其稳定同位素比率常用δ30Si表示,计算公式为δ30Si样品=[(30Si/28Si)样品/(30Si/28Si)标准-1]×1000,这里的标准为国际标准物质NBS-28[44,54-55]。常用高分辨率多接收电感耦合等离子体质谱仪(如Nu Plasma HR-MC-ICP-MS)的干燥等离子模式测定DSi(δD30Si)和ASi(δA30Si)的Si同位素[13,56-59]。在测定δA30Si之前要对样品进行预处理:先称取定量样品并置于层流罩中风干,然后在风干样品中加入NaOH溶液并在水浴中持续加热,随后向加热的溶液中加入硝酸,最后将混合溶液稀释-过滤-离心分离[44]。
(3)数据处理。冰川径流中DSi和ASi平均浓度与年通量、δ30Si平均值的计算方法一般为算数平均或流量加权平均,冰川流域DSi和ASi的年产量则根据年通量与流域面积获取。
1.2 资料获取方法
文献查阅主要有两种查阅方式:(1)找到目前最新发表、相关性最高的文章,再从这些文章的参考文献中查找可能相关的文献。(2)主要从Research Gate、中国知网、Science Direct、Springer等数据库搜索关键词“冰川”、“冰川径流”、“冰川融水”、“Si”、“Si同位素”。通过两种方式共查阅了约200篇文献,其中有冰川径流中DSi浓度资料的文献有33篇,然而有ASi和Si同位素资料的文献仅各3篇,且均为近五年新发表的文献。
从查阅的文献中收集并整理了全球冰川径流中DSi和ASi的浓度、通量与产量数据,方法如下:(1)文献中已给出的浓度、通量与产量数据不进行其他处理(单位换算除外)。(2)对于单个冰川,径流中浓度资料的样品获取地点应尽可能靠近冰川末端,舍去距离冰川末端太远的资料;若通量和产量知其一且已知流域面积,则根据“通量=产量×面积”这一关系得到未知的通量或产量数据;若已知浓度与径流量,则根据“通量=浓度×径流量”得到通量数据。(3)区域/全球平均浓度/产量及其标准偏差由区域/全球范围内已有资料冰川径流中Si浓度/产量计算均值和标准偏差得到。
2 研究动态
2.1 硅浓度和通量研究
目前,涉及DSi的研究区主要集中在格陵兰冰盖、冰岛、斯瓦尔巴、斯堪的纳维亚、阿拉斯加、欧洲中部、加拿大北极、加拿大西部/美国、南极/亚南极和亚洲流域,涉及ASi的研究集中在格陵兰冰盖流域且资料较少(图2)。
图2
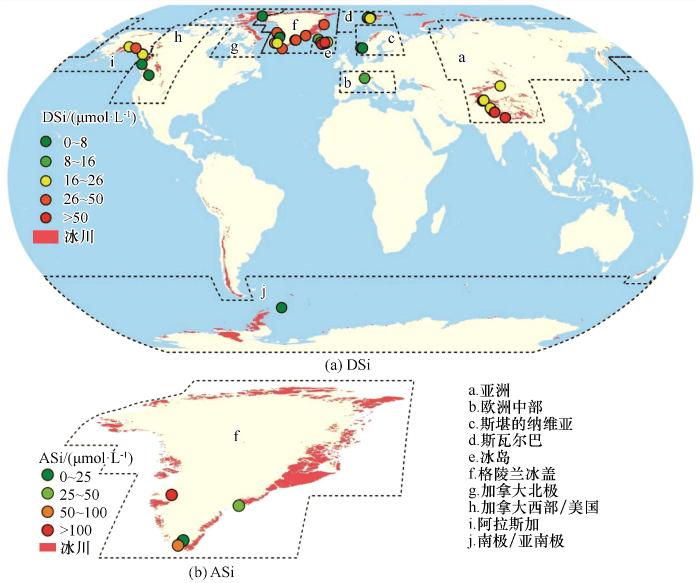
图2
全球冰川Si监测点的空间分布以及径流中DSi(a)和ASi(b)浓度的空间变化(DSi资料来源见附表1,ASi资料引自Hawkings等[19,23,66])
Fig.2
Spatial distribution of monitoring points about Si, and mean concentrations of dissolved Si (a) and amorphous Si (b) from glacial runoff globally (datas of dissolved Si are shown in Supplement table 1, amorphous Si are from Hawkings et al[19,23,66])
冰山的DSi和ASi资料都仅分布在格陵兰冰盖周围。数据显示冰山中DSi和ASi的平均浓度分别为8.0 μmol∙L-1(<0.02~20 μmol∙L-1)和49.2 μmol∙L-1(47.9~50.5 μmol∙L-1)(附表1~2),可见ASi浓度显著大于DSi浓度,可能是冰山中DSi的溶解度小造成的。冰山中的DSi浓度很低,如2014年Godthåbs峡湾冰山的浓度低于0.02 μmol∙L-1[60],其他一些冰山的DSi浓度甚至可能低于仪器检测限[19,61]。此外,富含泥沙的冰山中DSi浓度会显著大于洁净冰山[19]。由格陵兰冰盖周围冰山的DSi和ASi平均浓度以及年径流量(612 km-3∙a-1)[62],得到冰山的DSi和ASi通量分别为0.05×10⁵ mmol∙a-1和0.03×10⁶ mmol∙a-1[19]。根据冰山周周叶绿素浓度的分布和南大洋冰山底部硅藻群落的分布,已有研究发现冰山也是海洋中ASi的重要来源之一[19,63]。
附表1 全球冰川径流中DSi和ASi的平均浓度(标准偏差)和通量及其变化范围 (注:N/A指没有数据;1 Mmol=106 mol;a选自C组数据,b选自附件资料,c取“N”冰川末端的资料,d指平均浓度与年径流量的乘积获得的通量,e指流量加权平均浓度,f选自Sveðja位置的资料,g选自表4中主要融水的资料,h选自USS(上游采样点)的资料,i取自采样点E的资料,j指Si的产量与流域面积的乘积获得的通量,k指Q1和Q2采样点资料的平均值,l选取表1中冰下径流资料,m选取表1中冰下径流2和冰下径流4的资料,n选取R10和R11采样点资料,o选取G1站点的资料;GP指格陵兰冰盖,IC指冰岛,SJ指斯瓦尔巴德,SC指斯堪的纳维亚,AL指阿拉斯加,CE指欧洲中部,AN指南极/亚南极,AC指加拿大北极,WCU指加拿大西部/美国,AS指亚洲;NC指硝酸纤维素膜,CA指醋酸纤维素膜,PVDF指聚偏氟乙烯膜,PC指聚碳酸酯膜,NF指尼龙膜,CE指纤维素酯膜,MC指纤维素膜,GF指玻璃纤维素膜。)
Attached table
| 冰川名称 | 面积/km2 | 流量/(km3∙a-1) | 采样时间 (年/月) | 滤膜 类型 | 孔径/μm | 样品数/个 | DSi浓度(SD)/(μmol∙L-1) | 变化范围/(μmol∙L-1) | DSi通量(SD)/(Mmol∙a-1) | 变化范围/(Mmol∙a-1) | 文献 来源 |
|---|---|---|---|---|---|---|---|---|---|---|---|
| Kennicott冰川AL) | 914 | 2.2 | 1999/6-8 | N/A | 0.45 | N/A | 33 (N/A) | 21~46 | 72.6 (N/A) | 46.2~101.2 | [18] |
| Damma冰川(CE) | 10.7 | N/A | 2008/5-10 | NF | 0.20 | 12 | 15i (N/A) | 5.7~35.2i | 0.35j (N/A) | N/A | [19] |
| Tuva冰川(AN) | 1.01 | 0.535 | 2003/10-2004/3 | NC | 0.45 | >60 | 6.68k (N/A) | 5.1~9.7k | N/A | N/A | [20] |
| John Evans冰川(AC) | N/A | N/A | 1994/6-8 | NC | 0.45 | 38 | 4.3l (N/A) | N/A | N/A | N/A | [21] |
| South Cascade冰川(WCU) | 6.14 | N/A | 1992/8 | CA | 0.22 | <100 | 5.2m (N/A) | 4.3~6.1m | 0.26d (N/A) | 0.22~0.3j | [22] |
| Berendon冰川(WCU) | 53 | N/A | 1975/7-8 | N/A | 0.45 | 2 | 3.4n (N/A) | 3.2~3.7n | N/A | N/A | [23] |
| B&B冰川(AS) | 242 | 0.75 | 2015/5-6 | CE | 0.45 | 8 | 25 (3.6) | N/A | 18.8 (2.7) | 21.5~16.1 | [24] |
| Passu冰川(AS) | 73 | 0.22 | 2015/5-6 | CE | 0.45 | 8 | 10.7 (3.6) | N/A | 2.4 (2.7) | 3.2~1.6 | [24] |
| Hinarchi冰川(AS) | 65 | 0.21 | 2015/5-6 | CE | 0.45 | 7 | 25 (3.6) | N/A | 5.3 (2.7) | 4.5~6.1 | [24] |
| Gulmit冰川(AS) | 16 | 0.13 | 2015/5-6 | CE | 0.45 | 8 | 17.9 (3.6) | N/A | 2.3 (2.7) | 1.8~2.8 | [24] |
| Bara Shigri冰川(AS) | 131 | N/A | 2011/8-9 | MC | 0.45 | 19 | 17.9 (3.34) | 11~25.3 | N/A | N/A | [25] |
| Bara Shigri冰川(AS) | 131 | N/A | 2012/7-9 | MC | 0.45 | 20 | 10.1 (1.46) | 6.49~13.9 | N/A | N/A | [26] |
| Bara Shigri冰川(AS) | 131 | N/A | 2013/6-9 | MC | 0.45 | 15 | 8.99 (1.05) | 7.42~11.2 | N/A | N/A | [26] |
| Batal冰川(AS) | 16 | N/A | 2014/8-9 | MC | 0.45 | 24 | 11 (1.44) | 8.58~13.6 | N/A | N/A | [27] |
| Batal冰川(AS) | 16 | N/A | 2015/9, 2017/6-7 | MC | 0.45 | 61 | 14.7 (3.1) | 6.78~20.6 | N/A | N/A | [28] |
| Bilare Banga冰川(AS) | 8.54 | N/A | 2017/消融期 | N/A | 0.45 | N/A | 20.55 (4.2) | 14.6~25.8 | N/A | N/A | [29] |
| Dudu冰川(AS) | 1.58 | N/A | 1997/6-10 | N/A | 0.45 | 24 | 36 (9.7) | 21.3~56.9 | N/A | N/A | [30] |
| Chhota Shigri冰川(AS) | 34.7 | N/A | 2003/9-10 | MC | 0.45 | 40 | 48 (9) | 34~85 | N/A | N/A | [31] |
| Chhota Shigri冰川(AS) | 34.7 | N/A | 2004/9-10 | MC | 0.45 | 40 | 67 (8) | 44~86 | N/A | N/A | [31] |
| Chhota Shigri冰川(AS) | 34.7 | N/A | 2005/9-10 | MC | 0.45 | 40 | 62 (7) | 45~75 | N/A | N/A | [31] |
| Chhota Shigri冰川(AS) | 34.7 | N/A | 2006/9-10 | MC | 0.45 | 40 | 37 (9) | 15~57 | N/A | N/A | [31] |
| Chhota Shigri冰川(AS) | 34.7 | N/A | 2007/9-10 | MC | 0.45 | 40 | 34 (8) | 11~54 | N/A | N/A | [31] |
| Chhota Shigri冰川(AS) | 34.7 | N/A | 2008/8-10 | N/A | 0.45 | 63 | 71.8 (47.6) | 0.94~160 | N/A | N/A | [32] |
| Chhota Shigri冰川(AS) | 34.7 | N/A | 2009/8-10 | N/A | 0.45 | 118 | 33.4 (18.7) | 3.2~57.3 | N/A | N/A | [32] |
| Patsio冰川(AS) | N/A | N/A | 2010/9 | N/A | 0.45 | 24 | 15.5 (2.6) | 11.6~19.9 | N/A | N/A | [33] |
| Chhota Shigri冰川(AS) | 34.7 | N/A | 2011/9 | N/A | 0.45 | 28 | 20.2 (2.33) | 15.3~24.3 | N/A | N/A | [33] |
| Chhota Shigri冰川(AS) | 34.7 | N/A | 2012/9 | N/A | 0.45 | 20 | 21.1 (7) | 8.0~29.9 | N/A | N/A | [33] |
| Chaturangi冰川(AS) | 67.7 | N/A | 2008/8-9 | N/A | 0.45 | 14 | 62.9 (18) | 35.4~92.6 | N/A | N/A | [34] |
| Gangotri冰川(AS) | 513 | N/A | 2007/7-9 | N/A | 0.45 | 52 | 64 (23) | 21~139 | N/A | N/A | [35] |
| 天山1号冰川(AS) | 3.34 | N/A | 1997/4-6 | GF | 1.00 | 38 | 22.58o (N/A) | N/A | N/A | N/A | [36] |
对DSi的研究广泛分布在格陵兰冰盖,对ASi的研究较少且集中分布在格陵兰冰盖,南极冰盖的研究极少(图2)。格陵兰冰盖径流中的DSi平均浓度为27.7 μmol∙L-1,显著大于冰山(8.0 μmol∙L-1);其中格陵兰Russell冰川流域的DSi浓度最小(5.5 μmol∙L-1),Kuannersuit冰川流域的DSi浓度最大(114 μmol∙L-1)(附表1~2)。DSi浓度具有季节变化:在冰川消融初期(5月初),径流主要(>49%)源于“慢速流”,这时DSi浓度较高;到5月末,随着“慢速流”比例(12%~36%)减小,DSi浓度相应减小且变化范围增大;到7月份,由于径流主要来自冰面且“慢速流”比例(<18%)继续减小,此时的DSi浓度更低[35]。Aciego等[25,64-65]发现,与北大西洋表层水相比,冰川径流中较高的DSi浓度可能与气候变暖导致的冰川径流增加有关。DSi浓度具有空间变化,不同的采样位置浓度会有显著差异:由于冰下水-岩作用强烈,冰下的DSi浓度比冰川河水中的浓度要大[24,32,36]。比如,南极Whillans冰下湖中的DSi浓度为130~210 μmol∙L-1[39],大于全球大多数冰川径流(附表1)。此外,Meire等[46]发现冰川融水进入峡湾会增大表层水的DSi浓度,富氮的深层水上涌会改变Si/N的比例,从而会提高下游硅藻等浮游植物的初级生产力。格陵兰冰盖径流中的ASi平均浓度为145.9 μmol∙L-1(9.87~392 μmol∙L-1),溢出冰川的ASi浓度显著大于冰山(49.2 μmol∙L-1),这种差异与单位质量泥沙中ASi的含量密切相关[45]。对比溢出冰川中的DSi和ASi浓度,发现ASi浓度显著大于DSi。然而,Kiattuut Sermiat冰川冰下径流中的DSi浓度(22.2 μmol∙L-1)大于ASi的浓度(9.87 μmol∙L-1)[55],这可能与该冰川流域冰下化学风化作用较弱有关。
格陵兰冰盖流域的DSi平均通量变化范围为0.09~660 mmol∙a-1,显著大于冰山;区域内最大、最小DSi通量相差4个数量级(附表1)。不同来源融水对DSi通量的贡献不同,如Godthåbs峡湾冰面融水、冰下融水和冰山的DSi通量分别为825 mmol∙a-1、130 mmol∙a-1和93 mmol∙a-1,说明DSi主要来自冰面融水且冰川融水(冰面融水+冰下融水)的DSi通量远大于冰山[46]。Hawkings等[19,46,62]基于2012年Leverett冰川的中值浓度(21.2 μmol∙L-1)和模拟径流量(437 km3∙a-1),估算得到格陵兰和南极冰盖的DSi通量相当,均为0.01×10⁶ mmol∙a-1,可与北极一些大河的DSi通量相比较。比如,格陵兰及南极冰盖的DSi通量与西伯利亚的Mackenzie河相当(0.02×10⁶ mmol∙a-1)[67]。随着气候持续变暖,冰川径流及其输送的DSi通量增大,预计21世纪末全球冰川释放的DSi通量增加20%~160%[44]。据估算,格陵兰和南极冰盖的ASi通量分别为0.16×10⁶ mmol∙a-1和0.01×10⁶ mmol∙a-1[19]。发现格陵兰冰盖的ASi通量是DSi通量的十几倍,说明格陵兰冰盖径流主要以ASi的形式输出Si元素。冰盖的Si通量(DSi+ASi,约0.2×10⁶ mmol∙a-1)与大气沉降(0.5×10⁶ mmol∙a-1)、地下水(0.6×10⁶ mmol∙a-1)和深海热液(0.6×10⁶ mmol∙a-1)的通量相当,约占陆源输入量的3%、入海总量的1.8%[19,31]。模型(ICE-6G_C)模拟结果显示,在较大时间尺度上,间冰期的Si输出量可能会更大;格陵兰冰盖流域在末次间冰期输入到海洋的Si通量可达5.5×10⁶ mmol∙a-1,这与古河流的输出量(5.5×10⁶~5.8×10⁶ mmol∙a-1)相当[19]。在气候持续变暖背景下,入海Si通量增大会影响全球Si循环,因此在建立全球Si收支平衡时应考虑冰川的重要性[19,30-31,68]。格陵兰冰盖流域的DSi平均产量的变化范围为195~9 180 kg∙km-2∙a-1(附表1),Leverett冰川流域的ASi产量为3.6×10⁴ kg∙km-2∙a-1[44]。DSi产量可能主要与流域气候和基岩性质相关。
在冰川流域(冰岛、斯瓦尔巴、斯堪的纳维亚、阿拉斯加、欧洲中部、加拿大北极、加拿大西部/美国、亚洲),径流中DSi浓度的相关研究较粗浅,大多只是列出数据,且暂未发现ASi的相关研究报道。收集的资料显示,这些流域冰川径流中的DSi浓度较大,平均浓度为26.5 μmol∙L-1(3.03~94.8 μmol∙L-1),略小于冰盖(27.7 μmol∙L-1)、但显著大于冰山(8.0 μmol∙L-1);其中,斯瓦尔巴Ebbabreen冰川的DSi浓度最小(3.03 μmol∙L-1),冰岛Solheimajokull冰川最大(94.8 μmol∙L-1)。冰川的DSi平均通量变化范围为0.03~72.6 mmol∙a-1,最大、最小通量相差3个数量级;产量变化范围为57~4 025 kg∙km-2∙a-1(附表1)。
值得注意的是,DSi和ASi并不相互孤立,两者可以互相转化。冰川消融会促进基岩风化,但风化释放的ASi结构松散且含水量高[2,38,68-72]。虽然ASi的生物活性不高,但其溶解会释放DSi[31,73-74];在低温环境下,弱碱性水体中ASi的溶解度远大于淡水且在河口的溶解速率更快[19,69,75]。冰川源ASi易溶解的原因为:冰川侵蚀会破坏矿物结构、降低ASi的化学稳定性[69-70,76];实验提取的ASi就是泥沙中化学性质活跃的Si[19];碱金属和碱土金属会促进ASi溶解[77]。此外,DSi的生物利用过程也会促进ASi溶解,底栖生物也会分解泥沙并将Si等营养物质运输回透光带,这可能会影响更长时间尺度上的Si循环[31,73-74]。
综上所述,就DSi平均浓度的空间分布而言,在全球尺度上,DSi浓度的大小次序为冰盖>冰川>冰山,DSi的产量为冰川>冰盖(附表2)。冰盖的DSi浓度稍大于冰川,可能与冰盖下部玄武岩的广泛分布有关[46];冰川的DSi浓度也较大,说明冰川区基岩风化对DSi的贡献大;冰山的DSi浓度最小,这与冰山的含沙量较低有关[19]。由于冰川分布区域广,不同流域间的气候和基岩组成以及消融强度等的差异显著,因而冰川的DSi变化范围较大;对于冰盖,底部的侵蚀作用会导致输出的DSi浓度增加。冰川的DSi产量大于冰盖,说明冰川的侵蚀风化作用整体上强于冰盖。在区域尺度上,冰岛冰川的DSi平均浓度最大、加拿大北极和加拿大西部/美国冰川最小,相差1个数量级;冰岛较高浓度的DSi可能与玄武岩的广泛分布且风化效率较高有关[68]。格陵兰冰盖DSi的变化范围最大,加拿大西部/美国冰川最小;亚洲和格陵兰冰盖流域的DSi变化范围明显大于其他流域,很可能与这两个流域的数据密集有关(附表2)。亚洲冰川的DSi平均产量最大、斯瓦尔巴冰川最小,二者相差2个数量级(附表2)。亚洲较高的DSi产量可能与所在流域的降水量大、气温高且化学风化强度高有关[78],斯瓦尔巴较低的DSi产量与气温和化学风化速率均较低有关。在流域尺度上,格陵兰Kuannersuit冰川的DSi平均浓度最大、斯瓦尔巴Ebbabreen冰川最小,二者相差2个数量级;格陵兰Godthåbs峡湾的DSi产量最大、斯瓦尔巴Scott Turnerbreen冰川最小,亦相差2个数量级(附表1)。亚洲南部冰川的DSi浓度较大[图2(a)],这可能与降水较多且侵蚀作用较强有关[78]。格陵兰西部冰川的DSi平均浓度大于东部冰川,这可能与大气环流和东/西海岸的洋流影响有关[79]。其他流域之间的DSi浓度没有明显的空间变化规律。就ASi平均浓度的分布而言,现有资料仅限于格陵兰冰盖的个别流域,不具有空间分析价值,故不作讨论。
附表2 全球不同冰川区DSi的平均浓度(标准偏差)及平均产量(数据来源见附表1)
Attached table
| 地区 | DSi浓度/(μmol∙L-1) | DSi产量/(kg∙km-2∙a-1) |
|---|---|---|
| 亚洲 | 31.55(20.3) | 2 351 |
| 冰岛 | 46.9(31.1) | N/A |
| 斯瓦尔巴 | 6.8(7.0) | 57 |
| 斯堪的纳维亚 | 14.1(11.2) | N/A |
| 阿拉斯加 | 21.5 6.8) | 2 224 |
| 欧洲中部 | 15.0(N/A) | 916 |
| 加拿大北极 | 4.3(N/A) | N/A |
| 加拿大西部/美国 | 4.3(1.3) | 1 177 |
| 格陵兰 | 26.7(22.8) | 980[10] |
| 南极/亚南极 | 6.7(N/A) | N/A |
| 全球(冰川) | 26.5(21.7) | 1 722 |
| 全球(冰盖) | 27.7(22.5) | 980[10] |
| 全球(冰山) | 8.0(2.8) | N/A |
冰川Si的浓度的空间变化很大,这与采样方法、径流量和基岩类型等因素有关:
(1)采样方法。采样点的选择及其距冰川的远近会导致Si浓度的差异,这主要与融水的稀释作用、河道内Si的迁移转化和其他源的贡献有关。采样季节及频率会影响Si浓度,原因为Si浓度的季节变化比较明显。采样后的过滤操作也会影响Si浓度,这主要与过滤与采样的间隔时间、滤膜孔径及材质有关。推测不同材质的滤膜也会引起Si浓度的差异,目前尚未见报道。
(3)基岩特征。基岩是影响Si浓度的重要因子,原因为不同基岩的物理化学性质和风化效率有较大差异。比如,花岗岩和片麻岩流域的DSi浓度低,玄武岩流域的DSi浓度高[50]。
2.2 硅同位素研究
图3
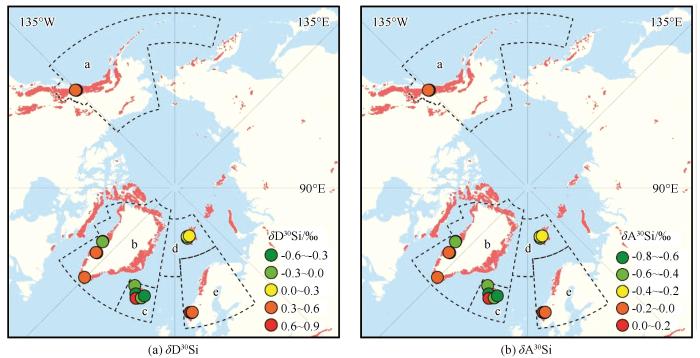
图3
全球冰川径流中δD30Si和δA30Si的空间变化。a指阿拉斯加,b指格陵兰冰盖,c指冰岛,d指斯瓦尔巴,e指斯堪的纳维亚(数据来源见附表3)
Fig.3
Spatial distribution and mean values of δD30Si (a) and δA30Si (b) from glacial runoff globally. a refers to Alaska, b refers to Greenland Ice Sheet, c refers to Iceland, d refers to Svalbard, e refers to Scandinavia (datas are shown in Supplement table 3)
冰岛、斯瓦尔巴、斯堪的纳维亚和阿拉斯加流域冰川径流中δD30Si一般大于δA30Si,与格陵兰冰盖一致,这说明基岩风化和溶解-沉降过程引起了同位素分馏[44,80-82]。尽管地理位置和风化壳组成差异显著,但风化条件造成的δ30Si分馏最为重要[48,83-84]。基于同位素分馏模型,基岩风化速率与δD30Si负相关且δD30Si会随冰川覆盖度而变化,说明现代和冰期-间冰期尺度上的气候变化会影响陆源的δ30Si[13]。此外,冰川径流的δ30Si小于非冰川径流,非冰川径流的δ30Si值与基岩接近[15,45,74,85-88];冰期的δ30Si小于间冰期,说明冰川变化会影响δ30Si的时空分布[42,44]。现代海洋的δD30Si呈增大趋势,可能与末次冰期以来冰川径流增加有关[7,55]。
在全球尺度上,冰川和冰盖的δD30Si平均值分别为0.225‰和0.036‰、δA30Si平均值分别为 -0.4‰和-0.673‰(附表4),δD30Si的变化范围分别为-0.58‰~0.78‰和-0.36‰~0.41‰、δA30Si的变化范围分别为-0.86‰~-0.05‰和-0.67‰~0.467‰。在区域尺度上,阿拉斯加冰川的δD30Si平均值最大、格陵兰冰川最小,冰岛冰川的δA30Si平均值最大、阿拉斯加冰川最小(图3)。冰岛冰川的δD30Si变化范围最大、斯瓦尔巴冰川最小,斯堪的纳维亚冰川δA30Si的变化范围最大、格陵兰冰川最小(附表4)。δD30Si变化范围的差异可能与数据量的多少有关。在流域尺度上,冰岛Soheimajokull冰川的δD30Si最大、Langjokull冰川最小,二者相差1.36‰;冰岛Eyjabakkajokull冰川的δA30Si最大、阿拉斯加Lemon冰川最小,二者相差0.43‰(附表3,图3)。D30Si的变化范围大于δA30Si,这可能与δD30Si的分馏过程先于δA30Si有关,具体机理还不清楚。引起δD30Si和δA30Si差异的原因尚不清楚。可见,冰川δ30Si的空间变化大,这可能与排水系统、水文路径、水体滞留时间、流域规模(冰川覆盖度)及采样方法等因素有关,还有待进一步研究[40,44-45,84,89]。
附表3 全球冰川径流中δD30Si和δA30Si平均值(标准偏差)及变化范围
Attached table
| 冰川 | 面积/km2 | 采样时间/ (年/月) | 样品数/个 | δD30Si/‰ | 变化范围/‰ | δA30Si/‰ | 变化范围/‰ | 文献来源 |
|---|---|---|---|---|---|---|---|---|
| Kiattuut Sermiat冰川(GP) | 36 | 2013/4-8 | 18 | 0.41a (0.10) | 0.16~1.01 | -0.44a (0.06) | -0.56~-0.38 | [12] |
| Leverett冰川(GP) | 600 | 2015/5-7 | 20 | -0.25a (0.12) | -0.55~0.87a | -0.22a (0.06) | -0.32~0.21 | [12] |
| “Disko 6”冰川(GP) | 1.5 | 2015/8 | 1 | 0.22b (N/A) | N/A | -0.55 (N/A) | N/A | [6] |
| “Disko 11”冰川(GP) | 9.7 | 2015/8 | 1 | -0.36b (N/A) | N/A | -0.61 (N/A) | N/A | [6] |
| “Disko 10”冰川(GP) | 7 | 2015/8 | 1 | -0.15b (N/A) | N/A | -0.48 (N/A) | N/A | [6] |
| “Disko 13”冰川(GP) | 18 | 2015/8 | 1 | 0.24b (N/A) | N/A | -0.67 (N/A) | N/A | [6] |
| Kuannersuit冰川(GP) | 103 | 2015/8 | 1 | -0.13b (N/A) | N/A | N/A | N/A | [6] |
| Vatnajokull冰川(IC) | 111 | 2003/9, 2005/8 | 13 | 0.75b (N/A) | N/A | N/A | N/A | [6] |
| Myrdalsjokull冰川(IC) | 122 | 2003/9, 2005/8 | 15 | 0.41b (N/A) | N/A | N/A | N/A | [37] |
| Drangajokull冰川(IC) | 41.9 | 2016/8 | 1 | -0.14b (N/A) | N/A | -0.36 (N/A) | N/A | [6] |
| Langjokull冰川(IC) | 131 | 2016/8 | 1 | -0.58b (N/A) | N/A | -0.10 (N/A) | N/A | [6] |
| Soheimajokull冰川(IC) | 55.1 | 2016/8 | 1 | 0.78b (N/A) | N/A | -0.06 (N/A) | N/A | [6] |
| Skaftrafelljokull冰川(IC) | 90.5 | 2016/8 | 1 | -0.09b (N/A) | N/A | -0.18 (N/A) | N/A | [6] |
| Eyjabakkajokull冰川(IC) | 130 | 2016/8 | 1 | -0.51b (N/A) | N/A | -0.05 (N/A) | N/A | [6] |
| Eagle冰川(AL) | 40.5 | 2017/6 | 1 | 0.33b (N/A) | N/A | N/A | N/A | [6] |
| Herbert冰川(AL) | 61.2 | 2017/6 | 1 | 0.49b (N/A) | N/A | -0.62 (N/A) | N/A | [6] |
| Mendenhall冰川(AL) | 109 | 2017/6 | 1 | 0.59b (N/A) | N/A | -0.54 (N/A) | N/A | [6] |
| Lemon冰川(AL) | 9.53 | 2017/6 | 1 | 0.46b (N/A) | N/A | -0.86 (N/A) | N/A | [6] |
| Austerdalsbreen冰川(SC) | 20.9 | 2016/9 | 1 | 0.63b (N/A) | N/A | -0.34 (N/A) | N/A | [6] |
| Styggedalsbreen冰川(SC) | 2.06 | 2016/9 | 1 | -0.09b (N/A) | N/A | -0.31 (N/A) | N/A | [6] |
| Boverbreen冰川(SC) | 9.58 | 2016/9 | 1 | 0.53b (N/A) | N/A | -0.54 (N/A) | N/A | [6] |
| Nansenbreen冰川(SJ) | 38.1 | 2016/8 | 1 | -0.07b (N/A) | N/A | -0.66 (N/A) | N/A | [6] |
| Sefstrombreen冰川(SJ) | 133 | 2016/8 | 1 | 0.18b (N/A) | N/A | -0.27 (N/A) | N/A | [6] |
| Ebbabreen冰川(SJ) | 1.68 | 2016/8 | 1 | 0.16b (N/A) | N/A | -0.71 (N/A) | N/A | [6] |
附表4 全球不同冰川区δD30Si和δA30Si的平均值(标准偏差)及变化范围(数据来源见附表2)
Attached table
| 地区 | δD30Si/‰ | 变化范围/‰ | δA30Si/‰ | 变化范围/‰ |
|---|---|---|---|---|
| 格陵兰 | 0.036 (0.29) | -0.36~0.41 | -0.467 (0.16) | -0.67~0.467 |
| 冰岛 | 0.089 (0.56) | -0.58~0.78 | -0.150 (0.13) | -0.36~-0.05 |
| 斯瓦尔巴 | 0.090 (0.14) | -0.07~0.18 | -0.547 (0.24) | -0.71~-0.27 |
| 斯堪的纳维亚 | 0.357 (0.39) | -0.09~0.63 | -0.397 (0.13) | -0.54~-0.31 |
| 阿拉斯加 | 0.468 (0.11) | 0.33~0.59 | -0.673 (0.17) | -0.86~-0.54 |
| 全球(冰川) | 0.225 (0.42) | -0.58~0.78 | -0.400 (0.26) | -0.86~-0.05 |
| 全球(冰盖) | 0.036 (0.29) | -0.36~0.41 | -0.467 (0.16) | -0.67~-0.467 |
3 总结和展望
冰川Si是全球Si循环的重要组成部分,对于重建现代和历史时期的气候环境记录、评估冰川影响Si的生物地球化学循环乃至气候变化具有重要意义。空间分析结果表明,冰川径流中的DSi浓度大于冰山,这与冰山中泥沙含量较少有关;溢出冰川径流中ASi的浓度大于DSi,说明格陵兰冰盖主要以ASi的形式输出Si通量。尽管目前已取得一些研究资料和成果,但仍存在较多不足,需加强以下研究:
(1)冰川Si的野外监测急需加强。目前对冰川Si的研究刚刚起步,监测资料稀疏/不连续且监测点的空间分布不均,导致对其时空变化格局及其通量评估等科学问题的研究仍是空白。因此急需在典型冰川流域一个完整消融期内获取各形态Si的高频次、多类型样品,综合分析冰川Si浓度的时间变化过程(日、月和季节)和空间分布特征,有助于深入认识冰川消融与Si释放过程的关联机制。
(2)冰川Si的迁移转化过程研究。冰川输出的Si进入河道以后可能会受吸附、解吸附、沉淀等物理化学作用影响,导致进入下游生态系统的Si数量急剧减小;此外,河道中Si通过河口进入湖泊/海洋生态系统的过程中,水质的改变可能也会导致Si被“清除”。因此,应抓住冰川Si发生明显变化的关键节点,刻画Si在河道内的迁移转化过程和运移规律。
(3)冰川Si的通量变化规律研究。冰川输出的Si会影响下游生态系统的生物群落结构与功能,对冰川Si通量变化规律的研究可以更合理地评估进入下游生态系统的Si数量,并探究不同量级的冰川Si通量水平对生态系统的影响程度,为冰川源Si的重要性评价提供借鉴意义。
(4)冰川Si的来源解析研究。冰川径流中的Si除了来自冰川消融,还可能源于降水、地下水、土壤水等,此外,河道下游数公里乃至更远的河段/湖泊/海洋中是否有冰川Si的输入尚不清楚,为此需要借助同位素手段来识别Si的具体来源和不同源的贡献大小,有助于更好地理解冰川消融影响Si循环的方式、评估冰川在全球Si循环中的重要性。
[1] Azetsu-Scott K, Syvitski J P M. Influence of melting icebergs on distribution, characteristics and transport of marine particles in an East Greenland fjord[J]. Journal of Geophysical Research: Oceans, 1999, 104(C3): 5321-5328.
[2] Meire L, Meire P, Struyf E, et al. High export of dissolved silica from the Greenland Ice Sheet[J]. Geophysical Research Letters, 2016, 43(17): 9173-9182.
[3] Van As D, Andersen M L, Petersen D, et al. Increasing meltwater discharge from the Nuuk region of the Greenland ice sheet and implications for mass balance (1960–2012)[J]. Journal of Glaciology, 2014, 60(220): 314-322.
[4] Hawkings J R, Wadham J L, Benning L G, et al. Ice sheets as a missing source of silica to the polar oceans[J]. Nature Communications, 2017, 8: 14198.
[5] Yde J C, Tvis Knudsen N, Nielsen O B. Glacier hydrochemistry, solute provenance, and chemical denudation at a surge-type glacier in Kuannersuit Kuussuat, Disko Island, West Greenland[J]. Journal of Hydrology, 2005, 300(1-4): 172-187.
[6] Hatton J E, Hendry K R, Hawkings J R, et al. Silicon isotopes in Arctic and sub-Arctic glacial meltwaters: The role of subglacial weathering in the silicon cycle[J]. Nature Communications, 2019, 475(2228): 20190098.
[7] Yde J C, Knudsen N T, Hasholt B, et al. Meltwater chemistry and solute export from a Greenland Ice Sheet catchment, Watson River, West Greenland[J]. Journal of Hydrology, 2014, 519: 2165-2179.
[8] Bhatia M P. Hydrological and biogeochemical cycling along the Greenland Ice Sheet margin[D]. Boston: Massachusetts Institute of Technology, 2012.
[9] Hawkings J R, Wadham J L, Tranter M, et al. The effect of warming climate on nutrient and solute export from the Greenland Ice Sheet[J]. Geochemical Perspectives Letters, 2015, 1: 94-104.
[10] Hawkings J R, Hatton J E, Hendry K R, et al. The silicon cycle impacted by past ice sheets[J]. Nature Communications, 2018, 9(1): 3210.
[11] Aciego S M, Stevenson E I, Arendt C A. Climate versus geological controls on glacial meltwater micronutrient production in southern Greenland[J]. Earth and Planetary Science Letters, 2015, 424: 51-58.
[12] Hatton J E, Hendry K R, Hawkings J R, et al. Investigation of subglacial weathering under the Greenland Ice Sheet using silicon isotopes[J]. Geochimica et Cosmochimica Acta, 2019, 247: 191-206.
[13] Rysgaard S, Vang T, Stjernholm M, et al. Physical conditions, carbon transport, and climate change impacts in a Northeast Greenland Fjord[J]. Arctic, Antarctic, and Alpine Research, 2003, 35(3): 301-312.
[14] Galeczka I, Oelkers E H, Gislason S R. The chemistry and element fluxes of the July 2011 Múlakvísl and Kaldakvísl glacial floods, Iceland[J]. Journal of Volcanology and Geothermal Research, 2014, 273: 41-57.
[15] Hodgkins R, Tranter M, Dowdeswell J A. Solute provenance, transport and denudation in a High Arctic glacierized catchment[J]. Hydrological Processes, 1997, 11(14): 1813-1832.
[16] Rutter N, Hodson A, Irvine-Fynn T, et al. Hydrology and hydrochemistry of a deglaciating high-Arctic catchment, Svalbard[J]. Journal of Hydrology, 2011, 410(1/2): 39-50.
[17] Anderson S P, Drever J I, Frost C D, et al. Chemical weathering in the foreland of a retreating glacier[J]. Geochimica et Cosmochimica Acta, 2000, 64(7): 1173-1189.
[18] Anderson S P, Longacre S A, Kraal E R. Patterns of water chemistry and discharge in the glacier-fed Kennicott River, Alaska: evidence for subglacial water storage cycles[J]. Chemical Geology, 2003, 202(3/4): 297-312.
[19] Hindshaw R S, Tipper E T, Reynolds B C, et al. Hydrological control of stream water chemistry in a glacial catchment (Damma Glacier, Switzerland)[J]. Chemical Geology, 2011, 285(1): 215-230.
[20] Hodson A, Heaton T, Langford H, et al. Chemical weathering and solute export by meltwater in a maritime Antarctic glacier basin[J]. Biogeochemistry, 2010, 98(1): 9-27.
[21] Skidmore M L, Sharp M J. Drainage system behaviour of a High-Arctic polythermal glacier[J]. Annals of Glaciology, 1999, 28: 209-215.
[22] Axtmann E V, Stallard R F. Chemical weathering in the South Cascade Glacier basin, comparison of subglacial and extra-glacial weathering[J]. IAHS Publ., 1995: 431-439.
[23] Eyles N, Sasseville D R, Slatt R M, et al. Geochemical denudation rates and solute transport mechanisms in a maritime temperate glacier basin[J]. Canadian Journal of Earth Sciences, 1982, 19(8): 1570-1581.
[24] Zhang F, Qaiser F U, Zeng C, et al. Meltwater hydrochemistry at four glacial catchments in the headwater of Indus River[J]. Environmental Science and Pollution Research International, 2019, 26(23): 23645-23660.
[25] Singh V B, Ramanathan A L, Kuriakose T. Hydrogeochemical assessment of meltwater quality using major ion chemistry: A case study of Bara Shigri Glacier, Western Himalaya, India[J]. National Academy Science Letters, 2014, 38(2): 147-151.
[26] Singh V B, Ramanathan A L. Assessment of solute and suspended sediments acquisition processes in the Bara Shigri glacier meltwater (Western Himalaya, India)[J]. Environmental Earth Sciences, 2015, 74(3): 2009-2018.
[27] Singh V B, Ramanathan A L. Characterization of hydrogeochemical processes controlling major ion chemistry of the Batal Glacier meltwater, Chandra Basin, Himachal Pradesh, India[J]. Proceedings of the National Academy of Sciences, India Section A: Physical Sciences, 2016, 87(1): 145-153.
[28] Singh V B, Keshari A K, Ramanathan A L. Major ion chemistry and atmospheric CO2 consumption deduced from the Batal glacier, Lahaul–Spiti valley, Western Himalaya, India[J]. Environment, Development and Sustainability, 2019, 22(7): 6585-6603.
[29] Kumar R, Kumar R, Singh A, et al. Hydro-geochemical analysis of meltwater draining from Bilare Banga glacier, Western Himalaya[J]. Acta Geophysica, 2019, 67(2): 651-660.
[30] Ahmad S, Hasnain S I. Chemical characteristics of stream draining from Dudu glacier: an Alpine meltwater stream in Ganga Headwater, Garhwal Himalaya[J]. Journal of China University of Geosciences, 2001, 12: 75-83.
[31] Sharma P, Ramanathan A L, Pottakkal J. Study of solute sources and evolution of hydrogeochemical processes of the Chhota Shigri Glacier meltwaters, Himachal Himalaya, India[J]. Hydrological Sciences Journal, 2013, 58(5): 1128-1143.
[32] Singh V B, Ramanathan A L, Sharma P, et al. Dissolved ion chemistry and suspended sediment characteristics of meltwater draining from Chhota Shigri Glacier, western Himalaya, India[J]. Arabian Journal of Geosciences, 2013, 8(1): 281-293.
[33] Singh V B, Ramanathan A L, Sharma P. Major ion chemistry and assessment of weathering processes of the Patsio glacier meltwater, Western Himalaya, India[J]. Environmental Earth Sciences, 2015, 73(1): 387-397.
[34] Singh V B, Ramanathan A L, Pottakkal J G, et al. Hydrogeochemistry of meltwater of the Chaturangi Glacier, Garhwal Himalaya, India[J]. Proceedings of the National Academy of Sciences, India Section A: Physical Sciences, 2014, 85(1): 187-195.
[35] Singh V B, Ramanathan A L, Pottakkal J G, et al. Chemical characterisation of meltwater draining from Gangotri Glacier, Garhwal Himalaya, India[J]. Journal of Earth System Science, 2012, 121(3): 625-636.
[36] Liu Fengjing, Sun Junying. Hydrochemical process and hydrological separation at the headwaters of the Urumqi River, Tianshan Mountain[J]. Journal of Glaciology and Geocryology, 1999, 21(4): 362-370. [刘凤景, 孙俊英. 中国天山乌鲁木齐河径流分割和水文化学过程[J]. 冰川冻土, 1999, 21(4): 362-370.]
[37] Georg R B, Reynolds B C, West A J, et al. Silicon isotope variations accompanying basalt weathering in Iceland[J]. Earth and Planetary Science Letters, 2007, 261(3/4): 476-490.
参考文献
Silicic acid supplied to coastal diatom communities influences cellular silicification and the potential export of carbon
[J].
Production and dissolution of biogenic silica in the ocean: Revised global estimates, comparison with regional data and relationship to biogenic sedimentation
[J].
Role of increased marine silica input on paleo-pCO2 levels
[J].
Global change. Silica control of carbon dioxide
[J].
Continental erosion and the Cenozoic rise of marine diatoms
[J].
The continental Si cycle and its impact on the ocean Si isotope budget
[J].
The effects of weathering variability and anthropogenic pressures upon silicon cycling in an intertropical watershed (Tana River, Kenya)
[J].
Changes in the mountain cryosphere and their impacts and adaptation measures
[J].
全球山地冰冻圈变化、影响与适应
[J].
Modelled glacial and non-glacial HCO3 -, Si and Ge fluxes since the LGM: little potential for impact on atmospheric CO2 concentrations and a potential proxy of continental chemical erosion, the marine Ge/Si ratio
[J].
Silicic acid dynamics in the glacial sub-Antarctic: Implications for the silicic acid leakage hypothesis
[J].
Silicon isotope variations accompanying basalt weathering in Iceland
[J].
Variable Quaternary chemical weathering fluxes and imbalances in marine geochemical budgets
[J].
Riverine silicon isotope variations in glaciated basaltic terrains: Implications for the Si delivery to the ocean over glacial-interglacial intervals
[J].
The potential role of the Antarctic Ice Sheet in global biogeochemical cycles
[J].
Sources, cycling and export of nitrogen on the Greenland Ice Sheet
[J].
The Greenland Ice Sheet as a hot spot of phosphorus weathering and export in the Arctic
[J].
Ice sheets as a missing source of silica to the polar oceans
[J].
Importance of mountain glaciers as a source of dissolved organic carbon
[J].
Dissolved iron supply from asian glaciers: local controls and a regional perspective
[J].
Weathering, plants, and the long-term carbon cycle
[J].
The effect of warming climate on nutrient and solute export from the Greenland Ice Sheet
[J].
Mid-Pleistocene climate transition drives net mass loss from rapidly uplifting St. Elias Mountains, Alaska
[J].
Climate versus geological controls on glacial meltwater micronutrient production in southern Greenland
[J].
Direct evidence of the feedback between climate and nutrient, major, and trace element transport to the oceans
[J].
Melting glaciers stimulate large summer phytoplankton blooms in southwest Greenland waters
[J].
Phytoplankton growth and microzooplankton grazing along a sub-Arctic fjord (Godthåbsfjord, west Greenland)
[J].
Pelagic primary production during summer along 65° to 72° N off West Greenland
[J].
Rapid erosion beneath the Greenland ice sheet
[J].
The silica balance in the world ocean: a reestimate
[J].
Chemical weathering in glacial environments
[J].
Chemical denudation and silicate weathering in Himalayan glacier basins: Batura Glacier, Pakistan
[J].
Tectonic and climatic controls on silicate weathering
[J].
Evolution of the subglacial drainage system beneath the Greenland Ice Sheet revealed by tracers
[J].
Chemical weathering under the Greenland Ice Sheet
[J].
Meltwater chemistry and solute export from a Greenland Ice Sheet catchment, Watson River, West Greenland
[J].
Clay mineral precipitation and low silica in glacier meltwaters explored through reaction-path modelling
[J].
Solute sources and geochemical processes in Subglacial Lake Whillans, West Antarctica
[J].
Silicon isotopes in Arctic and sub-Arctic glacial meltwaters: the role of subglacial weathering in the silicon cycle
[J].
Controlling the mass bias introduced by anionic and organic matrices in silicon isotopic measurements by MC-ICP-MS
[J].
Southern ocean nitrogen and silicon dynamics during the last deglaciation
[J].
Silicon isotopes indicate enhanced carbon export efficiency in the North Atlantic during deglaciation
[J].
The silicon cycle impacted by past ice sheets
[J].
Investigation of subglacial weathering under the Greenland Ice Sheet using silicon isotopes
[J].
High export of dissolved silica from the Greenland Ice Sheet
[J].
The supply and accumulation of silica in the marine environment
[J].
Hydrological and biogeochemical cycling along the Greenland Ice Sheet margin
[D].
Meltwater hydrochemistry at four glacial catchments in the headwater of Indus River
[J].
Glacier hydrochemistry, solute provenance, and chemical denudation at a surge-type glacier in Kuannersuit Kuussuat, Disko Island, West Greenland
[J].
Amorphous silica analysis in terrestrial runoff samples
[J].
Chemical dissolution techniques in the study of soil clays: Part II
[J].
Silicon isotope study on rice plants from the Zhejiang Province, China
[J].
Silicon isotope systematics of acidic weathering of fresh basalts, Kilauea Volcano, Hawai’i
[J].
A review of the stable isotope bio-geochemistry of the global silicon cycle and its associated trace elements
[J].
Mechanisms controlling the silicon isotopic compositions of river waters
[J].
New sample preparation techniques for the determination of Si isotopic compositions using MC-ICPMS
[J].
Quantifying the impact of freshwater diatom productivity on silicon isotopes and silicon fluxes: Lake Myvatn, Iceland
[J].
Silicon isotope variations in Central Siberian rivers during basalt weathering in permafrost-dominated larch forests
[J].
Seasonal Changes in Fe along a Glaciated Greenlandic Fjord
[J].
Influence of melting icebergs on distribution, characteristics and transport of marine particles in an East Greenland fjord
[J].
Recent large increases in freshwater fluxes from Greenland into the North Atlantic
[J].
Lithium, magnesium and silicon isotope behaviour accompanying weathering in a basaltic soil and pore water profile in Iceland
[J].
Climatic influences on sediment deposition and turbidite frequency in the Nitinat Fan, British Columbia
[J].
The role of the cryosphere in source-to-sink systems
[J].
Biolabile ferrous iron bearing nanoparticles in glacial sediments
[J].
Seasonal and annual fluxes of nutrients and organic matter from large rivers to the Arctic ocean and surrounding seas
[J].
The High Arctic glacial ecosystem: new insights from nutrient budgets
[J].
Quartz dissolution as influenced by pH and the presence of a disturbed surface layer
[J].
Alterations in properties of samples during their preparation by grinding
[J].
Leaching and reconstruction at the surfaces of dissolving chain-silicate minerals
[J].
Unifying natural and laboratory chemical weathering with interfacial dissolution-reprecipitation: a study based on the nanometer-scale chemistry of fluid-silicate interfaces
[J].
Silica and diatom growth in Lough Neagh: the importance of internal recycling
[J].
Iron and manganese speciation and cycling in glacially influenced high-latitude fjord sediments (West Spitsbergen, Svalbard): evidence for a benthic recycling-transport mechanism
[J].
Dissolution of biogenic silica from land to ocean: Role of salinity and pH
[J].
Rock comminution as a source of hydrogen for subglacial ecosystems
[J].
Kinetics of amorphous silica dissolution and the paradox of the silica polymorphs
[J].
Spatiotemporal variations of hydrogeochemistry and its controlling factors in the Gandaki River Basin, Central Himalaya Nepal
[J].
Comparison of 2013 and 2012 Greenland Ice Sheet surface melt and associated mechanisms
[J].
2013和2012年夏季格陵兰岛冰盖表面融化对比及可能的影响机理分析
[J].
Natural variations of δ 30Si ratios during progressive basalt weathering, Hawaiian Islands
[J].
Silicon isotopic fractionation during adsorption of aqueous monosilicic acid onto iron oxide
[J].
Si stable isotope fractionation during adsorption and the competition between kinetic and equilibrium isotope fractionation: implications for weathering systems
[J].
Silicon isotope homogeneity in the mantle
[J].
Silicon isotopes in granulite xenoliths: insights into isotopic fractionation during igneous processes and the composition of the deep continental crust
[J].
Global spatial distribution of natural riverine silica inputs to the coastal zone
[J].
Estuarine removal of glacial iron and implications for iron fluxes to the ocean
[J].
Amorphous silica transport in the Ganges Basin: Implications for Si delivery to the oceans
[J].
Calculating the balance between atmospheric CO2 drawdown and organic carbon oxidation in subglacial hydrochemical systems
[J].

 甘公网安备 62010202000676号