1
2017
... 冰冻圈是世界上许多大江大河的发源地,是干旱区内陆河流域的“水塔”[1 -3 ] .冻土作为陆地冰冻圈的重要组成部分[4 ] ,不仅对寒区水文过程有显著影响[5 -7 ] ,而且对全球气候变化极其敏感[8 -10 ] .冻土本身具有相对隔水层的特点,使地下水文过程更加复杂[11 -14 ] ,进而影响地表水文过程、地-气之间的能量交换和碳循环[15 -18 ] .而冻融循环对寒区水文过程(特别是地下部分)的影响,包括土壤水分的变化[19 ] 、径流路径的变化[20 -21 ] 、地下水的分布[22 -23 ] 以及陆地水储量[24 -26 ] 等.此外,全球气候变暖导致土壤温度升高,多年冻土的退化加剧,季节冻结深度减小,融化深度增大;而地下存储的碳以温室气体的形式被释放到大气中[27 -30 ] ,又对全球变暖产生正反馈[21 ,31 ] .因此,研究寒区土壤水文过程,即土壤水热传输过程,是寒区水文学的关键问题之一. ...
Different glacier status with atmospheric circulations in Tibetan Plateau and surroundings
2012
Importance and vulnerability of the world’s water towers
1
2020
... 冰冻圈是世界上许多大江大河的发源地,是干旱区内陆河流域的“水塔”[1 -3 ] .冻土作为陆地冰冻圈的重要组成部分[4 ] ,不仅对寒区水文过程有显著影响[5 -7 ] ,而且对全球气候变化极其敏感[8 -10 ] .冻土本身具有相对隔水层的特点,使地下水文过程更加复杂[11 -14 ] ,进而影响地表水文过程、地-气之间的能量交换和碳循环[15 -18 ] .而冻融循环对寒区水文过程(特别是地下部分)的影响,包括土壤水分的变化[19 ] 、径流路径的变化[20 -21 ] 、地下水的分布[22 -23 ] 以及陆地水储量[24 -26 ] 等.此外,全球气候变暖导致土壤温度升高,多年冻土的退化加剧,季节冻结深度减小,融化深度增大;而地下存储的碳以温室气体的形式被释放到大气中[27 -30 ] ,又对全球变暖产生正反馈[21 ,31 ] .因此,研究寒区土壤水文过程,即土壤水热传输过程,是寒区水文学的关键问题之一. ...
1
2012
... 冰冻圈是世界上许多大江大河的发源地,是干旱区内陆河流域的“水塔”[1 -3 ] .冻土作为陆地冰冻圈的重要组成部分[4 ] ,不仅对寒区水文过程有显著影响[5 -7 ] ,而且对全球气候变化极其敏感[8 -10 ] .冻土本身具有相对隔水层的特点,使地下水文过程更加复杂[11 -14 ] ,进而影响地表水文过程、地-气之间的能量交换和碳循环[15 -18 ] .而冻融循环对寒区水文过程(特别是地下部分)的影响,包括土壤水分的变化[19 ] 、径流路径的变化[20 -21 ] 、地下水的分布[22 -23 ] 以及陆地水储量[24 -26 ] 等.此外,全球气候变暖导致土壤温度升高,多年冻土的退化加剧,季节冻结深度减小,融化深度增大;而地下存储的碳以温室气体的形式被释放到大气中[27 -30 ] ,又对全球变暖产生正反馈[21 ,31 ] .因此,研究寒区土壤水文过程,即土壤水热传输过程,是寒区水文学的关键问题之一. ...
Permafrost hydrology of the Qinghai-Tibet Plateau: a review of processes and modeling
1
2021
... 冰冻圈是世界上许多大江大河的发源地,是干旱区内陆河流域的“水塔”[1 -3 ] .冻土作为陆地冰冻圈的重要组成部分[4 ] ,不仅对寒区水文过程有显著影响[5 -7 ] ,而且对全球气候变化极其敏感[8 -10 ] .冻土本身具有相对隔水层的特点,使地下水文过程更加复杂[11 -14 ] ,进而影响地表水文过程、地-气之间的能量交换和碳循环[15 -18 ] .而冻融循环对寒区水文过程(特别是地下部分)的影响,包括土壤水分的变化[19 ] 、径流路径的变化[20 -21 ] 、地下水的分布[22 -23 ] 以及陆地水储量[24 -26 ] 等.此外,全球气候变暖导致土壤温度升高,多年冻土的退化加剧,季节冻结深度减小,融化深度增大;而地下存储的碳以温室气体的形式被释放到大气中[27 -30 ] ,又对全球变暖产生正反馈[21 ,31 ] .因此,研究寒区土壤水文过程,即土壤水热传输过程,是寒区水文学的关键问题之一. ...
Hydrological basis and discipline system of cryohydrology: from a perspective of cryospheric science
2020
Improving actual evapotranspiration estimation integrating energy consumption for ice phase change across the Tibetan Plateau
1
2020
... 冰冻圈是世界上许多大江大河的发源地,是干旱区内陆河流域的“水塔”[1 -3 ] .冻土作为陆地冰冻圈的重要组成部分[4 ] ,不仅对寒区水文过程有显著影响[5 -7 ] ,而且对全球气候变化极其敏感[8 -10 ] .冻土本身具有相对隔水层的特点,使地下水文过程更加复杂[11 -14 ] ,进而影响地表水文过程、地-气之间的能量交换和碳循环[15 -18 ] .而冻融循环对寒区水文过程(特别是地下部分)的影响,包括土壤水分的变化[19 ] 、径流路径的变化[20 -21 ] 、地下水的分布[22 -23 ] 以及陆地水储量[24 -26 ] 等.此外,全球气候变暖导致土壤温度升高,多年冻土的退化加剧,季节冻结深度减小,融化深度增大;而地下存储的碳以温室气体的形式被释放到大气中[27 -30 ] ,又对全球变暖产生正反馈[21 ,31 ] .因此,研究寒区土壤水文过程,即土壤水热传输过程,是寒区水文学的关键问题之一. ...
Changes in the mountain cryosphere and their impacts and adaptation measures
1
2020
... 冰冻圈是世界上许多大江大河的发源地,是干旱区内陆河流域的“水塔”[1 -3 ] .冻土作为陆地冰冻圈的重要组成部分[4 ] ,不仅对寒区水文过程有显著影响[5 -7 ] ,而且对全球气候变化极其敏感[8 -10 ] .冻土本身具有相对隔水层的特点,使地下水文过程更加复杂[11 -14 ] ,进而影响地表水文过程、地-气之间的能量交换和碳循环[15 -18 ] .而冻融循环对寒区水文过程(特别是地下部分)的影响,包括土壤水分的变化[19 ] 、径流路径的变化[20 -21 ] 、地下水的分布[22 -23 ] 以及陆地水储量[24 -26 ] 等.此外,全球气候变暖导致土壤温度升高,多年冻土的退化加剧,季节冻结深度减小,融化深度增大;而地下存储的碳以温室气体的形式被释放到大气中[27 -30 ] ,又对全球变暖产生正反馈[21 ,31 ] .因此,研究寒区土壤水文过程,即土壤水热传输过程,是寒区水文学的关键问题之一. ...
全球山地冰冻圈变化、影响与适应
1
2020
... 冰冻圈是世界上许多大江大河的发源地,是干旱区内陆河流域的“水塔”[1 -3 ] .冻土作为陆地冰冻圈的重要组成部分[4 ] ,不仅对寒区水文过程有显著影响[5 -7 ] ,而且对全球气候变化极其敏感[8 -10 ] .冻土本身具有相对隔水层的特点,使地下水文过程更加复杂[11 -14 ] ,进而影响地表水文过程、地-气之间的能量交换和碳循环[15 -18 ] .而冻融循环对寒区水文过程(特别是地下部分)的影响,包括土壤水分的变化[19 ] 、径流路径的变化[20 -21 ] 、地下水的分布[22 -23 ] 以及陆地水储量[24 -26 ] 等.此外,全球气候变暖导致土壤温度升高,多年冻土的退化加剧,季节冻结深度减小,融化深度增大;而地下存储的碳以温室气体的形式被释放到大气中[27 -30 ] ,又对全球变暖产生正反馈[21 ,31 ] .因此,研究寒区土壤水文过程,即土壤水热传输过程,是寒区水文学的关键问题之一. ...
Increasing cryospheric hazards in a warming climate
1
2020
... 冰冻圈是世界上许多大江大河的发源地,是干旱区内陆河流域的“水塔”[1 -3 ] .冻土作为陆地冰冻圈的重要组成部分[4 ] ,不仅对寒区水文过程有显著影响[5 -7 ] ,而且对全球气候变化极其敏感[8 -10 ] .冻土本身具有相对隔水层的特点,使地下水文过程更加复杂[11 -14 ] ,进而影响地表水文过程、地-气之间的能量交换和碳循环[15 -18 ] .而冻融循环对寒区水文过程(特别是地下部分)的影响,包括土壤水分的变化[19 ] 、径流路径的变化[20 -21 ] 、地下水的分布[22 -23 ] 以及陆地水储量[24 -26 ] 等.此外,全球气候变暖导致土壤温度升高,多年冻土的退化加剧,季节冻结深度减小,融化深度增大;而地下存储的碳以温室气体的形式被释放到大气中[27 -30 ] ,又对全球变暖产生正反馈[21 ,31 ] .因此,研究寒区土壤水文过程,即土壤水热传输过程,是寒区水文学的关键问题之一. ...
Invited perspective: what lies beneath a changing arctic?
1
2021
... 冰冻圈是世界上许多大江大河的发源地,是干旱区内陆河流域的“水塔”[1 -3 ] .冻土作为陆地冰冻圈的重要组成部分[4 ] ,不仅对寒区水文过程有显著影响[5 -7 ] ,而且对全球气候变化极其敏感[8 -10 ] .冻土本身具有相对隔水层的特点,使地下水文过程更加复杂[11 -14 ] ,进而影响地表水文过程、地-气之间的能量交换和碳循环[15 -18 ] .而冻融循环对寒区水文过程(特别是地下部分)的影响,包括土壤水分的变化[19 ] 、径流路径的变化[20 -21 ] 、地下水的分布[22 -23 ] 以及陆地水储量[24 -26 ] 等.此外,全球气候变暖导致土壤温度升高,多年冻土的退化加剧,季节冻结深度减小,融化深度增大;而地下存储的碳以温室气体的形式被释放到大气中[27 -30 ] ,又对全球变暖产生正反馈[21 ,31 ] .因此,研究寒区土壤水文过程,即土壤水热传输过程,是寒区水文学的关键问题之一. ...
Groundwater dynamics within a watershed in the discontinuous permafrost zone near Umiujaq (Nunavik, Canada)
2020
Effects of cryospheric change on alpine hydrology: combining a model with observations in the upper reaches of the Hei River, China
2018
Processes of runoff generation operating during the spring and autumn seasons in a permafrost catchment on semi-arid plateaus
1
2017
... 冰冻圈是世界上许多大江大河的发源地,是干旱区内陆河流域的“水塔”[1 -3 ] .冻土作为陆地冰冻圈的重要组成部分[4 ] ,不仅对寒区水文过程有显著影响[5 -7 ] ,而且对全球气候变化极其敏感[8 -10 ] .冻土本身具有相对隔水层的特点,使地下水文过程更加复杂[11 -14 ] ,进而影响地表水文过程、地-气之间的能量交换和碳循环[15 -18 ] .而冻融循环对寒区水文过程(特别是地下部分)的影响,包括土壤水分的变化[19 ] 、径流路径的变化[20 -21 ] 、地下水的分布[22 -23 ] 以及陆地水储量[24 -26 ] 等.此外,全球气候变暖导致土壤温度升高,多年冻土的退化加剧,季节冻结深度减小,融化深度增大;而地下存储的碳以温室气体的形式被释放到大气中[27 -30 ] ,又对全球变暖产生正反馈[21 ,31 ] .因此,研究寒区土壤水文过程,即土壤水热传输过程,是寒区水文学的关键问题之一. ...
Remote sensing quantifies widespread abundance of permafrost region disturbances across the Arctic and Subarctic
1
2018
... 冰冻圈是世界上许多大江大河的发源地,是干旱区内陆河流域的“水塔”[1 -3 ] .冻土作为陆地冰冻圈的重要组成部分[4 ] ,不仅对寒区水文过程有显著影响[5 -7 ] ,而且对全球气候变化极其敏感[8 -10 ] .冻土本身具有相对隔水层的特点,使地下水文过程更加复杂[11 -14 ] ,进而影响地表水文过程、地-气之间的能量交换和碳循环[15 -18 ] .而冻融循环对寒区水文过程(特别是地下部分)的影响,包括土壤水分的变化[19 ] 、径流路径的变化[20 -21 ] 、地下水的分布[22 -23 ] 以及陆地水储量[24 -26 ] 等.此外,全球气候变暖导致土壤温度升高,多年冻土的退化加剧,季节冻结深度减小,融化深度增大;而地下存储的碳以温室气体的形式被释放到大气中[27 -30 ] ,又对全球变暖产生正反馈[21 ,31 ] .因此,研究寒区土壤水文过程,即土壤水热传输过程,是寒区水文学的关键问题之一. ...
Simulation of soil thermal dynamics using an artificial neural network model for a permafrost alpine meadow on the Qinghai-Tibetan Plateau
2019
Investigation on permafrost distribution over the upper reaches of the Heihe River in the Qilian Mountains
2013
Changing climate and the permafrost environment on the Qinghai-Tibet (Xizang) Plateau
1
2020
... 冰冻圈是世界上许多大江大河的发源地,是干旱区内陆河流域的“水塔”[1 -3 ] .冻土作为陆地冰冻圈的重要组成部分[4 ] ,不仅对寒区水文过程有显著影响[5 -7 ] ,而且对全球气候变化极其敏感[8 -10 ] .冻土本身具有相对隔水层的特点,使地下水文过程更加复杂[11 -14 ] ,进而影响地表水文过程、地-气之间的能量交换和碳循环[15 -18 ] .而冻融循环对寒区水文过程(特别是地下部分)的影响,包括土壤水分的变化[19 ] 、径流路径的变化[20 -21 ] 、地下水的分布[22 -23 ] 以及陆地水储量[24 -26 ] 等.此外,全球气候变暖导致土壤温度升高,多年冻土的退化加剧,季节冻结深度减小,融化深度增大;而地下存储的碳以温室气体的形式被释放到大气中[27 -30 ] ,又对全球变暖产生正反馈[21 ,31 ] .因此,研究寒区土壤水文过程,即土壤水热传输过程,是寒区水文学的关键问题之一. ...
1
2019
... 冰冻圈是世界上许多大江大河的发源地,是干旱区内陆河流域的“水塔”[1 -3 ] .冻土作为陆地冰冻圈的重要组成部分[4 ] ,不仅对寒区水文过程有显著影响[5 -7 ] ,而且对全球气候变化极其敏感[8 -10 ] .冻土本身具有相对隔水层的特点,使地下水文过程更加复杂[11 -14 ] ,进而影响地表水文过程、地-气之间的能量交换和碳循环[15 -18 ] .而冻融循环对寒区水文过程(特别是地下部分)的影响,包括土壤水分的变化[19 ] 、径流路径的变化[20 -21 ] 、地下水的分布[22 -23 ] 以及陆地水储量[24 -26 ] 等.此外,全球气候变暖导致土壤温度升高,多年冻土的退化加剧,季节冻结深度减小,融化深度增大;而地下存储的碳以温室气体的形式被释放到大气中[27 -30 ] ,又对全球变暖产生正反馈[21 ,31 ] .因此,研究寒区土壤水文过程,即土壤水热传输过程,是寒区水文学的关键问题之一. ...
Characteristic, changes and impacts of permafrost on Qinghai-Tibet Plateau
1
2019
... 冰冻圈是世界上许多大江大河的发源地,是干旱区内陆河流域的“水塔”[1 -3 ] .冻土作为陆地冰冻圈的重要组成部分[4 ] ,不仅对寒区水文过程有显著影响[5 -7 ] ,而且对全球气候变化极其敏感[8 -10 ] .冻土本身具有相对隔水层的特点,使地下水文过程更加复杂[11 -14 ] ,进而影响地表水文过程、地-气之间的能量交换和碳循环[15 -18 ] .而冻融循环对寒区水文过程(特别是地下部分)的影响,包括土壤水分的变化[19 ] 、径流路径的变化[20 -21 ] 、地下水的分布[22 -23 ] 以及陆地水储量[24 -26 ] 等.此外,全球气候变暖导致土壤温度升高,多年冻土的退化加剧,季节冻结深度减小,融化深度增大;而地下存储的碳以温室气体的形式被释放到大气中[27 -30 ] ,又对全球变暖产生正反馈[21 ,31 ] .因此,研究寒区土壤水文过程,即土壤水热传输过程,是寒区水文学的关键问题之一. ...
青藏高原多年冻土特征、变化及影响
1
2019
... 冰冻圈是世界上许多大江大河的发源地,是干旱区内陆河流域的“水塔”[1 -3 ] .冻土作为陆地冰冻圈的重要组成部分[4 ] ,不仅对寒区水文过程有显著影响[5 -7 ] ,而且对全球气候变化极其敏感[8 -10 ] .冻土本身具有相对隔水层的特点,使地下水文过程更加复杂[11 -14 ] ,进而影响地表水文过程、地-气之间的能量交换和碳循环[15 -18 ] .而冻融循环对寒区水文过程(特别是地下部分)的影响,包括土壤水分的变化[19 ] 、径流路径的变化[20 -21 ] 、地下水的分布[22 -23 ] 以及陆地水储量[24 -26 ] 等.此外,全球气候变暖导致土壤温度升高,多年冻土的退化加剧,季节冻结深度减小,融化深度增大;而地下存储的碳以温室气体的形式被释放到大气中[27 -30 ] ,又对全球变暖产生正反馈[21 ,31 ] .因此,研究寒区土壤水文过程,即土壤水热传输过程,是寒区水文学的关键问题之一. ...
Climate change impacts on groundwater and soil temperatures in cold and temperate regions: implications, mathematical theory, and emerging simulation tools
2
2014
... 冰冻圈是世界上许多大江大河的发源地,是干旱区内陆河流域的“水塔”[1 -3 ] .冻土作为陆地冰冻圈的重要组成部分[4 ] ,不仅对寒区水文过程有显著影响[5 -7 ] ,而且对全球气候变化极其敏感[8 -10 ] .冻土本身具有相对隔水层的特点,使地下水文过程更加复杂[11 -14 ] ,进而影响地表水文过程、地-气之间的能量交换和碳循环[15 -18 ] .而冻融循环对寒区水文过程(特别是地下部分)的影响,包括土壤水分的变化[19 ] 、径流路径的变化[20 -21 ] 、地下水的分布[22 -23 ] 以及陆地水储量[24 -26 ] 等.此外,全球气候变暖导致土壤温度升高,多年冻土的退化加剧,季节冻结深度减小,融化深度增大;而地下存储的碳以温室气体的形式被释放到大气中[27 -30 ] ,又对全球变暖产生正反馈[21 ,31 ] .因此,研究寒区土壤水文过程,即土壤水热传输过程,是寒区水文学的关键问题之一. ...
... [21 ,31 ].因此,研究寒区土壤水文过程,即土壤水热传输过程,是寒区水文学的关键问题之一. ...
Evolution of shallow groundwater flow systems in areas of degrading permafrost
1
2009
... 冰冻圈是世界上许多大江大河的发源地,是干旱区内陆河流域的“水塔”[1 -3 ] .冻土作为陆地冰冻圈的重要组成部分[4 ] ,不仅对寒区水文过程有显著影响[5 -7 ] ,而且对全球气候变化极其敏感[8 -10 ] .冻土本身具有相对隔水层的特点,使地下水文过程更加复杂[11 -14 ] ,进而影响地表水文过程、地-气之间的能量交换和碳循环[15 -18 ] .而冻融循环对寒区水文过程(特别是地下部分)的影响,包括土壤水分的变化[19 ] 、径流路径的变化[20 -21 ] 、地下水的分布[22 -23 ] 以及陆地水储量[24 -26 ] 等.此外,全球气候变暖导致土壤温度升高,多年冻土的退化加剧,季节冻结深度减小,融化深度增大;而地下存储的碳以温室气体的形式被释放到大气中[27 -30 ] ,又对全球变暖产生正反馈[21 ,31 ] .因此,研究寒区土壤水文过程,即土壤水热传输过程,是寒区水文学的关键问题之一. ...
Hydrologic impacts of thawing permafrost: a review
1
2016
... 冰冻圈是世界上许多大江大河的发源地,是干旱区内陆河流域的“水塔”[1 -3 ] .冻土作为陆地冰冻圈的重要组成部分[4 ] ,不仅对寒区水文过程有显著影响[5 -7 ] ,而且对全球气候变化极其敏感[8 -10 ] .冻土本身具有相对隔水层的特点,使地下水文过程更加复杂[11 -14 ] ,进而影响地表水文过程、地-气之间的能量交换和碳循环[15 -18 ] .而冻融循环对寒区水文过程(特别是地下部分)的影响,包括土壤水分的变化[19 ] 、径流路径的变化[20 -21 ] 、地下水的分布[22 -23 ] 以及陆地水储量[24 -26 ] 等.此外,全球气候变暖导致土壤温度升高,多年冻土的退化加剧,季节冻结深度减小,融化深度增大;而地下存储的碳以温室气体的形式被释放到大气中[27 -30 ] ,又对全球变暖产生正反馈[21 ,31 ] .因此,研究寒区土壤水文过程,即土壤水热传输过程,是寒区水文学的关键问题之一. ...
Jacques J-M
1
2009
... 冰冻圈是世界上许多大江大河的发源地,是干旱区内陆河流域的“水塔”[1 -3 ] .冻土作为陆地冰冻圈的重要组成部分[4 ] ,不仅对寒区水文过程有显著影响[5 -7 ] ,而且对全球气候变化极其敏感[8 -10 ] .冻土本身具有相对隔水层的特点,使地下水文过程更加复杂[11 -14 ] ,进而影响地表水文过程、地-气之间的能量交换和碳循环[15 -18 ] .而冻融循环对寒区水文过程(特别是地下部分)的影响,包括土壤水分的变化[19 ] 、径流路径的变化[20 -21 ] 、地下水的分布[22 -23 ] 以及陆地水储量[24 -26 ] 等.此外,全球气候变暖导致土壤温度升高,多年冻土的退化加剧,季节冻结深度减小,融化深度增大;而地下存储的碳以温室气体的形式被释放到大气中[27 -30 ] ,又对全球变暖产生正反馈[21 ,31 ] .因此,研究寒区土壤水文过程,即土壤水热传输过程,是寒区水文学的关键问题之一. ...
Observed changes in pan-arctic cold-season minimum monthly river discharge
2010
A review of groundwater in high mountain environments
1
2020
... 冰冻圈是世界上许多大江大河的发源地,是干旱区内陆河流域的“水塔”[1 -3 ] .冻土作为陆地冰冻圈的重要组成部分[4 ] ,不仅对寒区水文过程有显著影响[5 -7 ] ,而且对全球气候变化极其敏感[8 -10 ] .冻土本身具有相对隔水层的特点,使地下水文过程更加复杂[11 -14 ] ,进而影响地表水文过程、地-气之间的能量交换和碳循环[15 -18 ] .而冻融循环对寒区水文过程(特别是地下部分)的影响,包括土壤水分的变化[19 ] 、径流路径的变化[20 -21 ] 、地下水的分布[22 -23 ] 以及陆地水储量[24 -26 ] 等.此外,全球气候变暖导致土壤温度升高,多年冻土的退化加剧,季节冻结深度减小,融化深度增大;而地下存储的碳以温室气体的形式被释放到大气中[27 -30 ] ,又对全球变暖产生正反馈[21 ,31 ] .因此,研究寒区土壤水文过程,即土壤水热传输过程,是寒区水文学的关键问题之一. ...
Carbon release through abrupt permafrost thaw
1
2020
... 冰冻圈是世界上许多大江大河的发源地,是干旱区内陆河流域的“水塔”[1 -3 ] .冻土作为陆地冰冻圈的重要组成部分[4 ] ,不仅对寒区水文过程有显著影响[5 -7 ] ,而且对全球气候变化极其敏感[8 -10 ] .冻土本身具有相对隔水层的特点,使地下水文过程更加复杂[11 -14 ] ,进而影响地表水文过程、地-气之间的能量交换和碳循环[15 -18 ] .而冻融循环对寒区水文过程(特别是地下部分)的影响,包括土壤水分的变化[19 ] 、径流路径的变化[20 -21 ] 、地下水的分布[22 -23 ] 以及陆地水储量[24 -26 ] 等.此外,全球气候变暖导致土壤温度升高,多年冻土的退化加剧,季节冻结深度减小,融化深度增大;而地下存储的碳以温室气体的形式被释放到大气中[27 -30 ] ,又对全球变暖产生正反馈[21 ,31 ] .因此,研究寒区土壤水文过程,即土壤水热传输过程,是寒区水文学的关键问题之一. ...
Permafrost thawing puts the frozen carbon at risk over the Tibetan Plateau
2020
Soil moisture as a key factor in carbon release from thawing permafrost in a boreal forest
2020
Development of perennial thaw zones in boreal hillslopes enhances potential mobilization of permafrost carbon
1
2019
... 冰冻圈是世界上许多大江大河的发源地,是干旱区内陆河流域的“水塔”[1 -3 ] .冻土作为陆地冰冻圈的重要组成部分[4 ] ,不仅对寒区水文过程有显著影响[5 -7 ] ,而且对全球气候变化极其敏感[8 -10 ] .冻土本身具有相对隔水层的特点,使地下水文过程更加复杂[11 -14 ] ,进而影响地表水文过程、地-气之间的能量交换和碳循环[15 -18 ] .而冻融循环对寒区水文过程(特别是地下部分)的影响,包括土壤水分的变化[19 ] 、径流路径的变化[20 -21 ] 、地下水的分布[22 -23 ] 以及陆地水储量[24 -26 ] 等.此外,全球气候变暖导致土壤温度升高,多年冻土的退化加剧,季节冻结深度减小,融化深度增大;而地下存储的碳以温室气体的形式被释放到大气中[27 -30 ] ,又对全球变暖产生正反馈[21 ,31 ] .因此,研究寒区土壤水文过程,即土壤水热传输过程,是寒区水文学的关键问题之一. ...
Three-phase numerical model for subsurface hydrology in permafrost-affected regions (PFLOTRAN-ICE v1.0)
1
2014
... 冰冻圈是世界上许多大江大河的发源地,是干旱区内陆河流域的“水塔”[1 -3 ] .冻土作为陆地冰冻圈的重要组成部分[4 ] ,不仅对寒区水文过程有显著影响[5 -7 ] ,而且对全球气候变化极其敏感[8 -10 ] .冻土本身具有相对隔水层的特点,使地下水文过程更加复杂[11 -14 ] ,进而影响地表水文过程、地-气之间的能量交换和碳循环[15 -18 ] .而冻融循环对寒区水文过程(特别是地下部分)的影响,包括土壤水分的变化[19 ] 、径流路径的变化[20 -21 ] 、地下水的分布[22 -23 ] 以及陆地水储量[24 -26 ] 等.此外,全球气候变暖导致土壤温度升高,多年冻土的退化加剧,季节冻结深度减小,融化深度增大;而地下存储的碳以温室气体的形式被释放到大气中[27 -30 ] ,又对全球变暖产生正反馈[21 ,31 ] .因此,研究寒区土壤水文过程,即土壤水热传输过程,是寒区水文学的关键问题之一. ...
Whither field hydrology? The need for discovery science and outrageous hydrological hypotheses
1
2015
... 由于寒区环境恶劣、人迹罕至,开展野外观测较为困难,因此,野外水文气象、水文地质和地球物理观测的范围、频率和数据量、数据精度等均受限[32 -34 ] .随着数值模拟和计算机科学的快速发展,基于近几十年积累的观测数据,构建数值模型研究气候和季节变化下的寒区土壤水热传输过程,是理解寒区土壤水文物理过程,揭示其动力学机制的重要工具[35 -37 ] .寒区土壤水热传输的物理过程较为复杂,涉及多相流动、冰水相态变化、冻胀等,使得描述水热传输过程的本构方程也具有高度的复杂性和非线性,这些都为建模和数值模拟带来了巨大的科学挑战[38 ] .目前,寒区水文模型主要包括基于陆地水文学的寒区分布式水文模型(distributed hydrologic model)[39 ] 和基于水文地质学的寒区水文地质模型(groundwater/hydrogeologic model)[40 ] .寒区分布式水文模型,如CRHM[41 ] 、GBEHM[42 ] 、VIC[43 ] 、HydroSiB2-SF[44 ] 、WEB-DHM-pF[45 ] ,是针对寒区水文循环中子过程/子单元分别建立子模型/模块,并集成至统一的模型框架中.这类模型已尽可能集成了寒区水文循环中的所有环节,但存在空间分辨率较低(千米级)、参数众多难以率定、需要大量观测数据加以验证的问题[46 ] ,且侧重于陆面地表过程,对于地下水文过程仍停留在参数化方案或一维地下水模型层面[47 ] .因此,此类模型无法精细刻画寒区土壤水分运移和热传递的物理过程,对冻融等寒区特殊现象的本质成因和动力学机理研究不够成熟[48 ] .源自地下水科学、水文地质学和冻土水文学发展的寒区水文地质模型(cryo-hydrogeological model)[49 ] ,如SUTRA-ICE[50 -52 ] 、FEFLOW[53 -54 ] 、ATS[55 -56 ] 、Cast3M(www-cast3m.cea.fr)、PFLOTRAN-ICE(www.pflotran.org )、HydroGeoSphere(HGS)[57 -58 ] 等,利用多孔介质渗流和传热理论建立地下水多相流动和热传递的本构方程,并通过土壤水分冻融曲线或基于物理过程的本构关系(例如Clausius-Clapyeron方程)来表征冻融循环对孔隙水相态、土壤孔隙率和渗透性的影响,进而模拟计算土壤水分和温度、地下径流量及其对流域地表径流的补给量等[59 ] .但是,此类模型较为复杂,大多为封装化或商业化软件,较难进行二次开发,且计算精度和效率有待提高. ...
Integrated hydrometeorological, snow and frozen-ground observations in the alpine region of the Heihe River Basin, China
2019
Integrated surface and subsurface hydrological modeling with snowmelt and pore water freeze-thaw
3
2019
... 由于寒区环境恶劣、人迹罕至,开展野外观测较为困难,因此,野外水文气象、水文地质和地球物理观测的范围、频率和数据量、数据精度等均受限[32 -34 ] .随着数值模拟和计算机科学的快速发展,基于近几十年积累的观测数据,构建数值模型研究气候和季节变化下的寒区土壤水热传输过程,是理解寒区土壤水文物理过程,揭示其动力学机制的重要工具[35 -37 ] .寒区土壤水热传输的物理过程较为复杂,涉及多相流动、冰水相态变化、冻胀等,使得描述水热传输过程的本构方程也具有高度的复杂性和非线性,这些都为建模和数值模拟带来了巨大的科学挑战[38 ] .目前,寒区水文模型主要包括基于陆地水文学的寒区分布式水文模型(distributed hydrologic model)[39 ] 和基于水文地质学的寒区水文地质模型(groundwater/hydrogeologic model)[40 ] .寒区分布式水文模型,如CRHM[41 ] 、GBEHM[42 ] 、VIC[43 ] 、HydroSiB2-SF[44 ] 、WEB-DHM-pF[45 ] ,是针对寒区水文循环中子过程/子单元分别建立子模型/模块,并集成至统一的模型框架中.这类模型已尽可能集成了寒区水文循环中的所有环节,但存在空间分辨率较低(千米级)、参数众多难以率定、需要大量观测数据加以验证的问题[46 ] ,且侧重于陆面地表过程,对于地下水文过程仍停留在参数化方案或一维地下水模型层面[47 ] .因此,此类模型无法精细刻画寒区土壤水分运移和热传递的物理过程,对冻融等寒区特殊现象的本质成因和动力学机理研究不够成熟[48 ] .源自地下水科学、水文地质学和冻土水文学发展的寒区水文地质模型(cryo-hydrogeological model)[49 ] ,如SUTRA-ICE[50 -52 ] 、FEFLOW[53 -54 ] 、ATS[55 -56 ] 、Cast3M(www-cast3m.cea.fr)、PFLOTRAN-ICE(www.pflotran.org )、HydroGeoSphere(HGS)[57 -58 ] 等,利用多孔介质渗流和传热理论建立地下水多相流动和热传递的本构方程,并通过土壤水分冻融曲线或基于物理过程的本构关系(例如Clausius-Clapyeron方程)来表征冻融循环对孔隙水相态、土壤孔隙率和渗透性的影响,进而模拟计算土壤水分和温度、地下径流量及其对流域地表径流的补给量等[59 ] .但是,此类模型较为复杂,大多为封装化或商业化软件,较难进行二次开发,且计算精度和效率有待提高. ...
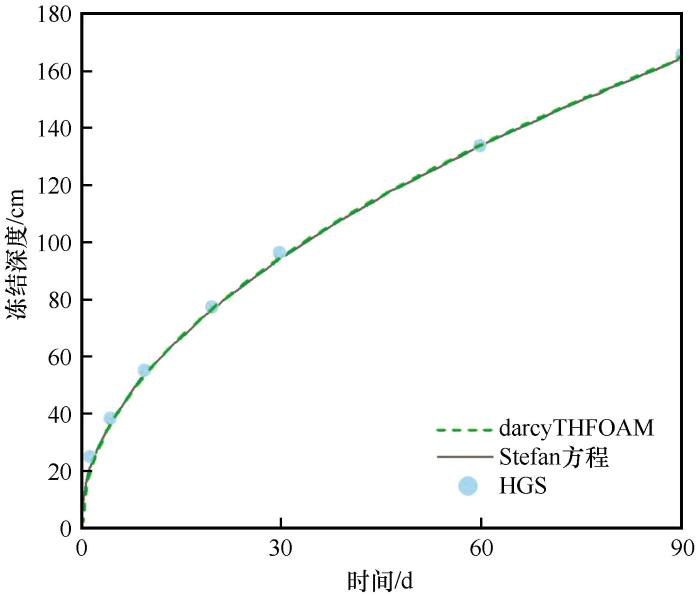
... 一维Stefan方程存在解析解[34 ,75 -76 ] ,可根据温度来估算冻结深度随时间的变化. ...
... 为更好地与Stefan方程的解析解对比,Schilling等[34 ] 采用HGS模拟了一维垂直土柱的融化过程.根据他们研究中的算例设置,假定土柱是均质的,高10 m,起初处于-5 ℃的完全冻结状态,土柱的顶部和底部为恒定为10 ℃和-5 ℃.土壤固体颗粒的导热率λ s =0.017 J·s-1 ·cm-3 ·K-1 ,比热容C s =35.07 J·cm-3 ·K-1 ,孔隙度ε =0.4.为将模拟结果与解析解对比,将土壤冻结特征曲线中的拟合参数W 设置为4,其他参数与以下基准测试算例相同. ...
1
2017
... 由于寒区环境恶劣、人迹罕至,开展野外观测较为困难,因此,野外水文气象、水文地质和地球物理观测的范围、频率和数据量、数据精度等均受限[32 -34 ] .随着数值模拟和计算机科学的快速发展,基于近几十年积累的观测数据,构建数值模型研究气候和季节变化下的寒区土壤水热传输过程,是理解寒区土壤水文物理过程,揭示其动力学机制的重要工具[35 -37 ] .寒区土壤水热传输的物理过程较为复杂,涉及多相流动、冰水相态变化、冻胀等,使得描述水热传输过程的本构方程也具有高度的复杂性和非线性,这些都为建模和数值模拟带来了巨大的科学挑战[38 ] .目前,寒区水文模型主要包括基于陆地水文学的寒区分布式水文模型(distributed hydrologic model)[39 ] 和基于水文地质学的寒区水文地质模型(groundwater/hydrogeologic model)[40 ] .寒区分布式水文模型,如CRHM[41 ] 、GBEHM[42 ] 、VIC[43 ] 、HydroSiB2-SF[44 ] 、WEB-DHM-pF[45 ] ,是针对寒区水文循环中子过程/子单元分别建立子模型/模块,并集成至统一的模型框架中.这类模型已尽可能集成了寒区水文循环中的所有环节,但存在空间分辨率较低(千米级)、参数众多难以率定、需要大量观测数据加以验证的问题[46 ] ,且侧重于陆面地表过程,对于地下水文过程仍停留在参数化方案或一维地下水模型层面[47 ] .因此,此类模型无法精细刻画寒区土壤水分运移和热传递的物理过程,对冻融等寒区特殊现象的本质成因和动力学机理研究不够成熟[48 ] .源自地下水科学、水文地质学和冻土水文学发展的寒区水文地质模型(cryo-hydrogeological model)[49 ] ,如SUTRA-ICE[50 -52 ] 、FEFLOW[53 -54 ] 、ATS[55 -56 ] 、Cast3M(www-cast3m.cea.fr)、PFLOTRAN-ICE(www.pflotran.org )、HydroGeoSphere(HGS)[57 -58 ] 等,利用多孔介质渗流和传热理论建立地下水多相流动和热传递的本构方程,并通过土壤水分冻融曲线或基于物理过程的本构关系(例如Clausius-Clapyeron方程)来表征冻融循环对孔隙水相态、土壤孔隙率和渗透性的影响,进而模拟计算土壤水分和温度、地下径流量及其对流域地表径流的补给量等[59 ] .但是,此类模型较为复杂,大多为封装化或商业化软件,较难进行二次开发,且计算精度和效率有待提高. ...
The Tibetan Plateau cryosphere: observations and model simulations for current status and recent changes
2019
A review of hydrological models applied in the permafrost-dominated arctic region
1
2020
... 由于寒区环境恶劣、人迹罕至,开展野外观测较为困难,因此,野外水文气象、水文地质和地球物理观测的范围、频率和数据量、数据精度等均受限[32 -34 ] .随着数值模拟和计算机科学的快速发展,基于近几十年积累的观测数据,构建数值模型研究气候和季节变化下的寒区土壤水热传输过程,是理解寒区土壤水文物理过程,揭示其动力学机制的重要工具[35 -37 ] .寒区土壤水热传输的物理过程较为复杂,涉及多相流动、冰水相态变化、冻胀等,使得描述水热传输过程的本构方程也具有高度的复杂性和非线性,这些都为建模和数值模拟带来了巨大的科学挑战[38 ] .目前,寒区水文模型主要包括基于陆地水文学的寒区分布式水文模型(distributed hydrologic model)[39 ] 和基于水文地质学的寒区水文地质模型(groundwater/hydrogeologic model)[40 ] .寒区分布式水文模型,如CRHM[41 ] 、GBEHM[42 ] 、VIC[43 ] 、HydroSiB2-SF[44 ] 、WEB-DHM-pF[45 ] ,是针对寒区水文循环中子过程/子单元分别建立子模型/模块,并集成至统一的模型框架中.这类模型已尽可能集成了寒区水文循环中的所有环节,但存在空间分辨率较低(千米级)、参数众多难以率定、需要大量观测数据加以验证的问题[46 ] ,且侧重于陆面地表过程,对于地下水文过程仍停留在参数化方案或一维地下水模型层面[47 ] .因此,此类模型无法精细刻画寒区土壤水分运移和热传递的物理过程,对冻融等寒区特殊现象的本质成因和动力学机理研究不够成熟[48 ] .源自地下水科学、水文地质学和冻土水文学发展的寒区水文地质模型(cryo-hydrogeological model)[49 ] ,如SUTRA-ICE[50 -52 ] 、FEFLOW[53 -54 ] 、ATS[55 -56 ] 、Cast3M(www-cast3m.cea.fr)、PFLOTRAN-ICE(www.pflotran.org )、HydroGeoSphere(HGS)[57 -58 ] 等,利用多孔介质渗流和传热理论建立地下水多相流动和热传递的本构方程,并通过土壤水分冻融曲线或基于物理过程的本构关系(例如Clausius-Clapyeron方程)来表征冻融循环对孔隙水相态、土壤孔隙率和渗透性的影响,进而模拟计算土壤水分和温度、地下径流量及其对流域地表径流的补给量等[59 ] .但是,此类模型较为复杂,大多为封装化或商业化软件,较难进行二次开发,且计算精度和效率有待提高. ...
Guidelines for cold-regions groundwater numerical modeling
1
2020
... 由于寒区环境恶劣、人迹罕至,开展野外观测较为困难,因此,野外水文气象、水文地质和地球物理观测的范围、频率和数据量、数据精度等均受限[32 -34 ] .随着数值模拟和计算机科学的快速发展,基于近几十年积累的观测数据,构建数值模型研究气候和季节变化下的寒区土壤水热传输过程,是理解寒区土壤水文物理过程,揭示其动力学机制的重要工具[35 -37 ] .寒区土壤水热传输的物理过程较为复杂,涉及多相流动、冰水相态变化、冻胀等,使得描述水热传输过程的本构方程也具有高度的复杂性和非线性,这些都为建模和数值模拟带来了巨大的科学挑战[38 ] .目前,寒区水文模型主要包括基于陆地水文学的寒区分布式水文模型(distributed hydrologic model)[39 ] 和基于水文地质学的寒区水文地质模型(groundwater/hydrogeologic model)[40 ] .寒区分布式水文模型,如CRHM[41 ] 、GBEHM[42 ] 、VIC[43 ] 、HydroSiB2-SF[44 ] 、WEB-DHM-pF[45 ] ,是针对寒区水文循环中子过程/子单元分别建立子模型/模块,并集成至统一的模型框架中.这类模型已尽可能集成了寒区水文循环中的所有环节,但存在空间分辨率较低(千米级)、参数众多难以率定、需要大量观测数据加以验证的问题[46 ] ,且侧重于陆面地表过程,对于地下水文过程仍停留在参数化方案或一维地下水模型层面[47 ] .因此,此类模型无法精细刻画寒区土壤水分运移和热传递的物理过程,对冻融等寒区特殊现象的本质成因和动力学机理研究不够成熟[48 ] .源自地下水科学、水文地质学和冻土水文学发展的寒区水文地质模型(cryo-hydrogeological model)[49 ] ,如SUTRA-ICE[50 -52 ] 、FEFLOW[53 -54 ] 、ATS[55 -56 ] 、Cast3M(www-cast3m.cea.fr)、PFLOTRAN-ICE(www.pflotran.org )、HydroGeoSphere(HGS)[57 -58 ] 等,利用多孔介质渗流和传热理论建立地下水多相流动和热传递的本构方程,并通过土壤水分冻融曲线或基于物理过程的本构关系(例如Clausius-Clapyeron方程)来表征冻融循环对孔隙水相态、土壤孔隙率和渗透性的影响,进而模拟计算土壤水分和温度、地下径流量及其对流域地表径流的补给量等[59 ] .但是,此类模型较为复杂,大多为封装化或商业化软件,较难进行二次开发,且计算精度和效率有待提高. ...
A distributed scheme developed for eco-hydrological modeling in the upper Heihe River
1
2015
... 由于寒区环境恶劣、人迹罕至,开展野外观测较为困难,因此,野外水文气象、水文地质和地球物理观测的范围、频率和数据量、数据精度等均受限[32 -34 ] .随着数值模拟和计算机科学的快速发展,基于近几十年积累的观测数据,构建数值模型研究气候和季节变化下的寒区土壤水热传输过程,是理解寒区土壤水文物理过程,揭示其动力学机制的重要工具[35 -37 ] .寒区土壤水热传输的物理过程较为复杂,涉及多相流动、冰水相态变化、冻胀等,使得描述水热传输过程的本构方程也具有高度的复杂性和非线性,这些都为建模和数值模拟带来了巨大的科学挑战[38 ] .目前,寒区水文模型主要包括基于陆地水文学的寒区分布式水文模型(distributed hydrologic model)[39 ] 和基于水文地质学的寒区水文地质模型(groundwater/hydrogeologic model)[40 ] .寒区分布式水文模型,如CRHM[41 ] 、GBEHM[42 ] 、VIC[43 ] 、HydroSiB2-SF[44 ] 、WEB-DHM-pF[45 ] ,是针对寒区水文循环中子过程/子单元分别建立子模型/模块,并集成至统一的模型框架中.这类模型已尽可能集成了寒区水文循环中的所有环节,但存在空间分辨率较低(千米级)、参数众多难以率定、需要大量观测数据加以验证的问题[46 ] ,且侧重于陆面地表过程,对于地下水文过程仍停留在参数化方案或一维地下水模型层面[47 ] .因此,此类模型无法精细刻画寒区土壤水分运移和热传递的物理过程,对冻融等寒区特殊现象的本质成因和动力学机理研究不够成熟[48 ] .源自地下水科学、水文地质学和冻土水文学发展的寒区水文地质模型(cryo-hydrogeological model)[49 ] ,如SUTRA-ICE[50 -52 ] 、FEFLOW[53 -54 ] 、ATS[55 -56 ] 、Cast3M(www-cast3m.cea.fr)、PFLOTRAN-ICE(www.pflotran.org )、HydroGeoSphere(HGS)[57 -58 ] 等,利用多孔介质渗流和传热理论建立地下水多相流动和热传递的本构方程,并通过土壤水分冻融曲线或基于物理过程的本构关系(例如Clausius-Clapyeron方程)来表征冻融循环对孔隙水相态、土壤孔隙率和渗透性的影响,进而模拟计算土壤水分和温度、地下径流量及其对流域地表径流的补给量等[59 ] .但是,此类模型较为复杂,大多为封装化或商业化软件,较难进行二次开发,且计算精度和效率有待提高. ...
A comprehensive graphical modeling platform designed for integrated hydrological simulation
1
2018
... 由于寒区环境恶劣、人迹罕至,开展野外观测较为困难,因此,野外水文气象、水文地质和地球物理观测的范围、频率和数据量、数据精度等均受限[32 -34 ] .随着数值模拟和计算机科学的快速发展,基于近几十年积累的观测数据,构建数值模型研究气候和季节变化下的寒区土壤水热传输过程,是理解寒区土壤水文物理过程,揭示其动力学机制的重要工具[35 -37 ] .寒区土壤水热传输的物理过程较为复杂,涉及多相流动、冰水相态变化、冻胀等,使得描述水热传输过程的本构方程也具有高度的复杂性和非线性,这些都为建模和数值模拟带来了巨大的科学挑战[38 ] .目前,寒区水文模型主要包括基于陆地水文学的寒区分布式水文模型(distributed hydrologic model)[39 ] 和基于水文地质学的寒区水文地质模型(groundwater/hydrogeologic model)[40 ] .寒区分布式水文模型,如CRHM[41 ] 、GBEHM[42 ] 、VIC[43 ] 、HydroSiB2-SF[44 ] 、WEB-DHM-pF[45 ] ,是针对寒区水文循环中子过程/子单元分别建立子模型/模块,并集成至统一的模型框架中.这类模型已尽可能集成了寒区水文循环中的所有环节,但存在空间分辨率较低(千米级)、参数众多难以率定、需要大量观测数据加以验证的问题[46 ] ,且侧重于陆面地表过程,对于地下水文过程仍停留在参数化方案或一维地下水模型层面[47 ] .因此,此类模型无法精细刻画寒区土壤水分运移和热传递的物理过程,对冻融等寒区特殊现象的本质成因和动力学机理研究不够成熟[48 ] .源自地下水科学、水文地质学和冻土水文学发展的寒区水文地质模型(cryo-hydrogeological model)[49 ] ,如SUTRA-ICE[50 -52 ] 、FEFLOW[53 -54 ] 、ATS[55 -56 ] 、Cast3M(www-cast3m.cea.fr)、PFLOTRAN-ICE(www.pflotran.org )、HydroGeoSphere(HGS)[57 -58 ] 等,利用多孔介质渗流和传热理论建立地下水多相流动和热传递的本构方程,并通过土壤水分冻融曲线或基于物理过程的本构关系(例如Clausius-Clapyeron方程)来表征冻融循环对孔隙水相态、土壤孔隙率和渗透性的影响,进而模拟计算土壤水分和温度、地下径流量及其对流域地表径流的补给量等[59 ] .但是,此类模型较为复杂,大多为封装化或商业化软件,较难进行二次开发,且计算精度和效率有待提高. ...
The Canadian Hydrological Model (CHM) v1.0: a multi-scale, multi-extent, variable-complexity hydrological model-design and overview
1
2020
... 由于寒区环境恶劣、人迹罕至,开展野外观测较为困难,因此,野外水文气象、水文地质和地球物理观测的范围、频率和数据量、数据精度等均受限[32 -34 ] .随着数值模拟和计算机科学的快速发展,基于近几十年积累的观测数据,构建数值模型研究气候和季节变化下的寒区土壤水热传输过程,是理解寒区土壤水文物理过程,揭示其动力学机制的重要工具[35 -37 ] .寒区土壤水热传输的物理过程较为复杂,涉及多相流动、冰水相态变化、冻胀等,使得描述水热传输过程的本构方程也具有高度的复杂性和非线性,这些都为建模和数值模拟带来了巨大的科学挑战[38 ] .目前,寒区水文模型主要包括基于陆地水文学的寒区分布式水文模型(distributed hydrologic model)[39 ] 和基于水文地质学的寒区水文地质模型(groundwater/hydrogeologic model)[40 ] .寒区分布式水文模型,如CRHM[41 ] 、GBEHM[42 ] 、VIC[43 ] 、HydroSiB2-SF[44 ] 、WEB-DHM-pF[45 ] ,是针对寒区水文循环中子过程/子单元分别建立子模型/模块,并集成至统一的模型框架中.这类模型已尽可能集成了寒区水文循环中的所有环节,但存在空间分辨率较低(千米级)、参数众多难以率定、需要大量观测数据加以验证的问题[46 ] ,且侧重于陆面地表过程,对于地下水文过程仍停留在参数化方案或一维地下水模型层面[47 ] .因此,此类模型无法精细刻画寒区土壤水分运移和热传递的物理过程,对冻融等寒区特殊现象的本质成因和动力学机理研究不够成熟[48 ] .源自地下水科学、水文地质学和冻土水文学发展的寒区水文地质模型(cryo-hydrogeological model)[49 ] ,如SUTRA-ICE[50 -52 ] 、FEFLOW[53 -54 ] 、ATS[55 -56 ] 、Cast3M(www-cast3m.cea.fr)、PFLOTRAN-ICE(www.pflotran.org )、HydroGeoSphere(HGS)[57 -58 ] 等,利用多孔介质渗流和传热理论建立地下水多相流动和热传递的本构方程,并通过土壤水分冻融曲线或基于物理过程的本构关系(例如Clausius-Clapyeron方程)来表征冻融循环对孔隙水相态、土壤孔隙率和渗透性的影响,进而模拟计算土壤水分和温度、地下径流量及其对流域地表径流的补给量等[59 ] .但是,此类模型较为复杂,大多为封装化或商业化软件,较难进行二次开发,且计算精度和效率有待提高. ...
Tracing snowmelt paths in an integrated hydrological model for understanding seasonal snowmelt contribution at basin scale
1
2019
... 由于寒区环境恶劣、人迹罕至,开展野外观测较为困难,因此,野外水文气象、水文地质和地球物理观测的范围、频率和数据量、数据精度等均受限[32 -34 ] .随着数值模拟和计算机科学的快速发展,基于近几十年积累的观测数据,构建数值模型研究气候和季节变化下的寒区土壤水热传输过程,是理解寒区土壤水文物理过程,揭示其动力学机制的重要工具[35 -37 ] .寒区土壤水热传输的物理过程较为复杂,涉及多相流动、冰水相态变化、冻胀等,使得描述水热传输过程的本构方程也具有高度的复杂性和非线性,这些都为建模和数值模拟带来了巨大的科学挑战[38 ] .目前,寒区水文模型主要包括基于陆地水文学的寒区分布式水文模型(distributed hydrologic model)[39 ] 和基于水文地质学的寒区水文地质模型(groundwater/hydrogeologic model)[40 ] .寒区分布式水文模型,如CRHM[41 ] 、GBEHM[42 ] 、VIC[43 ] 、HydroSiB2-SF[44 ] 、WEB-DHM-pF[45 ] ,是针对寒区水文循环中子过程/子单元分别建立子模型/模块,并集成至统一的模型框架中.这类模型已尽可能集成了寒区水文循环中的所有环节,但存在空间分辨率较低(千米级)、参数众多难以率定、需要大量观测数据加以验证的问题[46 ] ,且侧重于陆面地表过程,对于地下水文过程仍停留在参数化方案或一维地下水模型层面[47 ] .因此,此类模型无法精细刻画寒区土壤水分运移和热传递的物理过程,对冻融等寒区特殊现象的本质成因和动力学机理研究不够成熟[48 ] .源自地下水科学、水文地质学和冻土水文学发展的寒区水文地质模型(cryo-hydrogeological model)[49 ] ,如SUTRA-ICE[50 -52 ] 、FEFLOW[53 -54 ] 、ATS[55 -56 ] 、Cast3M(www-cast3m.cea.fr)、PFLOTRAN-ICE(www.pflotran.org )、HydroGeoSphere(HGS)[57 -58 ] 等,利用多孔介质渗流和传热理论建立地下水多相流动和热传递的本构方程,并通过土壤水分冻融曲线或基于物理过程的本构关系(例如Clausius-Clapyeron方程)来表征冻融循环对孔隙水相态、土壤孔隙率和渗透性的影响,进而模拟计算土壤水分和温度、地下径流量及其对流域地表径流的补给量等[59 ] .但是,此类模型较为复杂,大多为封装化或商业化软件,较难进行二次开发,且计算精度和效率有待提高. ...
The Variable Infiltration Capacity model version 5 (VIC-5): infrastructure improvements for new applications and reproducibility
1
2018
... 由于寒区环境恶劣、人迹罕至,开展野外观测较为困难,因此,野外水文气象、水文地质和地球物理观测的范围、频率和数据量、数据精度等均受限[32 -34 ] .随着数值模拟和计算机科学的快速发展,基于近几十年积累的观测数据,构建数值模型研究气候和季节变化下的寒区土壤水热传输过程,是理解寒区土壤水文物理过程,揭示其动力学机制的重要工具[35 -37 ] .寒区土壤水热传输的物理过程较为复杂,涉及多相流动、冰水相态变化、冻胀等,使得描述水热传输过程的本构方程也具有高度的复杂性和非线性,这些都为建模和数值模拟带来了巨大的科学挑战[38 ] .目前,寒区水文模型主要包括基于陆地水文学的寒区分布式水文模型(distributed hydrologic model)[39 ] 和基于水文地质学的寒区水文地质模型(groundwater/hydrogeologic model)[40 ] .寒区分布式水文模型,如CRHM[41 ] 、GBEHM[42 ] 、VIC[43 ] 、HydroSiB2-SF[44 ] 、WEB-DHM-pF[45 ] ,是针对寒区水文循环中子过程/子单元分别建立子模型/模块,并集成至统一的模型框架中.这类模型已尽可能集成了寒区水文循环中的所有环节,但存在空间分辨率较低(千米级)、参数众多难以率定、需要大量观测数据加以验证的问题[46 ] ,且侧重于陆面地表过程,对于地下水文过程仍停留在参数化方案或一维地下水模型层面[47 ] .因此,此类模型无法精细刻画寒区土壤水分运移和热传递的物理过程,对冻融等寒区特殊现象的本质成因和动力学机理研究不够成熟[48 ] .源自地下水科学、水文地质学和冻土水文学发展的寒区水文地质模型(cryo-hydrogeological model)[49 ] ,如SUTRA-ICE[50 -52 ] 、FEFLOW[53 -54 ] 、ATS[55 -56 ] 、Cast3M(www-cast3m.cea.fr)、PFLOTRAN-ICE(www.pflotran.org )、HydroGeoSphere(HGS)[57 -58 ] 等,利用多孔介质渗流和传热理论建立地下水多相流动和热传递的本构方程,并通过土壤水分冻融曲线或基于物理过程的本构关系(例如Clausius-Clapyeron方程)来表征冻融循环对孔隙水相态、土壤孔隙率和渗透性的影响,进而模拟计算土壤水分和温度、地下径流量及其对流域地表径流的补给量等[59 ] .但是,此类模型较为复杂,大多为封装化或商业化软件,较难进行二次开发,且计算精度和效率有待提高. ...
Development of a land surface model with coupled snow and frozen soil physics
1
2017
... 由于寒区环境恶劣、人迹罕至,开展野外观测较为困难,因此,野外水文气象、水文地质和地球物理观测的范围、频率和数据量、数据精度等均受限[32 -34 ] .随着数值模拟和计算机科学的快速发展,基于近几十年积累的观测数据,构建数值模型研究气候和季节变化下的寒区土壤水热传输过程,是理解寒区土壤水文物理过程,揭示其动力学机制的重要工具[35 -37 ] .寒区土壤水热传输的物理过程较为复杂,涉及多相流动、冰水相态变化、冻胀等,使得描述水热传输过程的本构方程也具有高度的复杂性和非线性,这些都为建模和数值模拟带来了巨大的科学挑战[38 ] .目前,寒区水文模型主要包括基于陆地水文学的寒区分布式水文模型(distributed hydrologic model)[39 ] 和基于水文地质学的寒区水文地质模型(groundwater/hydrogeologic model)[40 ] .寒区分布式水文模型,如CRHM[41 ] 、GBEHM[42 ] 、VIC[43 ] 、HydroSiB2-SF[44 ] 、WEB-DHM-pF[45 ] ,是针对寒区水文循环中子过程/子单元分别建立子模型/模块,并集成至统一的模型框架中.这类模型已尽可能集成了寒区水文循环中的所有环节,但存在空间分辨率较低(千米级)、参数众多难以率定、需要大量观测数据加以验证的问题[46 ] ,且侧重于陆面地表过程,对于地下水文过程仍停留在参数化方案或一维地下水模型层面[47 ] .因此,此类模型无法精细刻画寒区土壤水分运移和热传递的物理过程,对冻融等寒区特殊现象的本质成因和动力学机理研究不够成熟[48 ] .源自地下水科学、水文地质学和冻土水文学发展的寒区水文地质模型(cryo-hydrogeological model)[49 ] ,如SUTRA-ICE[50 -52 ] 、FEFLOW[53 -54 ] 、ATS[55 -56 ] 、Cast3M(www-cast3m.cea.fr)、PFLOTRAN-ICE(www.pflotran.org )、HydroGeoSphere(HGS)[57 -58 ] 等,利用多孔介质渗流和传热理论建立地下水多相流动和热传递的本构方程,并通过土壤水分冻融曲线或基于物理过程的本构关系(例如Clausius-Clapyeron方程)来表征冻融循环对孔隙水相态、土壤孔隙率和渗透性的影响,进而模拟计算土壤水分和温度、地下径流量及其对流域地表径流的补给量等[59 ] .但是,此类模型较为复杂,大多为封装化或商业化软件,较难进行二次开发,且计算精度和效率有待提高. ...
Improving permafrost physics in a distributed cryosphere-hydrology model and its evaluations at the upper Yellow River basin
1
2020
... 由于寒区环境恶劣、人迹罕至,开展野外观测较为困难,因此,野外水文气象、水文地质和地球物理观测的范围、频率和数据量、数据精度等均受限[32 -34 ] .随着数值模拟和计算机科学的快速发展,基于近几十年积累的观测数据,构建数值模型研究气候和季节变化下的寒区土壤水热传输过程,是理解寒区土壤水文物理过程,揭示其动力学机制的重要工具[35 -37 ] .寒区土壤水热传输的物理过程较为复杂,涉及多相流动、冰水相态变化、冻胀等,使得描述水热传输过程的本构方程也具有高度的复杂性和非线性,这些都为建模和数值模拟带来了巨大的科学挑战[38 ] .目前,寒区水文模型主要包括基于陆地水文学的寒区分布式水文模型(distributed hydrologic model)[39 ] 和基于水文地质学的寒区水文地质模型(groundwater/hydrogeologic model)[40 ] .寒区分布式水文模型,如CRHM[41 ] 、GBEHM[42 ] 、VIC[43 ] 、HydroSiB2-SF[44 ] 、WEB-DHM-pF[45 ] ,是针对寒区水文循环中子过程/子单元分别建立子模型/模块,并集成至统一的模型框架中.这类模型已尽可能集成了寒区水文循环中的所有环节,但存在空间分辨率较低(千米级)、参数众多难以率定、需要大量观测数据加以验证的问题[46 ] ,且侧重于陆面地表过程,对于地下水文过程仍停留在参数化方案或一维地下水模型层面[47 ] .因此,此类模型无法精细刻画寒区土壤水分运移和热传递的物理过程,对冻融等寒区特殊现象的本质成因和动力学机理研究不够成熟[48 ] .源自地下水科学、水文地质学和冻土水文学发展的寒区水文地质模型(cryo-hydrogeological model)[49 ] ,如SUTRA-ICE[50 -52 ] 、FEFLOW[53 -54 ] 、ATS[55 -56 ] 、Cast3M(www-cast3m.cea.fr)、PFLOTRAN-ICE(www.pflotran.org )、HydroGeoSphere(HGS)[57 -58 ] 等,利用多孔介质渗流和传热理论建立地下水多相流动和热传递的本构方程,并通过土壤水分冻融曲线或基于物理过程的本构关系(例如Clausius-Clapyeron方程)来表征冻融循环对孔隙水相态、土壤孔隙率和渗透性的影响,进而模拟计算土壤水分和温度、地下径流量及其对流域地表径流的补给量等[59 ] .但是,此类模型较为复杂,大多为封装化或商业化软件,较难进行二次开发,且计算精度和效率有待提高. ...
Hydrological modelling over the Tibetan Plateau: current status and perspective
1
2014
... 由于寒区环境恶劣、人迹罕至,开展野外观测较为困难,因此,野外水文气象、水文地质和地球物理观测的范围、频率和数据量、数据精度等均受限[32 -34 ] .随着数值模拟和计算机科学的快速发展,基于近几十年积累的观测数据,构建数值模型研究气候和季节变化下的寒区土壤水热传输过程,是理解寒区土壤水文物理过程,揭示其动力学机制的重要工具[35 -37 ] .寒区土壤水热传输的物理过程较为复杂,涉及多相流动、冰水相态变化、冻胀等,使得描述水热传输过程的本构方程也具有高度的复杂性和非线性,这些都为建模和数值模拟带来了巨大的科学挑战[38 ] .目前,寒区水文模型主要包括基于陆地水文学的寒区分布式水文模型(distributed hydrologic model)[39 ] 和基于水文地质学的寒区水文地质模型(groundwater/hydrogeologic model)[40 ] .寒区分布式水文模型,如CRHM[41 ] 、GBEHM[42 ] 、VIC[43 ] 、HydroSiB2-SF[44 ] 、WEB-DHM-pF[45 ] ,是针对寒区水文循环中子过程/子单元分别建立子模型/模块,并集成至统一的模型框架中.这类模型已尽可能集成了寒区水文循环中的所有环节,但存在空间分辨率较低(千米级)、参数众多难以率定、需要大量观测数据加以验证的问题[46 ] ,且侧重于陆面地表过程,对于地下水文过程仍停留在参数化方案或一维地下水模型层面[47 ] .因此,此类模型无法精细刻画寒区土壤水分运移和热传递的物理过程,对冻融等寒区特殊现象的本质成因和动力学机理研究不够成熟[48 ] .源自地下水科学、水文地质学和冻土水文学发展的寒区水文地质模型(cryo-hydrogeological model)[49 ] ,如SUTRA-ICE[50 -52 ] 、FEFLOW[53 -54 ] 、ATS[55 -56 ] 、Cast3M(www-cast3m.cea.fr)、PFLOTRAN-ICE(www.pflotran.org )、HydroGeoSphere(HGS)[57 -58 ] 等,利用多孔介质渗流和传热理论建立地下水多相流动和热传递的本构方程,并通过土壤水分冻融曲线或基于物理过程的本构关系(例如Clausius-Clapyeron方程)来表征冻融循环对孔隙水相态、土壤孔隙率和渗透性的影响,进而模拟计算土壤水分和温度、地下径流量及其对流域地表径流的补给量等[59 ] .但是,此类模型较为复杂,大多为封装化或商业化软件,较难进行二次开发,且计算精度和效率有待提高. ...
青藏高原水文模拟的现状及未来
1
2014
... 由于寒区环境恶劣、人迹罕至,开展野外观测较为困难,因此,野外水文气象、水文地质和地球物理观测的范围、频率和数据量、数据精度等均受限[32 -34 ] .随着数值模拟和计算机科学的快速发展,基于近几十年积累的观测数据,构建数值模型研究气候和季节变化下的寒区土壤水热传输过程,是理解寒区土壤水文物理过程,揭示其动力学机制的重要工具[35 -37 ] .寒区土壤水热传输的物理过程较为复杂,涉及多相流动、冰水相态变化、冻胀等,使得描述水热传输过程的本构方程也具有高度的复杂性和非线性,这些都为建模和数值模拟带来了巨大的科学挑战[38 ] .目前,寒区水文模型主要包括基于陆地水文学的寒区分布式水文模型(distributed hydrologic model)[39 ] 和基于水文地质学的寒区水文地质模型(groundwater/hydrogeologic model)[40 ] .寒区分布式水文模型,如CRHM[41 ] 、GBEHM[42 ] 、VIC[43 ] 、HydroSiB2-SF[44 ] 、WEB-DHM-pF[45 ] ,是针对寒区水文循环中子过程/子单元分别建立子模型/模块,并集成至统一的模型框架中.这类模型已尽可能集成了寒区水文循环中的所有环节,但存在空间分辨率较低(千米级)、参数众多难以率定、需要大量观测数据加以验证的问题[46 ] ,且侧重于陆面地表过程,对于地下水文过程仍停留在参数化方案或一维地下水模型层面[47 ] .因此,此类模型无法精细刻画寒区土壤水分运移和热传递的物理过程,对冻融等寒区特殊现象的本质成因和动力学机理研究不够成熟[48 ] .源自地下水科学、水文地质学和冻土水文学发展的寒区水文地质模型(cryo-hydrogeological model)[49 ] ,如SUTRA-ICE[50 -52 ] 、FEFLOW[53 -54 ] 、ATS[55 -56 ] 、Cast3M(www-cast3m.cea.fr)、PFLOTRAN-ICE(www.pflotran.org )、HydroGeoSphere(HGS)[57 -58 ] 等,利用多孔介质渗流和传热理论建立地下水多相流动和热传递的本构方程,并通过土壤水分冻融曲线或基于物理过程的本构关系(例如Clausius-Clapyeron方程)来表征冻融循环对孔隙水相态、土壤孔隙率和渗透性的影响,进而模拟计算土壤水分和温度、地下径流量及其对流域地表径流的补给量等[59 ] .但是,此类模型较为复杂,大多为封装化或商业化软件,较难进行二次开发,且计算精度和效率有待提高. ...
Understanding the mass, momentum, and energy transfer in the frozen soil with three levels of model complexities
1
2020
... 由于寒区环境恶劣、人迹罕至,开展野外观测较为困难,因此,野外水文气象、水文地质和地球物理观测的范围、频率和数据量、数据精度等均受限[32 -34 ] .随着数值模拟和计算机科学的快速发展,基于近几十年积累的观测数据,构建数值模型研究气候和季节变化下的寒区土壤水热传输过程,是理解寒区土壤水文物理过程,揭示其动力学机制的重要工具[35 -37 ] .寒区土壤水热传输的物理过程较为复杂,涉及多相流动、冰水相态变化、冻胀等,使得描述水热传输过程的本构方程也具有高度的复杂性和非线性,这些都为建模和数值模拟带来了巨大的科学挑战[38 ] .目前,寒区水文模型主要包括基于陆地水文学的寒区分布式水文模型(distributed hydrologic model)[39 ] 和基于水文地质学的寒区水文地质模型(groundwater/hydrogeologic model)[40 ] .寒区分布式水文模型,如CRHM[41 ] 、GBEHM[42 ] 、VIC[43 ] 、HydroSiB2-SF[44 ] 、WEB-DHM-pF[45 ] ,是针对寒区水文循环中子过程/子单元分别建立子模型/模块,并集成至统一的模型框架中.这类模型已尽可能集成了寒区水文循环中的所有环节,但存在空间分辨率较低(千米级)、参数众多难以率定、需要大量观测数据加以验证的问题[46 ] ,且侧重于陆面地表过程,对于地下水文过程仍停留在参数化方案或一维地下水模型层面[47 ] .因此,此类模型无法精细刻画寒区土壤水分运移和热传递的物理过程,对冻融等寒区特殊现象的本质成因和动力学机理研究不够成熟[48 ] .源自地下水科学、水文地质学和冻土水文学发展的寒区水文地质模型(cryo-hydrogeological model)[49 ] ,如SUTRA-ICE[50 -52 ] 、FEFLOW[53 -54 ] 、ATS[55 -56 ] 、Cast3M(www-cast3m.cea.fr)、PFLOTRAN-ICE(www.pflotran.org )、HydroGeoSphere(HGS)[57 -58 ] 等,利用多孔介质渗流和传热理论建立地下水多相流动和热传递的本构方程,并通过土壤水分冻融曲线或基于物理过程的本构关系(例如Clausius-Clapyeron方程)来表征冻融循环对孔隙水相态、土壤孔隙率和渗透性的影响,进而模拟计算土壤水分和温度、地下径流量及其对流域地表径流的补给量等[59 ] .但是,此类模型较为复杂,大多为封装化或商业化软件,较难进行二次开发,且计算精度和效率有待提高. ...
Study of groundwater in permafrost regions of China: status and process
1
2019
... 由于寒区环境恶劣、人迹罕至,开展野外观测较为困难,因此,野外水文气象、水文地质和地球物理观测的范围、频率和数据量、数据精度等均受限[32 -34 ] .随着数值模拟和计算机科学的快速发展,基于近几十年积累的观测数据,构建数值模型研究气候和季节变化下的寒区土壤水热传输过程,是理解寒区土壤水文物理过程,揭示其动力学机制的重要工具[35 -37 ] .寒区土壤水热传输的物理过程较为复杂,涉及多相流动、冰水相态变化、冻胀等,使得描述水热传输过程的本构方程也具有高度的复杂性和非线性,这些都为建模和数值模拟带来了巨大的科学挑战[38 ] .目前,寒区水文模型主要包括基于陆地水文学的寒区分布式水文模型(distributed hydrologic model)[39 ] 和基于水文地质学的寒区水文地质模型(groundwater/hydrogeologic model)[40 ] .寒区分布式水文模型,如CRHM[41 ] 、GBEHM[42 ] 、VIC[43 ] 、HydroSiB2-SF[44 ] 、WEB-DHM-pF[45 ] ,是针对寒区水文循环中子过程/子单元分别建立子模型/模块,并集成至统一的模型框架中.这类模型已尽可能集成了寒区水文循环中的所有环节,但存在空间分辨率较低(千米级)、参数众多难以率定、需要大量观测数据加以验证的问题[46 ] ,且侧重于陆面地表过程,对于地下水文过程仍停留在参数化方案或一维地下水模型层面[47 ] .因此,此类模型无法精细刻画寒区土壤水分运移和热传递的物理过程,对冻融等寒区特殊现象的本质成因和动力学机理研究不够成熟[48 ] .源自地下水科学、水文地质学和冻土水文学发展的寒区水文地质模型(cryo-hydrogeological model)[49 ] ,如SUTRA-ICE[50 -52 ] 、FEFLOW[53 -54 ] 、ATS[55 -56 ] 、Cast3M(www-cast3m.cea.fr)、PFLOTRAN-ICE(www.pflotran.org )、HydroGeoSphere(HGS)[57 -58 ] 等,利用多孔介质渗流和传热理论建立地下水多相流动和热传递的本构方程,并通过土壤水分冻融曲线或基于物理过程的本构关系(例如Clausius-Clapyeron方程)来表征冻融循环对孔隙水相态、土壤孔隙率和渗透性的影响,进而模拟计算土壤水分和温度、地下径流量及其对流域地表径流的补给量等[59 ] .但是,此类模型较为复杂,大多为封装化或商业化软件,较难进行二次开发,且计算精度和效率有待提高. ...
中国冻土地下水研究现状与进展综述
1
2019
... 由于寒区环境恶劣、人迹罕至,开展野外观测较为困难,因此,野外水文气象、水文地质和地球物理观测的范围、频率和数据量、数据精度等均受限[32 -34 ] .随着数值模拟和计算机科学的快速发展,基于近几十年积累的观测数据,构建数值模型研究气候和季节变化下的寒区土壤水热传输过程,是理解寒区土壤水文物理过程,揭示其动力学机制的重要工具[35 -37 ] .寒区土壤水热传输的物理过程较为复杂,涉及多相流动、冰水相态变化、冻胀等,使得描述水热传输过程的本构方程也具有高度的复杂性和非线性,这些都为建模和数值模拟带来了巨大的科学挑战[38 ] .目前,寒区水文模型主要包括基于陆地水文学的寒区分布式水文模型(distributed hydrologic model)[39 ] 和基于水文地质学的寒区水文地质模型(groundwater/hydrogeologic model)[40 ] .寒区分布式水文模型,如CRHM[41 ] 、GBEHM[42 ] 、VIC[43 ] 、HydroSiB2-SF[44 ] 、WEB-DHM-pF[45 ] ,是针对寒区水文循环中子过程/子单元分别建立子模型/模块,并集成至统一的模型框架中.这类模型已尽可能集成了寒区水文循环中的所有环节,但存在空间分辨率较低(千米级)、参数众多难以率定、需要大量观测数据加以验证的问题[46 ] ,且侧重于陆面地表过程,对于地下水文过程仍停留在参数化方案或一维地下水模型层面[47 ] .因此,此类模型无法精细刻画寒区土壤水分运移和热传递的物理过程,对冻融等寒区特殊现象的本质成因和动力学机理研究不够成熟[48 ] .源自地下水科学、水文地质学和冻土水文学发展的寒区水文地质模型(cryo-hydrogeological model)[49 ] ,如SUTRA-ICE[50 -52 ] 、FEFLOW[53 -54 ] 、ATS[55 -56 ] 、Cast3M(www-cast3m.cea.fr)、PFLOTRAN-ICE(www.pflotran.org )、HydroGeoSphere(HGS)[57 -58 ] 等,利用多孔介质渗流和传热理论建立地下水多相流动和热传递的本构方程,并通过土壤水分冻融曲线或基于物理过程的本构关系(例如Clausius-Clapyeron方程)来表征冻融循环对孔隙水相态、土壤孔隙率和渗透性的影响,进而模拟计算土壤水分和温度、地下径流量及其对流域地表径流的补给量等[59 ] .但是,此类模型较为复杂,大多为封装化或商业化软件,较难进行二次开发,且计算精度和效率有待提高. ...
Groundwater flow and heat transport for systems undergoing freeze-thaw: intercomparison of numerical simulators for 2D test cases
11
2018
... 由于寒区环境恶劣、人迹罕至,开展野外观测较为困难,因此,野外水文气象、水文地质和地球物理观测的范围、频率和数据量、数据精度等均受限[32 -34 ] .随着数值模拟和计算机科学的快速发展,基于近几十年积累的观测数据,构建数值模型研究气候和季节变化下的寒区土壤水热传输过程,是理解寒区土壤水文物理过程,揭示其动力学机制的重要工具[35 -37 ] .寒区土壤水热传输的物理过程较为复杂,涉及多相流动、冰水相态变化、冻胀等,使得描述水热传输过程的本构方程也具有高度的复杂性和非线性,这些都为建模和数值模拟带来了巨大的科学挑战[38 ] .目前,寒区水文模型主要包括基于陆地水文学的寒区分布式水文模型(distributed hydrologic model)[39 ] 和基于水文地质学的寒区水文地质模型(groundwater/hydrogeologic model)[40 ] .寒区分布式水文模型,如CRHM[41 ] 、GBEHM[42 ] 、VIC[43 ] 、HydroSiB2-SF[44 ] 、WEB-DHM-pF[45 ] ,是针对寒区水文循环中子过程/子单元分别建立子模型/模块,并集成至统一的模型框架中.这类模型已尽可能集成了寒区水文循环中的所有环节,但存在空间分辨率较低(千米级)、参数众多难以率定、需要大量观测数据加以验证的问题[46 ] ,且侧重于陆面地表过程,对于地下水文过程仍停留在参数化方案或一维地下水模型层面[47 ] .因此,此类模型无法精细刻画寒区土壤水分运移和热传递的物理过程,对冻融等寒区特殊现象的本质成因和动力学机理研究不够成熟[48 ] .源自地下水科学、水文地质学和冻土水文学发展的寒区水文地质模型(cryo-hydrogeological model)[49 ] ,如SUTRA-ICE[50 -52 ] 、FEFLOW[53 -54 ] 、ATS[55 -56 ] 、Cast3M(www-cast3m.cea.fr)、PFLOTRAN-ICE(www.pflotran.org )、HydroGeoSphere(HGS)[57 -58 ] 等,利用多孔介质渗流和传热理论建立地下水多相流动和热传递的本构方程,并通过土壤水分冻融曲线或基于物理过程的本构关系(例如Clausius-Clapyeron方程)来表征冻融循环对孔隙水相态、土壤孔隙率和渗透性的影响,进而模拟计算土壤水分和温度、地下径流量及其对流域地表径流的补给量等[59 ] .但是,此类模型较为复杂,大多为封装化或商业化软件,较难进行二次开发,且计算精度和效率有待提高. ...
... 考虑水的可压缩性[49 ] ,引入压缩系数β = 1 ρ w ∂ ρ w ∂ P P 为压力,则式(1) 变为 ...
... 式(6) 描述了相对导水率K r (T )与固态含冰量θ i (T )之间的关系,原理是在冻结期由于土壤水成冰导致土壤孔隙变小,进而影响土壤水迁移[69 ] .此外,固态含冰量θ i T = ε - θ w T θ w 是与温度T 相关的变量θ w (T ),通常用经验函数来表示两者之间的关系,即土壤冻结特征曲线[70 ] .本模型中采用最为常用的指数形式的经验函数[49 ,51 ,64 ] 来表示. ...
... 描述传热过程的能量守恒方程[49 ] 为 ...
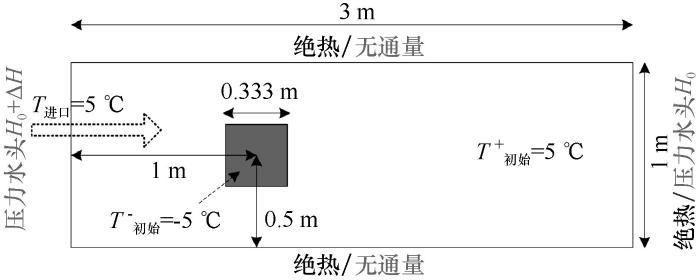
... 如
图5 所示,整个计算区域长为3 m,宽为1 m,在内部有一边长为0.333 m的正方形冰块.左侧入口处设置为恒定的5 ℃,其他边界均为绝热边界,除了蓝色冰块为-5 ℃,其他区域温度均为5 ℃.而针对压力水头边界条件,在左侧入口与右侧出口边界分别设置为固定值0.09 m、0 m,上下边界均为无通量边界,内部初始值与右侧出口边界的值相同,其他相关参数见
表3 .在压力和温度的驱动下,初始处于冻结状态的冰块将慢慢融化.
图5 冰包裹体融化算例的计算区域及边界条件<sup>[<xref ref-type="bibr" rid="R49">49</xref>]</sup>(灰色字为流动边界条件,黑色字为传热边界条件) Melting of ice inclusion case: computational domain, initial and boundary conditions<sup>[<xref ref-type="bibr" rid="R49">49</xref>]</sup> (gray characters: flow, black characters: heat transfer) Fig.5 ![]()
表3 两个基准测试算例中的参数设置 ...
... [
49 ] (gray characters: flow, black characters: heat transfer)
Fig.5 ![]()
表3 两个基准测试算例中的参数设置 ...
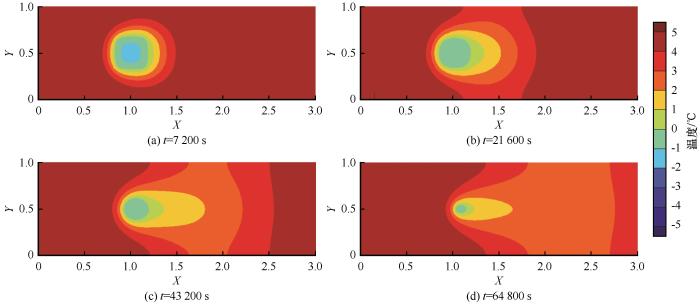
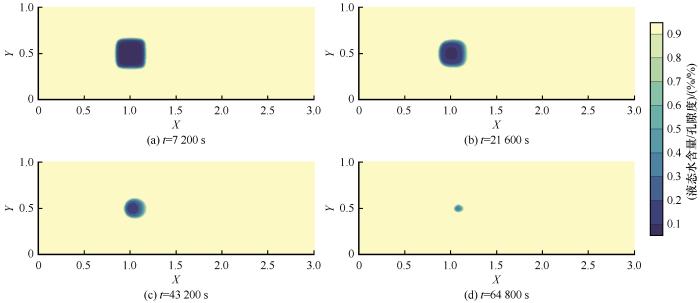
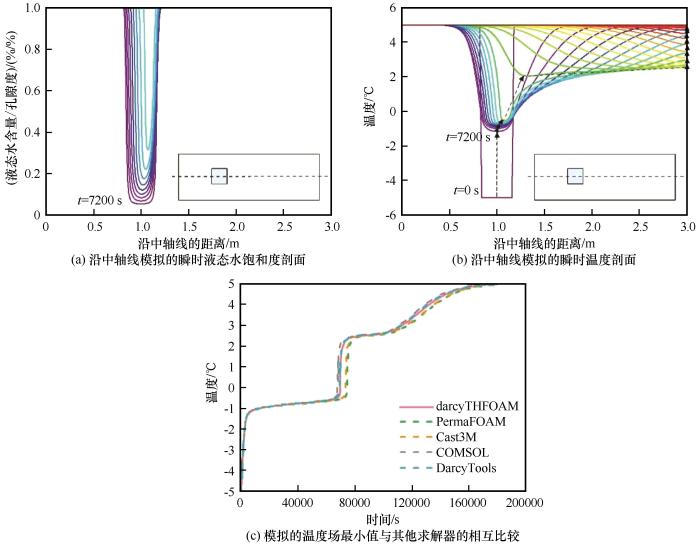
... 图6 和图7 分别展示了温度和液态水饱和度(液态水含量/孔隙度)随时间的变化,进而反映了冰块在不同时刻的融化情况.在冰块融化过程中,沿计算区域中心线的液态水饱和度如图8 (a)所示,从上到下是从初始到最终时刻的液态水饱和度,最后全部融化,与顶部坐标轴完全重合;沿计算区域中心线的温度如图8 (b)所示,从下到上表示初始和最终时刻的温度,黑色箭头表示温度剖面的变化.在压力水头梯度的驱动下,融化加速,较冷的流体通过平流和热扩散向下游输送,最终达到与初始条件相同的温度(5 ℃).为了更好地将温度的时空变化与Interfrost中给出的其他模型的结果进行量化对比,参照Grenier等[49 ] 中的评价指标,选取了计算区域的最低温度进行对比.此外,其他模型或软件的数值方案及网格划分情况已经总结在表4 中.结果表明,darcyTHFOAM模拟的最低温度与其他模型预测的最低温度一致[图8 (c)]. ...
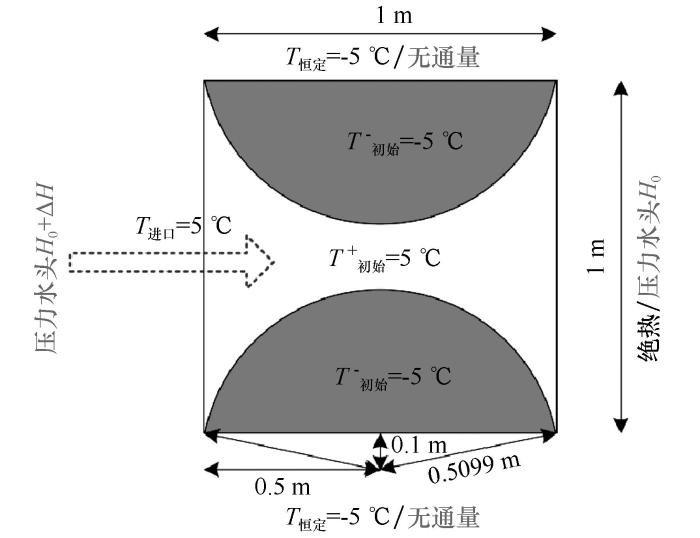
... 贯穿融区(“天窗”)存在于湖泊或河流下面的多年冻土中,是多年冻土内的局部融化区[77 -80 ] .该基准测试算例取材于自然界中冻土的典型特征,兼具代表性与适用性[49 ] ,能够反映出多年冻土中贯穿融区的演变过程.两个起始冻结的半圆形区域(半径为0.5099 m)温度都是-5 ℃,代表了两部分冻土,均位于一个正方形计算域内(1 m×1 m).最初,计算区域的背景温度为5 ℃,左侧入口边界赋予固定值5 ℃,上下边界赋予固定值-5 ℃(图9 ),右侧出口边界为绝热边界,压力边界条件与上一个冰包裹体融化算例的相同,其他相关参数见表3 . ...
... [
49 ](灰色字为流动边界条件,黑色字为传热边界条件)
Talik opening/closure case: computational domain, initial and boundary conditions<sup>[<xref ref-type="bibr" rid="R49">49</xref>]</sup> (gray characters: flow, black characters: heat transfer) Fig.9 ![]()
经过网格分辨率测试,整个计算区域最终被划分为100×100个网格,起始时间步长为0.1 s,在计算的过程可自动调整,最大时间步长设置为1 000 s.对于每个时间步长,压力和温度的收敛标准均设置为1×10⁻¹⁰ .在求解压力的Picard循环中,最大迭代次数和最大误差分别设置为20和1×10⁻³ ,而在求解温度的Picard循环中,最大迭代次数和最大误差分别设置为50和1×10⁻⁵ .为提高计算效率,将计算区域分为了4部分,在天河二号超级计算器上采用1个核(共4个节点)进行仿真模拟计算,最终耗费2 min完成了40 h的融区演变过程模拟. ...
... [
49 ] (gray characters: flow, black characters: heat transfer)
Fig.9 ![]()
经过网格分辨率测试,整个计算区域最终被划分为100×100个网格,起始时间步长为0.1 s,在计算的过程可自动调整,最大时间步长设置为1 000 s.对于每个时间步长,压力和温度的收敛标准均设置为1×10⁻¹⁰ .在求解压力的Picard循环中,最大迭代次数和最大误差分别设置为20和1×10⁻³ ,而在求解温度的Picard循环中,最大迭代次数和最大误差分别设置为50和1×10⁻⁵ .为提高计算效率,将计算区域分为了4部分,在天河二号超级计算器上采用1个核(共4个节点)进行仿真模拟计算,最终耗费2 min完成了40 h的融区演变过程模拟. ...
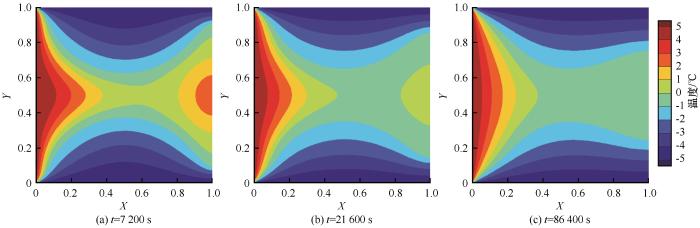
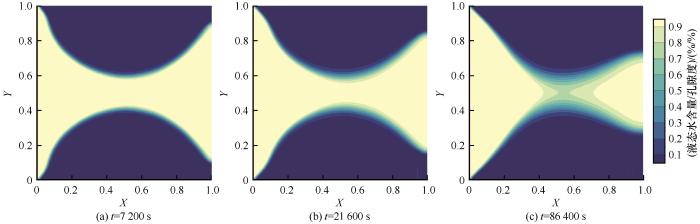
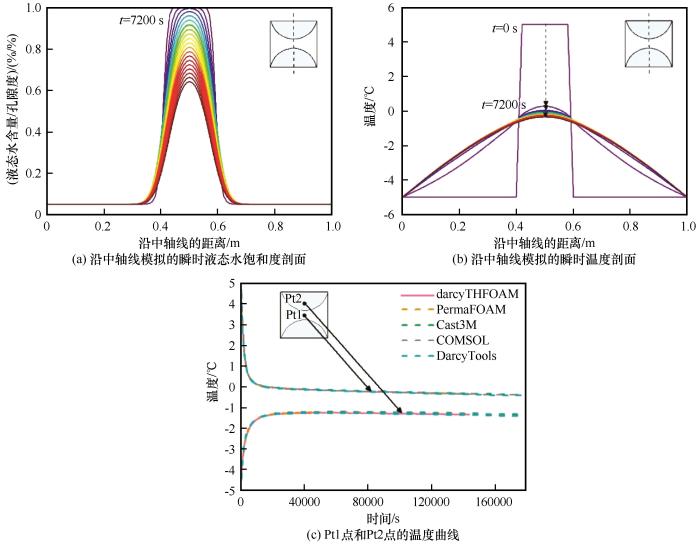
... 不同时刻的温度和液态水饱和度分布情况如图10 和图11 所示,计算区域中心垂直线上的液态水饱和度和温度变化如图12 (a)和图12 (b)所示,从上到下依次代表,从初始到终止时刻,其中,黑色箭头表示温度剖面的旋转.在温度与压力的驱动下,两个最初冻结的半圆区域逐渐融化.为了将darcyTHFOAM的模拟结果与Grenier等[49 ] 中其他求解器的模拟数据进行定量比较,在图12 (c)中绘制了两个选定位置(Pt1点和Pt2点)的温度曲线.这两个点都接近冻结区和非冻结区之间的初始边界,对融区的贯通/闭合过程非常敏感.结果表明,这两点处的温度变化与其他模型模拟的结果非常一致,再次证明了模型的可靠性. ...
Water tracks enhance water flow above permafrost in upland Arctic Alaska hillslopes
1
2020
... 由于寒区环境恶劣、人迹罕至,开展野外观测较为困难,因此,野外水文气象、水文地质和地球物理观测的范围、频率和数据量、数据精度等均受限[32 -34 ] .随着数值模拟和计算机科学的快速发展,基于近几十年积累的观测数据,构建数值模型研究气候和季节变化下的寒区土壤水热传输过程,是理解寒区土壤水文物理过程,揭示其动力学机制的重要工具[35 -37 ] .寒区土壤水热传输的物理过程较为复杂,涉及多相流动、冰水相态变化、冻胀等,使得描述水热传输过程的本构方程也具有高度的复杂性和非线性,这些都为建模和数值模拟带来了巨大的科学挑战[38 ] .目前,寒区水文模型主要包括基于陆地水文学的寒区分布式水文模型(distributed hydrologic model)[39 ] 和基于水文地质学的寒区水文地质模型(groundwater/hydrogeologic model)[40 ] .寒区分布式水文模型,如CRHM[41 ] 、GBEHM[42 ] 、VIC[43 ] 、HydroSiB2-SF[44 ] 、WEB-DHM-pF[45 ] ,是针对寒区水文循环中子过程/子单元分别建立子模型/模块,并集成至统一的模型框架中.这类模型已尽可能集成了寒区水文循环中的所有环节,但存在空间分辨率较低(千米级)、参数众多难以率定、需要大量观测数据加以验证的问题[46 ] ,且侧重于陆面地表过程,对于地下水文过程仍停留在参数化方案或一维地下水模型层面[47 ] .因此,此类模型无法精细刻画寒区土壤水分运移和热传递的物理过程,对冻融等寒区特殊现象的本质成因和动力学机理研究不够成熟[48 ] .源自地下水科学、水文地质学和冻土水文学发展的寒区水文地质模型(cryo-hydrogeological model)[49 ] ,如SUTRA-ICE[50 -52 ] 、FEFLOW[53 -54 ] 、ATS[55 -56 ] 、Cast3M(www-cast3m.cea.fr)、PFLOTRAN-ICE(www.pflotran.org )、HydroGeoSphere(HGS)[57 -58 ] 等,利用多孔介质渗流和传热理论建立地下水多相流动和热传递的本构方程,并通过土壤水分冻融曲线或基于物理过程的本构关系(例如Clausius-Clapyeron方程)来表征冻融循环对孔隙水相态、土壤孔隙率和渗透性的影响,进而模拟计算土壤水分和温度、地下径流量及其对流域地表径流的补给量等[59 ] .但是,此类模型较为复杂,大多为封装化或商业化软件,较难进行二次开发,且计算精度和效率有待提高. ...
Contrasting hydrogeologic responses to warming in permafrost and seasonally frozen ground hillslopes
2
2016
... 式中:K r (T )为与土壤冻结相关的相对导水率,可表示[51 ,68 ] 为 ...
... 式(6) 描述了相对导水率K r (T )与固态含冰量θ i (T )之间的关系,原理是在冻结期由于土壤水成冰导致土壤孔隙变小,进而影响土壤水迁移[69 ] .此外,固态含冰量θ i T = ε - θ w T θ w 是与温度T 相关的变量θ w (T ),通常用经验函数来表示两者之间的关系,即土壤冻结特征曲线[70 ] .本模型中采用最为常用的指数形式的经验函数[49 ,51 ,64 ] 来表示. ...
Permafrost thaw in a nested groundwater-flow system
1
2013
... 由于寒区环境恶劣、人迹罕至,开展野外观测较为困难,因此,野外水文气象、水文地质和地球物理观测的范围、频率和数据量、数据精度等均受限[32 -34 ] .随着数值模拟和计算机科学的快速发展,基于近几十年积累的观测数据,构建数值模型研究气候和季节变化下的寒区土壤水热传输过程,是理解寒区土壤水文物理过程,揭示其动力学机制的重要工具[35 -37 ] .寒区土壤水热传输的物理过程较为复杂,涉及多相流动、冰水相态变化、冻胀等,使得描述水热传输过程的本构方程也具有高度的复杂性和非线性,这些都为建模和数值模拟带来了巨大的科学挑战[38 ] .目前,寒区水文模型主要包括基于陆地水文学的寒区分布式水文模型(distributed hydrologic model)[39 ] 和基于水文地质学的寒区水文地质模型(groundwater/hydrogeologic model)[40 ] .寒区分布式水文模型,如CRHM[41 ] 、GBEHM[42 ] 、VIC[43 ] 、HydroSiB2-SF[44 ] 、WEB-DHM-pF[45 ] ,是针对寒区水文循环中子过程/子单元分别建立子模型/模块,并集成至统一的模型框架中.这类模型已尽可能集成了寒区水文循环中的所有环节,但存在空间分辨率较低(千米级)、参数众多难以率定、需要大量观测数据加以验证的问题[46 ] ,且侧重于陆面地表过程,对于地下水文过程仍停留在参数化方案或一维地下水模型层面[47 ] .因此,此类模型无法精细刻画寒区土壤水分运移和热传递的物理过程,对冻融等寒区特殊现象的本质成因和动力学机理研究不够成熟[48 ] .源自地下水科学、水文地质学和冻土水文学发展的寒区水文地质模型(cryo-hydrogeological model)[49 ] ,如SUTRA-ICE[50 -52 ] 、FEFLOW[53 -54 ] 、ATS[55 -56 ] 、Cast3M(www-cast3m.cea.fr)、PFLOTRAN-ICE(www.pflotran.org )、HydroGeoSphere(HGS)[57 -58 ] 等,利用多孔介质渗流和传热理论建立地下水多相流动和热传递的本构方程,并通过土壤水分冻融曲线或基于物理过程的本构关系(例如Clausius-Clapyeron方程)来表征冻融循环对孔隙水相态、土壤孔隙率和渗透性的影响,进而模拟计算土壤水分和温度、地下径流量及其对流域地表径流的补给量等[59 ] .但是,此类模型较为复杂,大多为封装化或商业化软件,较难进行二次开发,且计算精度和效率有待提高. ...
The impact of land surface temperatures on suprapermafrost groundwater on the central Qinghai-Tibet Plateau
1
2020
... 由于寒区环境恶劣、人迹罕至,开展野外观测较为困难,因此,野外水文气象、水文地质和地球物理观测的范围、频率和数据量、数据精度等均受限[32 -34 ] .随着数值模拟和计算机科学的快速发展,基于近几十年积累的观测数据,构建数值模型研究气候和季节变化下的寒区土壤水热传输过程,是理解寒区土壤水文物理过程,揭示其动力学机制的重要工具[35 -37 ] .寒区土壤水热传输的物理过程较为复杂,涉及多相流动、冰水相态变化、冻胀等,使得描述水热传输过程的本构方程也具有高度的复杂性和非线性,这些都为建模和数值模拟带来了巨大的科学挑战[38 ] .目前,寒区水文模型主要包括基于陆地水文学的寒区分布式水文模型(distributed hydrologic model)[39 ] 和基于水文地质学的寒区水文地质模型(groundwater/hydrogeologic model)[40 ] .寒区分布式水文模型,如CRHM[41 ] 、GBEHM[42 ] 、VIC[43 ] 、HydroSiB2-SF[44 ] 、WEB-DHM-pF[45 ] ,是针对寒区水文循环中子过程/子单元分别建立子模型/模块,并集成至统一的模型框架中.这类模型已尽可能集成了寒区水文循环中的所有环节,但存在空间分辨率较低(千米级)、参数众多难以率定、需要大量观测数据加以验证的问题[46 ] ,且侧重于陆面地表过程,对于地下水文过程仍停留在参数化方案或一维地下水模型层面[47 ] .因此,此类模型无法精细刻画寒区土壤水分运移和热传递的物理过程,对冻融等寒区特殊现象的本质成因和动力学机理研究不够成熟[48 ] .源自地下水科学、水文地质学和冻土水文学发展的寒区水文地质模型(cryo-hydrogeological model)[49 ] ,如SUTRA-ICE[50 -52 ] 、FEFLOW[53 -54 ] 、ATS[55 -56 ] 、Cast3M(www-cast3m.cea.fr)、PFLOTRAN-ICE(www.pflotran.org )、HydroGeoSphere(HGS)[57 -58 ] 等,利用多孔介质渗流和传热理论建立地下水多相流动和热传递的本构方程,并通过土壤水分冻融曲线或基于物理过程的本构关系(例如Clausius-Clapyeron方程)来表征冻融循环对孔隙水相态、土壤孔隙率和渗透性的影响,进而模拟计算土壤水分和温度、地下径流量及其对流域地表径流的补给量等[59 ] .但是,此类模型较为复杂,大多为封装化或商业化软件,较难进行二次开发,且计算精度和效率有待提高. ...
1
2014
... 由于寒区环境恶劣、人迹罕至,开展野外观测较为困难,因此,野外水文气象、水文地质和地球物理观测的范围、频率和数据量、数据精度等均受限[32 -34 ] .随着数值模拟和计算机科学的快速发展,基于近几十年积累的观测数据,构建数值模型研究气候和季节变化下的寒区土壤水热传输过程,是理解寒区土壤水文物理过程,揭示其动力学机制的重要工具[35 -37 ] .寒区土壤水热传输的物理过程较为复杂,涉及多相流动、冰水相态变化、冻胀等,使得描述水热传输过程的本构方程也具有高度的复杂性和非线性,这些都为建模和数值模拟带来了巨大的科学挑战[38 ] .目前,寒区水文模型主要包括基于陆地水文学的寒区分布式水文模型(distributed hydrologic model)[39 ] 和基于水文地质学的寒区水文地质模型(groundwater/hydrogeologic model)[40 ] .寒区分布式水文模型,如CRHM[41 ] 、GBEHM[42 ] 、VIC[43 ] 、HydroSiB2-SF[44 ] 、WEB-DHM-pF[45 ] ,是针对寒区水文循环中子过程/子单元分别建立子模型/模块,并集成至统一的模型框架中.这类模型已尽可能集成了寒区水文循环中的所有环节,但存在空间分辨率较低(千米级)、参数众多难以率定、需要大量观测数据加以验证的问题[46 ] ,且侧重于陆面地表过程,对于地下水文过程仍停留在参数化方案或一维地下水模型层面[47 ] .因此,此类模型无法精细刻画寒区土壤水分运移和热传递的物理过程,对冻融等寒区特殊现象的本质成因和动力学机理研究不够成熟[48 ] .源自地下水科学、水文地质学和冻土水文学发展的寒区水文地质模型(cryo-hydrogeological model)[49 ] ,如SUTRA-ICE[50 -52 ] 、FEFLOW[53 -54 ] 、ATS[55 -56 ] 、Cast3M(www-cast3m.cea.fr)、PFLOTRAN-ICE(www.pflotran.org )、HydroGeoSphere(HGS)[57 -58 ] 等,利用多孔介质渗流和传热理论建立地下水多相流动和热传递的本构方程,并通过土壤水分冻融曲线或基于物理过程的本构关系(例如Clausius-Clapyeron方程)来表征冻融循环对孔隙水相态、土壤孔隙率和渗透性的影响,进而模拟计算土壤水分和温度、地下径流量及其对流域地表径流的补给量等[59 ] .但是,此类模型较为复杂,大多为封装化或商业化软件,较难进行二次开发,且计算精度和效率有待提高. ...
Evaluating integrated surface/subsurface permafrost thermal hydrology models in ATS (v0.88) against observations from a polygonal tundra site
1
2020
... 由于寒区环境恶劣、人迹罕至,开展野外观测较为困难,因此,野外水文气象、水文地质和地球物理观测的范围、频率和数据量、数据精度等均受限[32 -34 ] .随着数值模拟和计算机科学的快速发展,基于近几十年积累的观测数据,构建数值模型研究气候和季节变化下的寒区土壤水热传输过程,是理解寒区土壤水文物理过程,揭示其动力学机制的重要工具[35 -37 ] .寒区土壤水热传输的物理过程较为复杂,涉及多相流动、冰水相态变化、冻胀等,使得描述水热传输过程的本构方程也具有高度的复杂性和非线性,这些都为建模和数值模拟带来了巨大的科学挑战[38 ] .目前,寒区水文模型主要包括基于陆地水文学的寒区分布式水文模型(distributed hydrologic model)[39 ] 和基于水文地质学的寒区水文地质模型(groundwater/hydrogeologic model)[40 ] .寒区分布式水文模型,如CRHM[41 ] 、GBEHM[42 ] 、VIC[43 ] 、HydroSiB2-SF[44 ] 、WEB-DHM-pF[45 ] ,是针对寒区水文循环中子过程/子单元分别建立子模型/模块,并集成至统一的模型框架中.这类模型已尽可能集成了寒区水文循环中的所有环节,但存在空间分辨率较低(千米级)、参数众多难以率定、需要大量观测数据加以验证的问题[46 ] ,且侧重于陆面地表过程,对于地下水文过程仍停留在参数化方案或一维地下水模型层面[47 ] .因此,此类模型无法精细刻画寒区土壤水分运移和热传递的物理过程,对冻融等寒区特殊现象的本质成因和动力学机理研究不够成熟[48 ] .源自地下水科学、水文地质学和冻土水文学发展的寒区水文地质模型(cryo-hydrogeological model)[49 ] ,如SUTRA-ICE[50 -52 ] 、FEFLOW[53 -54 ] 、ATS[55 -56 ] 、Cast3M(www-cast3m.cea.fr)、PFLOTRAN-ICE(www.pflotran.org )、HydroGeoSphere(HGS)[57 -58 ] 等,利用多孔介质渗流和传热理论建立地下水多相流动和热传递的本构方程,并通过土壤水分冻融曲线或基于物理过程的本构关系(例如Clausius-Clapyeron方程)来表征冻融循环对孔隙水相态、土壤孔隙率和渗透性的影响,进而模拟计算土壤水分和温度、地下径流量及其对流域地表径流的补给量等[59 ] .但是,此类模型较为复杂,大多为封装化或商业化软件,较难进行二次开发,且计算精度和效率有待提高. ...
Using field observations to inform thermal hydrology models of permafrost dynamics with ATS (v0.83)
1
2015
... 由于寒区环境恶劣、人迹罕至,开展野外观测较为困难,因此,野外水文气象、水文地质和地球物理观测的范围、频率和数据量、数据精度等均受限[32 -34 ] .随着数值模拟和计算机科学的快速发展,基于近几十年积累的观测数据,构建数值模型研究气候和季节变化下的寒区土壤水热传输过程,是理解寒区土壤水文物理过程,揭示其动力学机制的重要工具[35 -37 ] .寒区土壤水热传输的物理过程较为复杂,涉及多相流动、冰水相态变化、冻胀等,使得描述水热传输过程的本构方程也具有高度的复杂性和非线性,这些都为建模和数值模拟带来了巨大的科学挑战[38 ] .目前,寒区水文模型主要包括基于陆地水文学的寒区分布式水文模型(distributed hydrologic model)[39 ] 和基于水文地质学的寒区水文地质模型(groundwater/hydrogeologic model)[40 ] .寒区分布式水文模型,如CRHM[41 ] 、GBEHM[42 ] 、VIC[43 ] 、HydroSiB2-SF[44 ] 、WEB-DHM-pF[45 ] ,是针对寒区水文循环中子过程/子单元分别建立子模型/模块,并集成至统一的模型框架中.这类模型已尽可能集成了寒区水文循环中的所有环节,但存在空间分辨率较低(千米级)、参数众多难以率定、需要大量观测数据加以验证的问题[46 ] ,且侧重于陆面地表过程,对于地下水文过程仍停留在参数化方案或一维地下水模型层面[47 ] .因此,此类模型无法精细刻画寒区土壤水分运移和热传递的物理过程,对冻融等寒区特殊现象的本质成因和动力学机理研究不够成熟[48 ] .源自地下水科学、水文地质学和冻土水文学发展的寒区水文地质模型(cryo-hydrogeological model)[49 ] ,如SUTRA-ICE[50 -52 ] 、FEFLOW[53 -54 ] 、ATS[55 -56 ] 、Cast3M(www-cast3m.cea.fr)、PFLOTRAN-ICE(www.pflotran.org )、HydroGeoSphere(HGS)[57 -58 ] 等,利用多孔介质渗流和传热理论建立地下水多相流动和热传递的本构方程,并通过土壤水分冻融曲线或基于物理过程的本构关系(例如Clausius-Clapyeron方程)来表征冻融循环对孔隙水相态、土壤孔隙率和渗透性的影响,进而模拟计算土壤水分和温度、地下径流量及其对流域地表径流的补给量等[59 ] .但是,此类模型较为复杂,大多为封装化或商业化软件,较难进行二次开发,且计算精度和效率有待提高. ...
Integrated hydrological modeling of climate change impacts in a snow-influenced catchment
1
2019
... 由于寒区环境恶劣、人迹罕至,开展野外观测较为困难,因此,野外水文气象、水文地质和地球物理观测的范围、频率和数据量、数据精度等均受限[32 -34 ] .随着数值模拟和计算机科学的快速发展,基于近几十年积累的观测数据,构建数值模型研究气候和季节变化下的寒区土壤水热传输过程,是理解寒区土壤水文物理过程,揭示其动力学机制的重要工具[35 -37 ] .寒区土壤水热传输的物理过程较为复杂,涉及多相流动、冰水相态变化、冻胀等,使得描述水热传输过程的本构方程也具有高度的复杂性和非线性,这些都为建模和数值模拟带来了巨大的科学挑战[38 ] .目前,寒区水文模型主要包括基于陆地水文学的寒区分布式水文模型(distributed hydrologic model)[39 ] 和基于水文地质学的寒区水文地质模型(groundwater/hydrogeologic model)[40 ] .寒区分布式水文模型,如CRHM[41 ] 、GBEHM[42 ] 、VIC[43 ] 、HydroSiB2-SF[44 ] 、WEB-DHM-pF[45 ] ,是针对寒区水文循环中子过程/子单元分别建立子模型/模块,并集成至统一的模型框架中.这类模型已尽可能集成了寒区水文循环中的所有环节,但存在空间分辨率较低(千米级)、参数众多难以率定、需要大量观测数据加以验证的问题[46 ] ,且侧重于陆面地表过程,对于地下水文过程仍停留在参数化方案或一维地下水模型层面[47 ] .因此,此类模型无法精细刻画寒区土壤水分运移和热传递的物理过程,对冻融等寒区特殊现象的本质成因和动力学机理研究不够成熟[48 ] .源自地下水科学、水文地质学和冻土水文学发展的寒区水文地质模型(cryo-hydrogeological model)[49 ] ,如SUTRA-ICE[50 -52 ] 、FEFLOW[53 -54 ] 、ATS[55 -56 ] 、Cast3M(www-cast3m.cea.fr)、PFLOTRAN-ICE(www.pflotran.org )、HydroGeoSphere(HGS)[57 -58 ] 等,利用多孔介质渗流和传热理论建立地下水多相流动和热传递的本构方程,并通过土壤水分冻融曲线或基于物理过程的本构关系(例如Clausius-Clapyeron方程)来表征冻融循环对孔隙水相态、土壤孔隙率和渗透性的影响,进而模拟计算土壤水分和温度、地下径流量及其对流域地表径流的补给量等[59 ] .但是,此类模型较为复杂,大多为封装化或商业化软件,较难进行二次开发,且计算精度和效率有待提高. ...
2
2017
... 由于寒区环境恶劣、人迹罕至,开展野外观测较为困难,因此,野外水文气象、水文地质和地球物理观测的范围、频率和数据量、数据精度等均受限[32 -34 ] .随着数值模拟和计算机科学的快速发展,基于近几十年积累的观测数据,构建数值模型研究气候和季节变化下的寒区土壤水热传输过程,是理解寒区土壤水文物理过程,揭示其动力学机制的重要工具[35 -37 ] .寒区土壤水热传输的物理过程较为复杂,涉及多相流动、冰水相态变化、冻胀等,使得描述水热传输过程的本构方程也具有高度的复杂性和非线性,这些都为建模和数值模拟带来了巨大的科学挑战[38 ] .目前,寒区水文模型主要包括基于陆地水文学的寒区分布式水文模型(distributed hydrologic model)[39 ] 和基于水文地质学的寒区水文地质模型(groundwater/hydrogeologic model)[40 ] .寒区分布式水文模型,如CRHM[41 ] 、GBEHM[42 ] 、VIC[43 ] 、HydroSiB2-SF[44 ] 、WEB-DHM-pF[45 ] ,是针对寒区水文循环中子过程/子单元分别建立子模型/模块,并集成至统一的模型框架中.这类模型已尽可能集成了寒区水文循环中的所有环节,但存在空间分辨率较低(千米级)、参数众多难以率定、需要大量观测数据加以验证的问题[46 ] ,且侧重于陆面地表过程,对于地下水文过程仍停留在参数化方案或一维地下水模型层面[47 ] .因此,此类模型无法精细刻画寒区土壤水分运移和热传递的物理过程,对冻融等寒区特殊现象的本质成因和动力学机理研究不够成熟[48 ] .源自地下水科学、水文地质学和冻土水文学发展的寒区水文地质模型(cryo-hydrogeological model)[49 ] ,如SUTRA-ICE[50 -52 ] 、FEFLOW[53 -54 ] 、ATS[55 -56 ] 、Cast3M(www-cast3m.cea.fr)、PFLOTRAN-ICE(www.pflotran.org )、HydroGeoSphere(HGS)[57 -58 ] 等,利用多孔介质渗流和传热理论建立地下水多相流动和热传递的本构方程,并通过土壤水分冻融曲线或基于物理过程的本构关系(例如Clausius-Clapyeron方程)来表征冻融循环对孔隙水相态、土壤孔隙率和渗透性的影响,进而模拟计算土壤水分和温度、地下径流量及其对流域地表径流的补给量等[59 ] .但是,此类模型较为复杂,大多为封装化或商业化软件,较难进行二次开发,且计算精度和效率有待提高. ...
... 综上所述,气候变化影响下的寒区土壤水文过程较为复杂,包括多相流动、传热和冰水相态变化等.虽然寒区分布式水文模型近年来发展较快,但多将土壤水文过程进行了不同程度的简化,且在模型建立、计算精度、并行计算效率等方面有待改进.此外,几类主流的寒区水文地质模型多为封装化或商业化软件,大大限制了模型的应用和推广.因此,亟需自主研发更稳定高效、高精度、支持并行计算、便于二次开发的开源寒区土壤水热耦合模型,精细刻画土壤温度、含水量与含冰量的时空动态变化,深入理解寒区土壤水文过程.此外,不同类别的寒区水文模型的研究对象和用途不尽相同,同一类别内的模型所选用的水文物理过程表征方式、参数化方案、数值离散方法和网格类型等也千差万别,其准确性和物理意义上的真实性均需校验[58 ] .本研究旨在基于寒区土壤水文物理过程和计算流体力学方法(computational fluid dynamics,CFD),利用大型并行开源软件OpenFOAM® (www.openfoam.com )自主研发一套高精度、高效率、适用于饱和状态下的寒区土壤水热耦合模型,用于描述饱和状态下的寒区土壤水分与温度的动态变化过程,并通过一维传热方程解析解、二维简单基准测试算例和室内冻结实验对模型进行系统的验证,综合评估其物理意义上的准确性与完整性、计算精度及计算效率. ...
The mathematical representation of freezing and thawing processes in variably-saturated, non-deformable soils
1
2013
... 由于寒区环境恶劣、人迹罕至,开展野外观测较为困难,因此,野外水文气象、水文地质和地球物理观测的范围、频率和数据量、数据精度等均受限[32 -34 ] .随着数值模拟和计算机科学的快速发展,基于近几十年积累的观测数据,构建数值模型研究气候和季节变化下的寒区土壤水热传输过程,是理解寒区土壤水文物理过程,揭示其动力学机制的重要工具[35 -37 ] .寒区土壤水热传输的物理过程较为复杂,涉及多相流动、冰水相态变化、冻胀等,使得描述水热传输过程的本构方程也具有高度的复杂性和非线性,这些都为建模和数值模拟带来了巨大的科学挑战[38 ] .目前,寒区水文模型主要包括基于陆地水文学的寒区分布式水文模型(distributed hydrologic model)[39 ] 和基于水文地质学的寒区水文地质模型(groundwater/hydrogeologic model)[40 ] .寒区分布式水文模型,如CRHM[41 ] 、GBEHM[42 ] 、VIC[43 ] 、HydroSiB2-SF[44 ] 、WEB-DHM-pF[45 ] ,是针对寒区水文循环中子过程/子单元分别建立子模型/模块,并集成至统一的模型框架中.这类模型已尽可能集成了寒区水文循环中的所有环节,但存在空间分辨率较低(千米级)、参数众多难以率定、需要大量观测数据加以验证的问题[46 ] ,且侧重于陆面地表过程,对于地下水文过程仍停留在参数化方案或一维地下水模型层面[47 ] .因此,此类模型无法精细刻画寒区土壤水分运移和热传递的物理过程,对冻融等寒区特殊现象的本质成因和动力学机理研究不够成熟[48 ] .源自地下水科学、水文地质学和冻土水文学发展的寒区水文地质模型(cryo-hydrogeological model)[49 ] ,如SUTRA-ICE[50 -52 ] 、FEFLOW[53 -54 ] 、ATS[55 -56 ] 、Cast3M(www-cast3m.cea.fr)、PFLOTRAN-ICE(www.pflotran.org )、HydroGeoSphere(HGS)[57 -58 ] 等,利用多孔介质渗流和传热理论建立地下水多相流动和热传递的本构方程,并通过土壤水分冻融曲线或基于物理过程的本构关系(例如Clausius-Clapyeron方程)来表征冻融循环对孔隙水相态、土壤孔隙率和渗透性的影响,进而模拟计算土壤水分和温度、地下径流量及其对流域地表径流的补给量等[59 ] .但是,此类模型较为复杂,大多为封装化或商业化软件,较难进行二次开发,且计算精度和效率有待提高. ...
OpenFOAM user guide
3
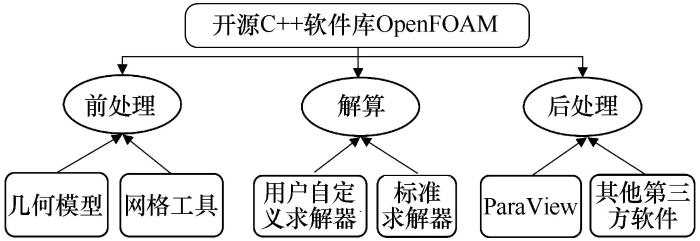
... OpenFOAM® (https://openfoam.org )是一个完全由C++编写的面向对象的计算流体力学(CFD)类库[60 ] (约100个),用于创建可执行文件(如应用程序),其数值模拟理念是将偏微分方程进行有限体积离散化后获得数值解.OpenFOAM自带了约250个应用程序,用户也可根据自己需求自行编写.应用程序主要分为两类:求解器与工具.其中,求解器用于解决特定的流体(或连续体)力学中的特定问题;工具用于执行涉及数据操作等任务.此外,OpenFOAM本身的工具包括前处理、后处理接口,以确保不同环境之间数据传输的协调性.OpenFOAM的整体结构如图1 所示,包括核心的解算部分,以及前处理和后处理环境(如ParaView(www.paraview.org ),Tecplot(www.tecplot.com )等). ...
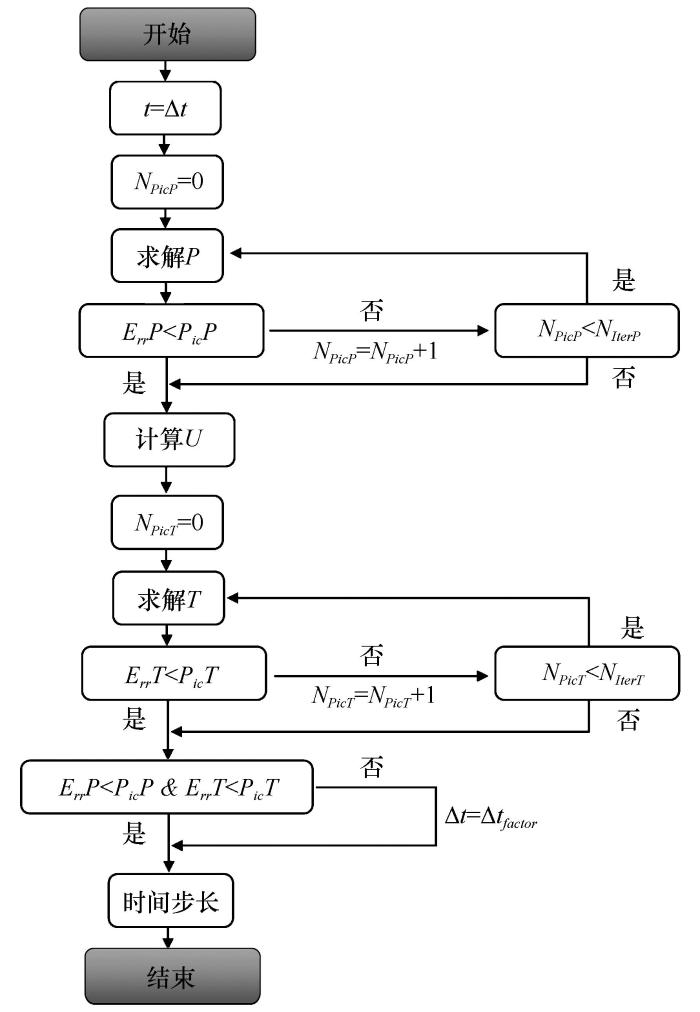
... 目前,该模型已被成功编译至开源CFD软件OpenFOAM® (v1712版本)中,成为一类新的求解器,命名为darcyTHFOAM.模型的具体计算流程图如图2 所示,在每个时间步长中,首先利用OpenFOAM中不完全的对角Cholesky预条件共轭求解器(DIC-PCG)[60 ] 来求解流动方程(8),更新速度场(4)及土壤的水热性质,进而利用对角不完全LU稳定化预条件双共轭求解器(DILC-PBiCGStab)[60 ] 来求解传热方程(9),用Picard循环来处理方程中的非线性问题.其中,Δt 为时间步长,NPicP 为求解压力的Picard迭代次数,NIterP 为求解压力的最大Picard迭代次数,P 为压力,Err P 为求解压力的误差,Pic P 为求解压力的最大误差, U T 为温度,NPicT 为求解温度的Picard迭代次数,NIterT 为求解温度的最大Picard迭代次数,Err T 为求解温度的误差,Pic T 为求解温度的最大误差,tfactor 为自动调整时间步长的参数.每个时间步长∆ t Err P 超过最大误差Pic P ,则在Picard最大迭代次数NIterP 内继续求解,直至误差Err P 低于最大误差Pic P ,进而求解速度;同样的,在求解传热方程(9)时,如果误差Err T 超过最大误差Pic T ,则在Picard最大迭代次数NPicT 内继续求解,直至误差Err T 低于最大误差Pic T ;如果求解温度与压力的误差均满足最大误差的限制,则继续下一时间步长的计算,否则,自动调整时间步长,重新展开计算,直至满足误差需求.另外,darcyTHFOAM的主要性能特点如表2 所示,适用于Linux系统,编程语言为C++,时间离散方法为欧拉格式,空间离散方法为线性插值格式,采用自适应的时间步长策略来平衡计算精度和计算效率[71 -74 ] ,可在本机上或高性能计算集群(例如,中国广州的国家超级计算中心Tianhe-2A-TH-IVB-FEP集群,www.nscc-gz.cn)完成仿真模拟计算. ...
... [60 ]来求解传热方程(9),用Picard循环来处理方程中的非线性问题.其中,Δt 为时间步长,NPicP 为求解压力的Picard迭代次数,NIterP 为求解压力的最大Picard迭代次数,P 为压力,Err P 为求解压力的误差,Pic P 为求解压力的最大误差, U T 为温度,NPicT 为求解温度的Picard迭代次数,NIterT 为求解温度的最大Picard迭代次数,Err T 为求解温度的误差,Pic T 为求解温度的最大误差,tfactor 为自动调整时间步长的参数.每个时间步长∆ t Err P 超过最大误差Pic P ,则在Picard最大迭代次数NIterP 内继续求解,直至误差Err P 低于最大误差Pic P ,进而求解速度;同样的,在求解传热方程(9)时,如果误差Err T 超过最大误差Pic T ,则在Picard最大迭代次数NPicT 内继续求解,直至误差Err T 低于最大误差Pic T ;如果求解温度与压力的误差均满足最大误差的限制,则继续下一时间步长的计算,否则,自动调整时间步长,重新展开计算,直至满足误差需求.另外,darcyTHFOAM的主要性能特点如表2 所示,适用于Linux系统,编程语言为C++,时间离散方法为欧拉格式,空间离散方法为线性插值格式,采用自适应的时间步长策略来平衡计算精度和计算效率[71 -74 ] ,可在本机上或高性能计算集群(例如,中国广州的国家超级计算中心Tianhe-2A-TH-IVB-FEP集群,www.nscc-gz.cn)完成仿真模拟计算. ...
A FEniCS-based programming framework for modeling turbulent flow by the Reynolds-averaged Navier-Stokes equations
1
2011
... 作为目前最强大的计算流体力学类库,OpenFOAM采用的数值离散方法为有限体积法(finite volume method,FVM),其自带的网格生成工具snappyHexMesh可以快速高效的划分六面体及多面体网格,因而可以处理复杂的几何外形,且所生成的网格质量较高;支持大型并行计算,计算效率高;研发环境良好,有利于对模型进行开发或二次开发;接口方式友好,便于耦合其他模型或求解器.因此,OpenFOAM已经被越来越多地用于地球科学中与环境流体力学相关的模拟计算[61 -64 ] . ...
Numerical simulation of water resources problems: models, methods, and trends
2013
Intercomparison of 3D pore-scale flow and solute transport simulation methods
2016
Water and energy transfer modeling in a permafrost-dominated, forested catchment of Central Siberia: the key role of rooting depth
3
2019
... 作为目前最强大的计算流体力学类库,OpenFOAM采用的数值离散方法为有限体积法(finite volume method,FVM),其自带的网格生成工具snappyHexMesh可以快速高效的划分六面体及多面体网格,因而可以处理复杂的几何外形,且所生成的网格质量较高;支持大型并行计算,计算效率高;研发环境良好,有利于对模型进行开发或二次开发;接口方式友好,便于耦合其他模型或求解器.因此,OpenFOAM已经被越来越多地用于地球科学中与环境流体力学相关的模拟计算[61 -64 ] . ...
... 式(6) 描述了相对导水率K r (T )与固态含冰量θ i (T )之间的关系,原理是在冻结期由于土壤水成冰导致土壤孔隙变小,进而影响土壤水迁移[69 ] .此外,固态含冰量θ i T = ε - θ w T θ w 是与温度T 相关的变量θ w (T ),通常用经验函数来表示两者之间的关系,即土壤冻结特征曲线[70 ] .本模型中采用最为常用的指数形式的经验函数[49 ,51 ,64 ] 来表示. ...
... 步长
文献来源 本研究 www-cast3m.cea.fr [64 ] www.comsol.com/comsol-multiphysics [81 ] 然而,不同模型在温度小于0 ℃的阶段呈现出一定差异,特别是在-1~0 ℃(对应相变阶段),温度呈现出急速上升趋势的开始时刻,darcyTHFOAM,分别比COMSOL和darcyTools晚2 400 s和1 300 s,而又比Cast3M和permaFOAM提早3 500 s和5 400 s,这可能是由于不同的数值算法和网格离散方法造成的.与同类模型相比,darcyTHFOAM采用更少的网格数量便可达到相同的模拟结果(如表4 所示),且支持并行计算,计算效率更高,接口较为灵活,便于二次开发.但目前仅适用于完全饱和状态下的水热耦合过程,未来可拓展至模拟变饱和状态下的土壤水热传输过程. ...
An open-source toolbox for multiphase flow in porous media
1
2015
... 饱和条件下(即不考虑气相)的质量守恒方程[65 ] 为 ...
1
1990
... 若暂不考虑土壤的冻胀和融沉[66 ] ,且在完全饱和情况下,θ i = ε - θ w h = P ρ w g 式(2) 则变为 ...
The compleat Darcy: new lessons learned from the first English translation of Les Fontaines Publiques de la Ville de Dijon
1
2005
... 假设地下水流动满足达西定律[67 ] , ...
Groundwater flow with energy transport and water-ice phase change: numerical simulations, benchmarks, and application to freezing in peat bogs
1
2007
... 式中:K r (T )为与土壤冻结相关的相对导水率,可表示[51 ,68 ] 为 ...
Heat and mass transfer in a freezing unsaturated porous medium
1
1980
... 式(6) 描述了相对导水率K r (T )与固态含冰量θ i (T )之间的关系,原理是在冻结期由于土壤水成冰导致土壤孔隙变小,进而影响土壤水迁移[69 ] .此外,固态含冰量θ i T = ε - θ w T θ w 是与温度T 相关的变量θ w (T ),通常用经验函数来表示两者之间的关系,即土壤冻结特征曲线[70 ] .本模型中采用最为常用的指数形式的经验函数[49 ,51 ,64 ] 来表示. ...
Review of algorithms and parameterizations to determine unfrozen water content in frozen soil
1
2020
... 式(6) 描述了相对导水率K r (T )与固态含冰量θ i (T )之间的关系,原理是在冻结期由于土壤水成冰导致土壤孔隙变小,进而影响土壤水迁移[69 ] .此外,固态含冰量θ i T = ε - θ w T θ w 是与温度T 相关的变量θ w (T ),通常用经验函数来表示两者之间的关系,即土壤冻结特征曲线[70 ] .本模型中采用最为常用的指数形式的经验函数[49 ,51 ,64 ] 来表示. ...
An open source massively parallel solver for Richards equation: mechanistic modelling of water fluxes at the watershed scale
1
2014
... 目前,该模型已被成功编译至开源CFD软件OpenFOAM® (v1712版本)中,成为一类新的求解器,命名为darcyTHFOAM.模型的具体计算流程图如图2 所示,在每个时间步长中,首先利用OpenFOAM中不完全的对角Cholesky预条件共轭求解器(DIC-PCG)[60 ] 来求解流动方程(8),更新速度场(4)及土壤的水热性质,进而利用对角不完全LU稳定化预条件双共轭求解器(DILC-PBiCGStab)[60 ] 来求解传热方程(9),用Picard循环来处理方程中的非线性问题.其中,Δt 为时间步长,NPicP 为求解压力的Picard迭代次数,NIterP 为求解压力的最大Picard迭代次数,P 为压力,Err P 为求解压力的误差,Pic P 为求解压力的最大误差, U T 为温度,NPicT 为求解温度的Picard迭代次数,NIterT 为求解温度的最大Picard迭代次数,Err T 为求解温度的误差,Pic T 为求解温度的最大误差,tfactor 为自动调整时间步长的参数.每个时间步长∆ t Err P 超过最大误差Pic P ,则在Picard最大迭代次数NIterP 内继续求解,直至误差Err P 低于最大误差Pic P ,进而求解速度;同样的,在求解传热方程(9)时,如果误差Err T 超过最大误差Pic T ,则在Picard最大迭代次数NPicT 内继续求解,直至误差Err T 低于最大误差Pic T ;如果求解温度与压力的误差均满足最大误差的限制,则继续下一时间步长的计算,否则,自动调整时间步长,重新展开计算,直至满足误差需求.另外,darcyTHFOAM的主要性能特点如表2 所示,适用于Linux系统,编程语言为C++,时间离散方法为欧拉格式,空间离散方法为线性插值格式,采用自适应的时间步长策略来平衡计算精度和计算效率[71 -74 ] ,可在本机上或高性能计算集群(例如,中国广州的国家超级计算中心Tianhe-2A-TH-IVB-FEP集群,www.nscc-gz.cn)完成仿真模拟计算. ...
A generalized Richards equation for surface/subsurface flow modelling
2009
Development and applications of the HYDRUS and STANMOD software packages and related codes
2008
An evaluation of temporally adaptive transformation approaches for solving Richards’ equation
1
1999
... 目前,该模型已被成功编译至开源CFD软件OpenFOAM® (v1712版本)中,成为一类新的求解器,命名为darcyTHFOAM.模型的具体计算流程图如图2 所示,在每个时间步长中,首先利用OpenFOAM中不完全的对角Cholesky预条件共轭求解器(DIC-PCG)[60 ] 来求解流动方程(8),更新速度场(4)及土壤的水热性质,进而利用对角不完全LU稳定化预条件双共轭求解器(DILC-PBiCGStab)[60 ] 来求解传热方程(9),用Picard循环来处理方程中的非线性问题.其中,Δt 为时间步长,NPicP 为求解压力的Picard迭代次数,NIterP 为求解压力的最大Picard迭代次数,P 为压力,Err P 为求解压力的误差,Pic P 为求解压力的最大误差, U T 为温度,NPicT 为求解温度的Picard迭代次数,NIterT 为求解温度的最大Picard迭代次数,Err T 为求解温度的误差,Pic T 为求解温度的最大误差,tfactor 为自动调整时间步长的参数.每个时间步长∆ t Err P 超过最大误差Pic P ,则在Picard最大迭代次数NIterP 内继续求解,直至误差Err P 低于最大误差Pic P ,进而求解速度;同样的,在求解传热方程(9)时,如果误差Err T 超过最大误差Pic T ,则在Picard最大迭代次数NPicT 内继续求解,直至误差Err T 低于最大误差Pic T ;如果求解温度与压力的误差均满足最大误差的限制,则继续下一时间步长的计算,否则,自动调整时间步长,重新展开计算,直至满足误差需求.另外,darcyTHFOAM的主要性能特点如表2 所示,适用于Linux系统,编程语言为C++,时间离散方法为欧拉格式,空间离散方法为线性插值格式,采用自适应的时间步长策略来平衡计算精度和计算效率[71 -74 ] ,可在本机上或高性能计算集群(例如,中国广州的国家超级计算中心Tianhe-2A-TH-IVB-FEP集群,www.nscc-gz.cn)完成仿真模拟计算. ...
1
1991
... 一维Stefan方程存在解析解[34 ,75 -76 ] ,可根据温度来估算冻结深度随时间的变化. ...
A two-directional freeze and thaw algorithm for hydrologic and land surface modelling
1
2004
... 一维Stefan方程存在解析解[34 ,75 -76 ] ,可根据温度来估算冻结深度随时间的变化. ...
The role of advective heat transport in talik development beneath lakes and ponds in discontinuous permafrost
1
2011
... 贯穿融区(“天窗”)存在于湖泊或河流下面的多年冻土中,是多年冻土内的局部融化区[77 -80 ] .该基准测试算例取材于自然界中冻土的典型特征,兼具代表性与适用性[49 ] ,能够反映出多年冻土中贯穿融区的演变过程.两个起始冻结的半圆形区域(半径为0.5099 m)温度都是-5 ℃,代表了两部分冻土,均位于一个正方形计算域内(1 m×1 m).最初,计算区域的背景温度为5 ℃,左侧入口边界赋予固定值5 ℃,上下边界赋予固定值-5 ℃(图9 ),右侧出口边界为绝热边界,压力边界条件与上一个冰包裹体融化算例的相同,其他相关参数见表3 . ...
Permafrost degradation as a control on hydrogeological regime shifts in a warming climate
2012
Impacts of climate, lake size, and supra- and sub-permafrost groundwater flow on lake-talik evolution, Yukon Flats, Alaska (USA)
2013
Modeling the role of preferential snow accumulation in through talik development and hillslope groundwater flow in a transitional permafrost landscape
1
2018
... 贯穿融区(“天窗”)存在于湖泊或河流下面的多年冻土中,是多年冻土内的局部融化区[77 -80 ] .该基准测试算例取材于自然界中冻土的典型特征,兼具代表性与适用性[49 ] ,能够反映出多年冻土中贯穿融区的演变过程.两个起始冻结的半圆形区域(半径为0.5099 m)温度都是-5 ℃,代表了两部分冻土,均位于一个正方形计算域内(1 m×1 m).最初,计算区域的背景温度为5 ℃,左侧入口边界赋予固定值5 ℃,上下边界赋予固定值-5 ℃(图9 ),右侧出口边界为绝热边界,压力边界条件与上一个冰包裹体融化算例的相同,其他相关参数见表3 . ...
DarcyTools: a computer code for hydrogeological analysis of nuclear waste repositories in fractured rock
1
2014
... 步长
文献来源 本研究 www-cast3m.cea.fr [64 ] www.comsol.com/comsol-multiphysics [81 ] 然而,不同模型在温度小于0 ℃的阶段呈现出一定差异,特别是在-1~0 ℃(对应相变阶段),温度呈现出急速上升趋势的开始时刻,darcyTHFOAM,分别比COMSOL和darcyTools晚2 400 s和1 300 s,而又比Cast3M和permaFOAM提早3 500 s和5 400 s,这可能是由于不同的数值算法和网格离散方法造成的.与同类模型相比,darcyTHFOAM采用更少的网格数量便可达到相同的模拟结果(如表4 所示),且支持并行计算,计算效率更高,接口较为灵活,便于二次开发.但目前仅适用于完全饱和状态下的水热耦合过程,未来可拓展至模拟变饱和状态下的土壤水热传输过程. ...
Mizoguchi M. Water, heat and salt transport in freezing soil
3
1990
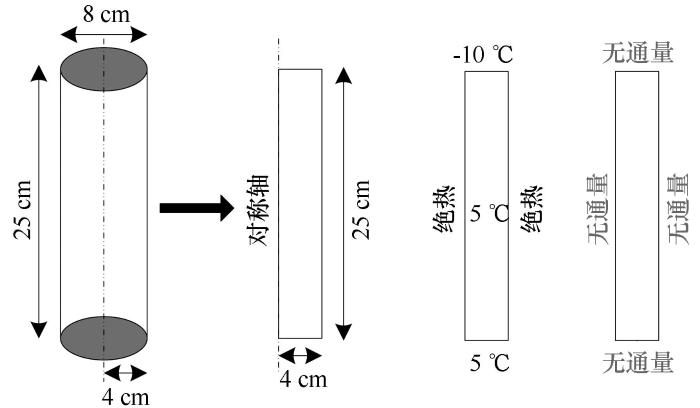
... Mizoguchi[82 ] 早在1991年就开展了室内土柱冻结实验,并在实验过程中进行了温度观测.随着数值模型的发展,已有越来越多的寒区水文地质模型和室内实验进行比对[83 ] ,因此将darcyTHFOAM模拟此室内冻结实验的结果与实测的温度数据比对,是模型验证的有效途径. ...
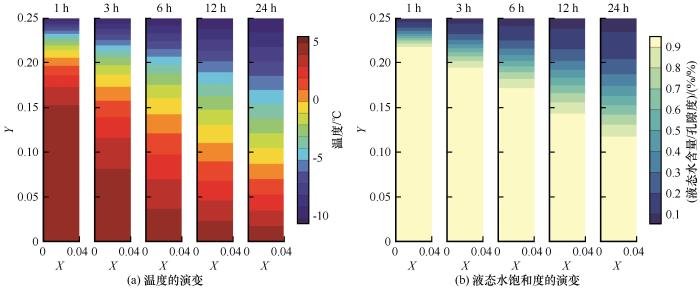
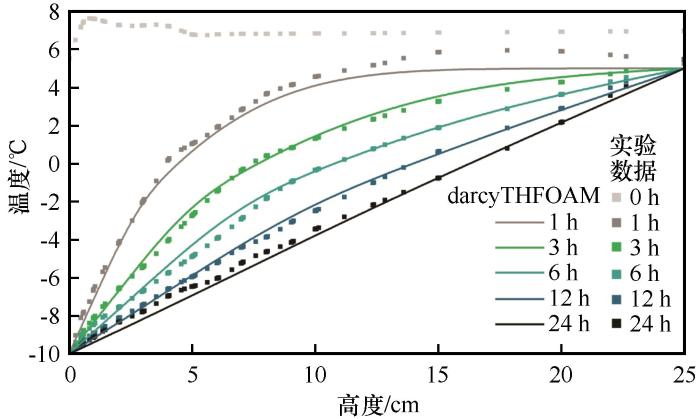
... 利用darcyTHFOAM展开仿真模拟计算后,1、3、6、12、24 h的温度和液态水饱和度分布情况分别如图14 (a)和图14 (b)所示.从顶部到底部,温度逐渐下降,同时液态水饱和度逐渐减少,直观反映出了土柱的冻结过程.为了进一步验证模型,从文献[82 ]的图3 .1-5中提取出实验观测的温度数据(Engauge Digitize,http://digitizer.sourceforge.net ).图15 中展示了在不同时刻沿对称轴的温度分布,darcyTHFOAM模拟的数值结果与实验数据非常吻合,进一步证明了模型的准确性.Mizoguchi[82 ] 在设计该室内冻结实验时,整个土柱的初始温度为5 ℃,而顶部和底部分别暴露于温度为-10 ℃和5 ℃的循环流体.但从初始0 h的观测数据来看,整个土柱内部温度平均在7 ℃,只有顶部温度为5 ℃,说明在土柱冻结实验开始时内部并没有完全达到5 ℃,进而导致观测数据在早期(1 h)呈现出高估的趋势(高达6 ℃). ...
... [82 ]在设计该室内冻结实验时,整个土柱的初始温度为5 ℃,而顶部和底部分别暴露于温度为-10 ℃和5 ℃的循环流体.但从初始0 h的观测数据来看,整个土柱内部温度平均在7 ℃,只有顶部温度为5 ℃,说明在土柱冻结实验开始时内部并没有完全达到5 ℃,进而导致观测数据在早期(1 h)呈现出高估的趋势(高达6 ℃). ...
Water flow and heat transport in frozen soil: numerical solution and freeze-thaw applications
1
2004
... Mizoguchi[82 ] 早在1991年就开展了室内土柱冻结实验,并在实验过程中进行了温度观测.随着数值模型的发展,已有越来越多的寒区水文地质模型和室内实验进行比对[83 ] ,因此将darcyTHFOAM模拟此室内冻结实验的结果与实测的温度数据比对,是模型验证的有效途径. ...
Effects of NaCl concentration on the thermal conductivity of sand and glass beads with moisture contents at levels below field capacity
1
2008
... 表5 中总结了实验参数,其中,土壤固体颗粒C s 的导热系数是从Mochizuki等[84 ] 中获得,相对导水率函数中的阻抗系数Ω ,参考前面基准测试算例设置为50.通过对比模拟结果和实验数据,将土壤冻结函数中的拟合参数W 设为5.25.考虑到计算效率和精度,经过网格分辨率测试,将计算域离散为80×500个网格.该算例的收敛准则和Picard循环的设置,也与基准测试算例相同.初始时间步长设置为0.1 s,最大时间步长设置为30 min.采用darcyTHFOAM在本机上模拟计算50 h的冻结过程,耗时约3 min(CPU时间). ...


 甘公网安备 62010202000676号