Recent third pole’s rapid warming accompanies cryospheric melt and water cycle intensification and interactions between monsoon and environment: multidisciplinary approach with observations, modeling, and analysis
1
2019
... 青藏高原作为亚洲水塔,其独特的冰冻圈地貌对全球变暖极其敏感.目前因高原变暖,已造成冰川退缩、冻土消融等一系列的生态环境问题[1-5].近年来青藏高原地面温度以0.3~0.4 ℃∙(10a)-1的升温速率上升,是全球平均增温速率的2倍[6-7],地面增温会以长波辐射形式影响其上的高空大气温度.表征高空大气温度变化的一个重要指标就是大气0 ℃层高度,作为自由大气温度为0 ℃的最低高度,大气0 ℃层高度决定了空中水汽相变发生的高度.若大气0 ℃层高度高于地表,则地表的冰冻圈处于消融状态,故大气0 ℃层高度可反映高原地表冰冻圈的消融状态.因此,量化青藏高原地区大气0 ℃层高度变化,对认识高原的气候变化,以及冰冻圈的变化状态十分关键. ...
Asian Water Tower change and its impacts
2019
Effects of changed Asian water tower on Tibetan Plateau ecosystem: a review
2019
“亚洲水塔”变化对青藏高原生态系统的影响
2019
Spatial-temporal variation of glacier resources in the Hexi interior from 1956 to 2017
2019
1956—2017年河西内流区冰川资源时空变化特征
2019
Ice temperature changing with elevations of a polythermal valley glacier in the northern Tibetan Plateau: a case study on the Laohugou Glacier No.12, Qilian Mountains
1
2019
... 青藏高原作为亚洲水塔,其独特的冰冻圈地貌对全球变暖极其敏感.目前因高原变暖,已造成冰川退缩、冻土消融等一系列的生态环境问题[1-5].近年来青藏高原地面温度以0.3~0.4 ℃∙(10a)-1的升温速率上升,是全球平均增温速率的2倍[6-7],地面增温会以长波辐射形式影响其上的高空大气温度.表征高空大气温度变化的一个重要指标就是大气0 ℃层高度,作为自由大气温度为0 ℃的最低高度,大气0 ℃层高度决定了空中水汽相变发生的高度.若大气0 ℃层高度高于地表,则地表的冰冻圈处于消融状态,故大气0 ℃层高度可反映高原地表冰冻圈的消融状态.因此,量化青藏高原地区大气0 ℃层高度变化,对认识高原的气候变化,以及冰冻圈的变化状态十分关键. ...
青藏高原北部多温型山谷冰川不同海拔处冰温变化研究——以祁连山老虎沟12号冰川为例
1
2019
... 青藏高原作为亚洲水塔,其独特的冰冻圈地貌对全球变暖极其敏感.目前因高原变暖,已造成冰川退缩、冻土消融等一系列的生态环境问题[1-5].近年来青藏高原地面温度以0.3~0.4 ℃∙(10a)-1的升温速率上升,是全球平均增温速率的2倍[6-7],地面增温会以长波辐射形式影响其上的高空大气温度.表征高空大气温度变化的一个重要指标就是大气0 ℃层高度,作为自由大气温度为0 ℃的最低高度,大气0 ℃层高度决定了空中水汽相变发生的高度.若大气0 ℃层高度高于地表,则地表的冰冻圈处于消融状态,故大气0 ℃层高度可反映高原地表冰冻圈的消融状态.因此,量化青藏高原地区大气0 ℃层高度变化,对认识高原的气候变化,以及冰冻圈的变化状态十分关键. ...
Assessment of past, present and future environmental changes on the Tibetan Plateau
2
2015
... 青藏高原作为亚洲水塔,其独特的冰冻圈地貌对全球变暖极其敏感.目前因高原变暖,已造成冰川退缩、冻土消融等一系列的生态环境问题[1-5].近年来青藏高原地面温度以0.3~0.4 ℃∙(10a)-1的升温速率上升,是全球平均增温速率的2倍[6-7],地面增温会以长波辐射形式影响其上的高空大气温度.表征高空大气温度变化的一个重要指标就是大气0 ℃层高度,作为自由大气温度为0 ℃的最低高度,大气0 ℃层高度决定了空中水汽相变发生的高度.若大气0 ℃层高度高于地表,则地表的冰冻圈处于消融状态,故大气0 ℃层高度可反映高原地表冰冻圈的消融状态.因此,量化青藏高原地区大气0 ℃层高度变化,对认识高原的气候变化,以及冰冻圈的变化状态十分关键. ...
... 在全球变暖背景下,随着地面温度的上升,一方面增加了向上的长波辐射,另一方面对流活动更加活跃,将底层的热量传向高层,致使高层大气温度升高,大气0 ℃层高度也随之上升.近年全球各地区的大气0 ℃层高度整体上都呈升高趋势[11-13,16-19],相比较,青藏高原地区升高速率更显著,这与高原增温速率是全球平均的2倍[6-7]相一致. ...
青藏高原环境变化科学评估: 过去、现在与未来
2
2015
... 青藏高原作为亚洲水塔,其独特的冰冻圈地貌对全球变暖极其敏感.目前因高原变暖,已造成冰川退缩、冻土消融等一系列的生态环境问题[1-5].近年来青藏高原地面温度以0.3~0.4 ℃∙(10a)-1的升温速率上升,是全球平均增温速率的2倍[6-7],地面增温会以长波辐射形式影响其上的高空大气温度.表征高空大气温度变化的一个重要指标就是大气0 ℃层高度,作为自由大气温度为0 ℃的最低高度,大气0 ℃层高度决定了空中水汽相变发生的高度.若大气0 ℃层高度高于地表,则地表的冰冻圈处于消融状态,故大气0 ℃层高度可反映高原地表冰冻圈的消融状态.因此,量化青藏高原地区大气0 ℃层高度变化,对认识高原的气候变化,以及冰冻圈的变化状态十分关键. ...
... 在全球变暖背景下,随着地面温度的上升,一方面增加了向上的长波辐射,另一方面对流活动更加活跃,将底层的热量传向高层,致使高层大气温度升高,大气0 ℃层高度也随之上升.近年全球各地区的大气0 ℃层高度整体上都呈升高趋势[11-13,16-19],相比较,青藏高原地区升高速率更显著,这与高原增温速率是全球平均的2倍[6-7]相一致. ...
Tibetan Plateau warming and precipitation changes in East Asia
2
2008
... 青藏高原作为亚洲水塔,其独特的冰冻圈地貌对全球变暖极其敏感.目前因高原变暖,已造成冰川退缩、冻土消融等一系列的生态环境问题[1-5].近年来青藏高原地面温度以0.3~0.4 ℃∙(10a)-1的升温速率上升,是全球平均增温速率的2倍[6-7],地面增温会以长波辐射形式影响其上的高空大气温度.表征高空大气温度变化的一个重要指标就是大气0 ℃层高度,作为自由大气温度为0 ℃的最低高度,大气0 ℃层高度决定了空中水汽相变发生的高度.若大气0 ℃层高度高于地表,则地表的冰冻圈处于消融状态,故大气0 ℃层高度可反映高原地表冰冻圈的消融状态.因此,量化青藏高原地区大气0 ℃层高度变化,对认识高原的气候变化,以及冰冻圈的变化状态十分关键. ...
... 在全球变暖背景下,随着地面温度的上升,一方面增加了向上的长波辐射,另一方面对流活动更加活跃,将底层的热量传向高层,致使高层大气温度升高,大气0 ℃层高度也随之上升.近年全球各地区的大气0 ℃层高度整体上都呈升高趋势[11-13,16-19],相比较,青藏高原地区升高速率更显著,这与高原增温速率是全球平均的2倍[6-7]相一致. ...
Recent changes in tropical freezing heights and the role of sea surface temperature
1
1996
... 研究指出在热带地区大气0 ℃层高度变化与海表温度密切相关,且是影响热带地区冰川变化的重要因素[8-10].近年来在我国西北、西南、黄河流域和高亚洲等地区,也进行了大气0 ℃层高度变化的研究,发现大气0 ℃层高度呈升高趋势,并与地面温度的变化呈显著正相关关系[11-20].在青藏高原地区,夏季大气0 ℃层高度的变化与冰川消融量[21]、零平衡线高度[22]以及冰川物质平衡[23]之间存在很好的线性关系,并直接影响冰川、积雪与冻土区的消融面积和强度,进而对区域径流产生重要影响[12],可诱发洪水[24-26]及断流[12,27-32]等灾害.通过建立夏季径流量对大气0 ℃层高度变化的响应关系,也可预测评估夏季河流径流量的变化[33-37].因此,夏季大气0 ℃层高度的变化不仅是大气热状况的反映,也是影响冰冻圈各要素变化的重要指标[38]. ...
Recent changes in freezing level heights in the Tropics with implications for the deglacierization of high mountain regions
1
2009
... 采用探空站数据,以及ERA-Interim[17,39]和NCEP/NCAR[9,23,30-31,39-40]等再分析资料,对青藏高原不同区域的夏季大气0 ℃层高度变化进行了研究,但对青藏高原全局的研究相对薄弱.探空数据获取的大气0 ℃层高度可信度高,但由于青藏高原探空站稀少,无法获得整个高原面上大气0 ℃层高度的变化.再分析资料时空分布连续,由其可获得较高精度的大气0 ℃层高度变化[39,41-45].ERA5作为最新一代的再分析资料,与上一代的ERA-Interim再分析数据相比,其空间分辨率更高,数据质量更好[46-48].青藏高原夏季大气0 ℃层高度未来如何变化,目前尚无研究,也缺乏对夏季大气0 ℃层高度变化对青藏高原冰川变化影响方面的研究.基于此,本文的目的是:(1)综合探空站数据、ERA5再分析资料以及CMIP6模式数据,分析1979—2100年高原夏季大气0 ℃层高度变化的特征及规律.(2)从高原夏季大气0 ℃层高度变化角度,预估青藏高原冰川未来变化的可能态势. ...
Variability of freezing levels, melting season indicators, and snow cover for selected high-elevation and continental regions in the last 50 years
1
2003
... 研究指出在热带地区大气0 ℃层高度变化与海表温度密切相关,且是影响热带地区冰川变化的重要因素[8-10].近年来在我国西北、西南、黄河流域和高亚洲等地区,也进行了大气0 ℃层高度变化的研究,发现大气0 ℃层高度呈升高趋势,并与地面温度的变化呈显著正相关关系[11-20].在青藏高原地区,夏季大气0 ℃层高度的变化与冰川消融量[21]、零平衡线高度[22]以及冰川物质平衡[23]之间存在很好的线性关系,并直接影响冰川、积雪与冻土区的消融面积和强度,进而对区域径流产生重要影响[12],可诱发洪水[24-26]及断流[12,27-32]等灾害.通过建立夏季径流量对大气0 ℃层高度变化的响应关系,也可预测评估夏季河流径流量的变化[33-37].因此,夏季大气0 ℃层高度的变化不仅是大气热状况的反映,也是影响冰冻圈各要素变化的重要指标[38]. ...
Variation of 0 ℃ isotherm height and ground temperature in summer in northwest China during the past 50 years
2
2011
... 研究指出在热带地区大气0 ℃层高度变化与海表温度密切相关,且是影响热带地区冰川变化的重要因素[8-10].近年来在我国西北、西南、黄河流域和高亚洲等地区,也进行了大气0 ℃层高度变化的研究,发现大气0 ℃层高度呈升高趋势,并与地面温度的变化呈显著正相关关系[11-20].在青藏高原地区,夏季大气0 ℃层高度的变化与冰川消融量[21]、零平衡线高度[22]以及冰川物质平衡[23]之间存在很好的线性关系,并直接影响冰川、积雪与冻土区的消融面积和强度,进而对区域径流产生重要影响[12],可诱发洪水[24-26]及断流[12,27-32]等灾害.通过建立夏季径流量对大气0 ℃层高度变化的响应关系,也可预测评估夏季河流径流量的变化[33-37].因此,夏季大气0 ℃层高度的变化不仅是大气热状况的反映,也是影响冰冻圈各要素变化的重要指标[38]. ...
... 在全球变暖背景下,随着地面温度的上升,一方面增加了向上的长波辐射,另一方面对流活动更加活跃,将底层的热量传向高层,致使高层大气温度升高,大气0 ℃层高度也随之上升.近年全球各地区的大气0 ℃层高度整体上都呈升高趋势[11-13,16-19],相比较,青藏高原地区升高速率更显著,这与高原增温速率是全球平均的2倍[6-7]相一致. ...
中国西北地区近50年夏季0 ℃层高度及气温时空变化特征
2
2011
... 研究指出在热带地区大气0 ℃层高度变化与海表温度密切相关,且是影响热带地区冰川变化的重要因素[8-10].近年来在我国西北、西南、黄河流域和高亚洲等地区,也进行了大气0 ℃层高度变化的研究,发现大气0 ℃层高度呈升高趋势,并与地面温度的变化呈显著正相关关系[11-20].在青藏高原地区,夏季大气0 ℃层高度的变化与冰川消融量[21]、零平衡线高度[22]以及冰川物质平衡[23]之间存在很好的线性关系,并直接影响冰川、积雪与冻土区的消融面积和强度,进而对区域径流产生重要影响[12],可诱发洪水[24-26]及断流[12,27-32]等灾害.通过建立夏季径流量对大气0 ℃层高度变化的响应关系,也可预测评估夏季河流径流量的变化[33-37].因此,夏季大气0 ℃层高度的变化不仅是大气热状况的反映,也是影响冰冻圈各要素变化的重要指标[38]. ...
... 在全球变暖背景下,随着地面温度的上升,一方面增加了向上的长波辐射,另一方面对流活动更加活跃,将底层的热量传向高层,致使高层大气温度升高,大气0 ℃层高度也随之上升.近年全球各地区的大气0 ℃层高度整体上都呈升高趋势[11-13,16-19],相比较,青藏高原地区升高速率更显著,这与高原增温速率是全球平均的2倍[6-7]相一致. ...
Variation of free-air 0 ℃Isotherm height over tomur peak in the Tianshan Mountain, Xinjiang Uygur Autonomous Region
2
2016
... 研究指出在热带地区大气0 ℃层高度变化与海表温度密切相关,且是影响热带地区冰川变化的重要因素[8-10].近年来在我国西北、西南、黄河流域和高亚洲等地区,也进行了大气0 ℃层高度变化的研究,发现大气0 ℃层高度呈升高趋势,并与地面温度的变化呈显著正相关关系[11-20].在青藏高原地区,夏季大气0 ℃层高度的变化与冰川消融量[21]、零平衡线高度[22]以及冰川物质平衡[23]之间存在很好的线性关系,并直接影响冰川、积雪与冻土区的消融面积和强度,进而对区域径流产生重要影响[12],可诱发洪水[24-26]及断流[12,27-32]等灾害.通过建立夏季径流量对大气0 ℃层高度变化的响应关系,也可预测评估夏季河流径流量的变化[33-37].因此,夏季大气0 ℃层高度的变化不仅是大气热状况的反映,也是影响冰冻圈各要素变化的重要指标[38]. ...
... [12,27-32]等灾害.通过建立夏季径流量对大气0 ℃层高度变化的响应关系,也可预测评估夏季河流径流量的变化[33-37].因此,夏季大气0 ℃层高度的变化不仅是大气热状况的反映,也是影响冰冻圈各要素变化的重要指标[38]. ...
新疆天山托木尔峰地区夏季大气0 ℃层高度变化
2
2016
... 研究指出在热带地区大气0 ℃层高度变化与海表温度密切相关,且是影响热带地区冰川变化的重要因素[8-10].近年来在我国西北、西南、黄河流域和高亚洲等地区,也进行了大气0 ℃层高度变化的研究,发现大气0 ℃层高度呈升高趋势,并与地面温度的变化呈显著正相关关系[11-20].在青藏高原地区,夏季大气0 ℃层高度的变化与冰川消融量[21]、零平衡线高度[22]以及冰川物质平衡[23]之间存在很好的线性关系,并直接影响冰川、积雪与冻土区的消融面积和强度,进而对区域径流产生重要影响[12],可诱发洪水[24-26]及断流[12,27-32]等灾害.通过建立夏季径流量对大气0 ℃层高度变化的响应关系,也可预测评估夏季河流径流量的变化[33-37].因此,夏季大气0 ℃层高度的变化不仅是大气热状况的反映,也是影响冰冻圈各要素变化的重要指标[38]. ...
... [12,27-32]等灾害.通过建立夏季径流量对大气0 ℃层高度变化的响应关系,也可预测评估夏季河流径流量的变化[33-37].因此,夏季大气0 ℃层高度的变化不仅是大气热状况的反映,也是影响冰冻圈各要素变化的重要指标[38]. ...
Changing trend and abrupt change of the 0 ℃ level height in summer in Xinjiang from 1960 to 2002
1
2005
... 在全球变暖背景下,随着地面温度的上升,一方面增加了向上的长波辐射,另一方面对流活动更加活跃,将底层的热量传向高层,致使高层大气温度升高,大气0 ℃层高度也随之上升.近年全球各地区的大气0 ℃层高度整体上都呈升高趋势[11-13,16-19],相比较,青藏高原地区升高速率更显著,这与高原增温速率是全球平均的2倍[6-7]相一致. ...
新疆43 a来夏季0 ℃层高度变化和突变分析
1
2005
... 在全球变暖背景下,随着地面温度的上升,一方面增加了向上的长波辐射,另一方面对流活动更加活跃,将底层的热量传向高层,致使高层大气温度升高,大气0 ℃层高度也随之上升.近年全球各地区的大气0 ℃层高度整体上都呈升高趋势[11-13,16-19],相比较,青藏高原地区升高速率更显著,这与高原增温速率是全球平均的2倍[6-7]相一致. ...
Changes in 0 ℃ isotherm height of southwest China during 1960-2010
2013
1960—2010年中国西南地区0 ℃层高度变化特征
2013
The spatial and temporal distribution characteristics of the height of the melting layer over Sichuan Basin and its surroundings in summer
2018
四川盆地及周边地区夏季0 ℃层高度时空分布特征
2018
Variation in summer 0 ℃ level height and its relationships with temperature and precipitation over the Yellow River Basin
1
2011
... 在全球变暖背景下,随着地面温度的上升,一方面增加了向上的长波辐射,另一方面对流活动更加活跃,将底层的热量传向高层,致使高层大气温度升高,大气0 ℃层高度也随之上升.近年全球各地区的大气0 ℃层高度整体上都呈升高趋势[11-13,16-19],相比较,青藏高原地区升高速率更显著,这与高原增温速率是全球平均的2倍[6-7]相一致. ...
黄河流域夏季0 ℃层高度变化及与地面气温和降水量的关系
1
2011
... 在全球变暖背景下,随着地面温度的上升,一方面增加了向上的长波辐射,另一方面对流活动更加活跃,将底层的热量传向高层,致使高层大气温度升高,大气0 ℃层高度也随之上升.近年全球各地区的大气0 ℃层高度整体上都呈升高趋势[11-13,16-19],相比较,青藏高原地区升高速率更显著,这与高原增温速率是全球平均的2倍[6-7]相一致. ...
Variation and its influences of 0 ℃ isotherm height in summer over high Asia
1
2017
... 采用探空站数据,以及ERA-Interim[17,39]和NCEP/NCAR[9,23,30-31,39-40]等再分析资料,对青藏高原不同区域的夏季大气0 ℃层高度变化进行了研究,但对青藏高原全局的研究相对薄弱.探空数据获取的大气0 ℃层高度可信度高,但由于青藏高原探空站稀少,无法获得整个高原面上大气0 ℃层高度的变化.再分析资料时空分布连续,由其可获得较高精度的大气0 ℃层高度变化[39,41-45].ERA5作为最新一代的再分析资料,与上一代的ERA-Interim再分析数据相比,其空间分辨率更高,数据质量更好[46-48].青藏高原夏季大气0 ℃层高度未来如何变化,目前尚无研究,也缺乏对夏季大气0 ℃层高度变化对青藏高原冰川变化影响方面的研究.基于此,本文的目的是:(1)综合探空站数据、ERA5再分析资料以及CMIP6模式数据,分析1979—2100年高原夏季大气0 ℃层高度变化的特征及规律.(2)从高原夏季大气0 ℃层高度变化角度,预估青藏高原冰川未来变化的可能态势. ...
高亚洲地区夏季0 ℃层高度变化及其影响特征研究
1
2017
... 采用探空站数据,以及ERA-Interim[17,39]和NCEP/NCAR[9,23,30-31,39-40]等再分析资料,对青藏高原不同区域的夏季大气0 ℃层高度变化进行了研究,但对青藏高原全局的研究相对薄弱.探空数据获取的大气0 ℃层高度可信度高,但由于青藏高原探空站稀少,无法获得整个高原面上大气0 ℃层高度的变化.再分析资料时空分布连续,由其可获得较高精度的大气0 ℃层高度变化[39,41-45].ERA5作为最新一代的再分析资料,与上一代的ERA-Interim再分析数据相比,其空间分辨率更高,数据质量更好[46-48].青藏高原夏季大气0 ℃层高度未来如何变化,目前尚无研究,也缺乏对夏季大气0 ℃层高度变化对青藏高原冰川变化影响方面的研究.基于此,本文的目的是:(1)综合探空站数据、ERA5再分析资料以及CMIP6模式数据,分析1979—2100年高原夏季大气0 ℃层高度变化的特征及规律.(2)从高原夏季大气0 ℃层高度变化角度,预估青藏高原冰川未来变化的可能态势. ...
1977—2010年长江源区夏季大气0 ℃层高度变化
2014
Analysis on 0 ℃ level height change in summer over northeast side of Qilian Mountain
1
2006
... 在全球变暖背景下,随着地面温度的上升,一方面增加了向上的长波辐射,另一方面对流活动更加活跃,将底层的热量传向高层,致使高层大气温度升高,大气0 ℃层高度也随之上升.近年全球各地区的大气0 ℃层高度整体上都呈升高趋势[11-13,16-19],相比较,青藏高原地区升高速率更显著,这与高原增温速率是全球平均的2倍[6-7]相一致. ...
祁连山东北侧夏季零度气温层高度变化研究
1
2006
... 在全球变暖背景下,随着地面温度的上升,一方面增加了向上的长波辐射,另一方面对流活动更加活跃,将底层的热量传向高层,致使高层大气温度升高,大气0 ℃层高度也随之上升.近年全球各地区的大气0 ℃层高度整体上都呈升高趋势[11-13,16-19],相比较,青藏高原地区升高速率更显著,这与高原增温速率是全球平均的2倍[6-7]相一致. ...
Spatio-temporal changes of 0 ℃ isotherm height in China during summer half year of 1970—2012
1
2017
... 研究指出在热带地区大气0 ℃层高度变化与海表温度密切相关,且是影响热带地区冰川变化的重要因素[8-10].近年来在我国西北、西南、黄河流域和高亚洲等地区,也进行了大气0 ℃层高度变化的研究,发现大气0 ℃层高度呈升高趋势,并与地面温度的变化呈显著正相关关系[11-20].在青藏高原地区,夏季大气0 ℃层高度的变化与冰川消融量[21]、零平衡线高度[22]以及冰川物质平衡[23]之间存在很好的线性关系,并直接影响冰川、积雪与冻土区的消融面积和强度,进而对区域径流产生重要影响[12],可诱发洪水[24-26]及断流[12,27-32]等灾害.通过建立夏季径流量对大气0 ℃层高度变化的响应关系,也可预测评估夏季河流径流量的变化[33-37].因此,夏季大气0 ℃层高度的变化不仅是大气热状况的反映,也是影响冰冻圈各要素变化的重要指标[38]. ...
1970—2012年夏半年中国大气0 ℃层高度时空变化特征
1
2017
... 研究指出在热带地区大气0 ℃层高度变化与海表温度密切相关,且是影响热带地区冰川变化的重要因素[8-10].近年来在我国西北、西南、黄河流域和高亚洲等地区,也进行了大气0 ℃层高度变化的研究,发现大气0 ℃层高度呈升高趋势,并与地面温度的变化呈显著正相关关系[11-20].在青藏高原地区,夏季大气0 ℃层高度的变化与冰川消融量[21]、零平衡线高度[22]以及冰川物质平衡[23]之间存在很好的线性关系,并直接影响冰川、积雪与冻土区的消融面积和强度,进而对区域径流产生重要影响[12],可诱发洪水[24-26]及断流[12,27-32]等灾害.通过建立夏季径流量对大气0 ℃层高度变化的响应关系,也可预测评估夏季河流径流量的变化[33-37].因此,夏季大气0 ℃层高度的变化不仅是大气热状况的反映,也是影响冰冻圈各要素变化的重要指标[38]. ...
Relationship between glacial thaw of Qilian Mountain and upper temperature
1
2002
... 研究指出在热带地区大气0 ℃层高度变化与海表温度密切相关,且是影响热带地区冰川变化的重要因素[8-10].近年来在我国西北、西南、黄河流域和高亚洲等地区,也进行了大气0 ℃层高度变化的研究,发现大气0 ℃层高度呈升高趋势,并与地面温度的变化呈显著正相关关系[11-20].在青藏高原地区,夏季大气0 ℃层高度的变化与冰川消融量[21]、零平衡线高度[22]以及冰川物质平衡[23]之间存在很好的线性关系,并直接影响冰川、积雪与冻土区的消融面积和强度,进而对区域径流产生重要影响[12],可诱发洪水[24-26]及断流[12,27-32]等灾害.通过建立夏季径流量对大气0 ℃层高度变化的响应关系,也可预测评估夏季河流径流量的变化[33-37].因此,夏季大气0 ℃层高度的变化不仅是大气热状况的反映,也是影响冰冻圈各要素变化的重要指标[38]. ...
祁连山冰川消融与高空气温变化的关系
1
2002
... 研究指出在热带地区大气0 ℃层高度变化与海表温度密切相关,且是影响热带地区冰川变化的重要因素[8-10].近年来在我国西北、西南、黄河流域和高亚洲等地区,也进行了大气0 ℃层高度变化的研究,发现大气0 ℃层高度呈升高趋势,并与地面温度的变化呈显著正相关关系[11-20].在青藏高原地区,夏季大气0 ℃层高度的变化与冰川消融量[21]、零平衡线高度[22]以及冰川物质平衡[23]之间存在很好的线性关系,并直接影响冰川、积雪与冻土区的消融面积和强度,进而对区域径流产生重要影响[12],可诱发洪水[24-26]及断流[12,27-32]等灾害.通过建立夏季径流量对大气0 ℃层高度变化的响应关系,也可预测评估夏季河流径流量的变化[33-37].因此,夏季大气0 ℃层高度的变化不仅是大气热状况的反映,也是影响冰冻圈各要素变化的重要指标[38]. ...
The response of the Glacier No.1 to the height change of the 0 ℃ level in summer at the riverhead of the Urumqi River, Tianshan mountains
1
2009
... 研究指出在热带地区大气0 ℃层高度变化与海表温度密切相关,且是影响热带地区冰川变化的重要因素[8-10].近年来在我国西北、西南、黄河流域和高亚洲等地区,也进行了大气0 ℃层高度变化的研究,发现大气0 ℃层高度呈升高趋势,并与地面温度的变化呈显著正相关关系[11-20].在青藏高原地区,夏季大气0 ℃层高度的变化与冰川消融量[21]、零平衡线高度[22]以及冰川物质平衡[23]之间存在很好的线性关系,并直接影响冰川、积雪与冻土区的消融面积和强度,进而对区域径流产生重要影响[12],可诱发洪水[24-26]及断流[12,27-32]等灾害.通过建立夏季径流量对大气0 ℃层高度变化的响应关系,也可预测评估夏季河流径流量的变化[33-37].因此,夏季大气0 ℃层高度的变化不仅是大气热状况的反映,也是影响冰冻圈各要素变化的重要指标[38]. ...
天山乌鲁木齐河源1号冰川对夏季0 ℃层高度变化的响应
1
2009
... 研究指出在热带地区大气0 ℃层高度变化与海表温度密切相关,且是影响热带地区冰川变化的重要因素[8-10].近年来在我国西北、西南、黄河流域和高亚洲等地区,也进行了大气0 ℃层高度变化的研究,发现大气0 ℃层高度呈升高趋势,并与地面温度的变化呈显著正相关关系[11-20].在青藏高原地区,夏季大气0 ℃层高度的变化与冰川消融量[21]、零平衡线高度[22]以及冰川物质平衡[23]之间存在很好的线性关系,并直接影响冰川、积雪与冻土区的消融面积和强度,进而对区域径流产生重要影响[12],可诱发洪水[24-26]及断流[12,27-32]等灾害.通过建立夏季径流量对大气0 ℃层高度变化的响应关系,也可预测评估夏季河流径流量的变化[33-37].因此,夏季大气0 ℃层高度的变化不仅是大气热状况的反映,也是影响冰冻圈各要素变化的重要指标[38]. ...
Recent changes in freezing level heights in High Asia and their impact on glacier changes
3
2014
... 研究指出在热带地区大气0 ℃层高度变化与海表温度密切相关,且是影响热带地区冰川变化的重要因素[8-10].近年来在我国西北、西南、黄河流域和高亚洲等地区,也进行了大气0 ℃层高度变化的研究,发现大气0 ℃层高度呈升高趋势,并与地面温度的变化呈显著正相关关系[11-20].在青藏高原地区,夏季大气0 ℃层高度的变化与冰川消融量[21]、零平衡线高度[22]以及冰川物质平衡[23]之间存在很好的线性关系,并直接影响冰川、积雪与冻土区的消融面积和强度,进而对区域径流产生重要影响[12],可诱发洪水[24-26]及断流[12,27-32]等灾害.通过建立夏季径流量对大气0 ℃层高度变化的响应关系,也可预测评估夏季河流径流量的变化[33-37].因此,夏季大气0 ℃层高度的变化不仅是大气热状况的反映,也是影响冰冻圈各要素变化的重要指标[38]. ...
... 采用探空站数据,以及ERA-Interim[17,39]和NCEP/NCAR[9,23,30-31,39-40]等再分析资料,对青藏高原不同区域的夏季大气0 ℃层高度变化进行了研究,但对青藏高原全局的研究相对薄弱.探空数据获取的大气0 ℃层高度可信度高,但由于青藏高原探空站稀少,无法获得整个高原面上大气0 ℃层高度的变化.再分析资料时空分布连续,由其可获得较高精度的大气0 ℃层高度变化[39,41-45].ERA5作为最新一代的再分析资料,与上一代的ERA-Interim再分析数据相比,其空间分辨率更高,数据质量更好[46-48].青藏高原夏季大气0 ℃层高度未来如何变化,目前尚无研究,也缺乏对夏季大气0 ℃层高度变化对青藏高原冰川变化影响方面的研究.基于此,本文的目的是:(1)综合探空站数据、ERA5再分析资料以及CMIP6模式数据,分析1979—2100年高原夏季大气0 ℃层高度变化的特征及规律.(2)从高原夏季大气0 ℃层高度变化角度,预估青藏高原冰川未来变化的可能态势. ...
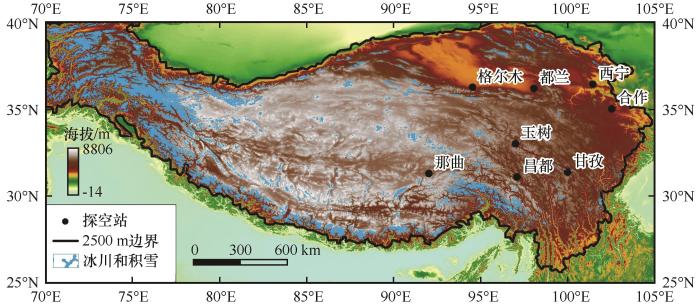
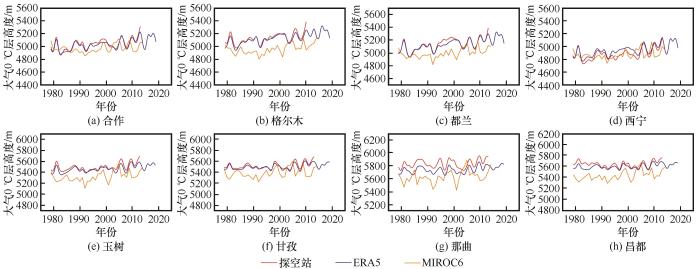
... 为检验ERA5再分析资料在青藏高原地区的适用性,以区域内有探空资料的8个台站(图1)为参考站(https://data.cma.cn/),选取地表、700 hPa、500 hPa和400 hPa逐月平均位势高度和温度计算大气0 ℃层高度.为了确保数据质量,使用最大惩罚F法[49-50]对原始探空数据进行均一性检验和订正[23,38],以消除或减少观测的系统误差. ...
Combined analysis of the spatiotemporal variations in snowmelt (ice) flood frequency in Xinjiang over 20 years and atmospheric circulation patterns
1
2021
... 研究指出在热带地区大气0 ℃层高度变化与海表温度密切相关,且是影响热带地区冰川变化的重要因素[8-10].近年来在我国西北、西南、黄河流域和高亚洲等地区,也进行了大气0 ℃层高度变化的研究,发现大气0 ℃层高度呈升高趋势,并与地面温度的变化呈显著正相关关系[11-20].在青藏高原地区,夏季大气0 ℃层高度的变化与冰川消融量[21]、零平衡线高度[22]以及冰川物质平衡[23]之间存在很好的线性关系,并直接影响冰川、积雪与冻土区的消融面积和强度,进而对区域径流产生重要影响[12],可诱发洪水[24-26]及断流[12,27-32]等灾害.通过建立夏季径流量对大气0 ℃层高度变化的响应关系,也可预测评估夏季河流径流量的变化[33-37].因此,夏季大气0 ℃层高度的变化不仅是大气热状况的反映,也是影响冰冻圈各要素变化的重要指标[38]. ...
近20 a新疆升温融雪(冰)型洪水频次时空变化及大气环流型分析
1
2021
... 研究指出在热带地区大气0 ℃层高度变化与海表温度密切相关,且是影响热带地区冰川变化的重要因素[8-10].近年来在我国西北、西南、黄河流域和高亚洲等地区,也进行了大气0 ℃层高度变化的研究,发现大气0 ℃层高度呈升高趋势,并与地面温度的变化呈显著正相关关系[11-20].在青藏高原地区,夏季大气0 ℃层高度的变化与冰川消融量[21]、零平衡线高度[22]以及冰川物质平衡[23]之间存在很好的线性关系,并直接影响冰川、积雪与冻土区的消融面积和强度,进而对区域径流产生重要影响[12],可诱发洪水[24-26]及断流[12,27-32]等灾害.通过建立夏季径流量对大气0 ℃层高度变化的响应关系,也可预测评估夏季河流径流量的变化[33-37].因此,夏季大气0 ℃层高度的变化不仅是大气热状况的反映,也是影响冰冻圈各要素变化的重要指标[38]. ...
Characteristics and effects of the extreme maximum air temperature in the summer of 2015 in Xinjiang under global warming
气候变暖背景下2015年夏季新疆极端高温过程及其影响
2016
Classification of snowmelt flood and analysis on its formation causes in the kumalak river basin
1
2011
... 研究指出在热带地区大气0 ℃层高度变化与海表温度密切相关,且是影响热带地区冰川变化的重要因素[8-10].近年来在我国西北、西南、黄河流域和高亚洲等地区,也进行了大气0 ℃层高度变化的研究,发现大气0 ℃层高度呈升高趋势,并与地面温度的变化呈显著正相关关系[11-20].在青藏高原地区,夏季大气0 ℃层高度的变化与冰川消融量[21]、零平衡线高度[22]以及冰川物质平衡[23]之间存在很好的线性关系,并直接影响冰川、积雪与冻土区的消融面积和强度,进而对区域径流产生重要影响[12],可诱发洪水[24-26]及断流[12,27-32]等灾害.通过建立夏季径流量对大气0 ℃层高度变化的响应关系,也可预测评估夏季河流径流量的变化[33-37].因此,夏季大气0 ℃层高度的变化不仅是大气热状况的反映,也是影响冰冻圈各要素变化的重要指标[38]. ...
阿克苏地区库玛拉克河流域融雪洪水分型及成因
1
2011
... 研究指出在热带地区大气0 ℃层高度变化与海表温度密切相关,且是影响热带地区冰川变化的重要因素[8-10].近年来在我国西北、西南、黄河流域和高亚洲等地区,也进行了大气0 ℃层高度变化的研究,发现大气0 ℃层高度呈升高趋势,并与地面温度的变化呈显著正相关关系[11-20].在青藏高原地区,夏季大气0 ℃层高度的变化与冰川消融量[21]、零平衡线高度[22]以及冰川物质平衡[23]之间存在很好的线性关系,并直接影响冰川、积雪与冻土区的消融面积和强度,进而对区域径流产生重要影响[12],可诱发洪水[24-26]及断流[12,27-32]等灾害.通过建立夏季径流量对大气0 ℃层高度变化的响应关系,也可预测评估夏季河流径流量的变化[33-37].因此,夏季大气0 ℃层高度的变化不仅是大气热状况的反映,也是影响冰冻圈各要素变化的重要指标[38]. ...
The response of annual runoff to the height change at the zero temperature level in summer over Xinjiang
1
2007
... 研究指出在热带地区大气0 ℃层高度变化与海表温度密切相关,且是影响热带地区冰川变化的重要因素[8-10].近年来在我国西北、西南、黄河流域和高亚洲等地区,也进行了大气0 ℃层高度变化的研究,发现大气0 ℃层高度呈升高趋势,并与地面温度的变化呈显著正相关关系[11-20].在青藏高原地区,夏季大气0 ℃层高度的变化与冰川消融量[21]、零平衡线高度[22]以及冰川物质平衡[23]之间存在很好的线性关系,并直接影响冰川、积雪与冻土区的消融面积和强度,进而对区域径流产生重要影响[12],可诱发洪水[24-26]及断流[12,27-32]等灾害.通过建立夏季径流量对大气0 ℃层高度变化的响应关系,也可预测评估夏季河流径流量的变化[33-37].因此,夏季大气0 ℃层高度的变化不仅是大气热状况的反映,也是影响冰冻圈各要素变化的重要指标[38]. ...
新疆夏季0 ℃层高度变化对河流年径流量的影响
1
2007
... 研究指出在热带地区大气0 ℃层高度变化与海表温度密切相关,且是影响热带地区冰川变化的重要因素[8-10].近年来在我国西北、西南、黄河流域和高亚洲等地区,也进行了大气0 ℃层高度变化的研究,发现大气0 ℃层高度呈升高趋势,并与地面温度的变化呈显著正相关关系[11-20].在青藏高原地区,夏季大气0 ℃层高度的变化与冰川消融量[21]、零平衡线高度[22]以及冰川物质平衡[23]之间存在很好的线性关系,并直接影响冰川、积雪与冻土区的消融面积和强度,进而对区域径流产生重要影响[12],可诱发洪水[24-26]及断流[12,27-32]等灾害.通过建立夏季径流量对大气0 ℃层高度变化的响应关系,也可预测评估夏季河流径流量的变化[33-37].因此,夏季大气0 ℃层高度的变化不仅是大气热状况的反映,也是影响冰冻圈各要素变化的重要指标[38]. ...
Analysis of changes in runoff and drying in the Tarim River from 2003 to 2012
2015
2003—2012年新疆塔里木河径流量变化与断流分析
2015
The response of glacial lake outburst floods to climate change in the Yarkant River, Xinjiang
2010
新疆叶尔羌河冰川湖突发洪水对气候变化的响应
2010
Response of summer average discharge in the Hotan River to changes in regional 0 ℃ level height
1
2008
... 采用探空站数据,以及ERA-Interim[17,39]和NCEP/NCAR[9,23,30-31,39-40]等再分析资料,对青藏高原不同区域的夏季大气0 ℃层高度变化进行了研究,但对青藏高原全局的研究相对薄弱.探空数据获取的大气0 ℃层高度可信度高,但由于青藏高原探空站稀少,无法获得整个高原面上大气0 ℃层高度的变化.再分析资料时空分布连续,由其可获得较高精度的大气0 ℃层高度变化[39,41-45].ERA5作为最新一代的再分析资料,与上一代的ERA-Interim再分析数据相比,其空间分辨率更高,数据质量更好[46-48].青藏高原夏季大气0 ℃层高度未来如何变化,目前尚无研究,也缺乏对夏季大气0 ℃层高度变化对青藏高原冰川变化影响方面的研究.基于此,本文的目的是:(1)综合探空站数据、ERA5再分析资料以及CMIP6模式数据,分析1979—2100年高原夏季大气0 ℃层高度变化的特征及规律.(2)从高原夏季大气0 ℃层高度变化角度,预估青藏高原冰川未来变化的可能态势. ...
和田河夏季流量对区域0 ℃层高度变化的响应
1
2008
... 采用探空站数据,以及ERA-Interim[17,39]和NCEP/NCAR[9,23,30-31,39-40]等再分析资料,对青藏高原不同区域的夏季大气0 ℃层高度变化进行了研究,但对青藏高原全局的研究相对薄弱.探空数据获取的大气0 ℃层高度可信度高,但由于青藏高原探空站稀少,无法获得整个高原面上大气0 ℃层高度的变化.再分析资料时空分布连续,由其可获得较高精度的大气0 ℃层高度变化[39,41-45].ERA5作为最新一代的再分析资料,与上一代的ERA-Interim再分析数据相比,其空间分辨率更高,数据质量更好[46-48].青藏高原夏季大气0 ℃层高度未来如何变化,目前尚无研究,也缺乏对夏季大气0 ℃层高度变化对青藏高原冰川变化影响方面的研究.基于此,本文的目的是:(1)综合探空站数据、ERA5再分析资料以及CMIP6模式数据,分析1979—2100年高原夏季大气0 ℃层高度变化的特征及规律.(2)从高原夏季大气0 ℃层高度变化角度,预估青藏高原冰川未来变化的可能态势. ...
Analyses on springtime runoff variance of Aksu River and its climate causes
1
2009
... 采用探空站数据,以及ERA-Interim[17,39]和NCEP/NCAR[9,23,30-31,39-40]等再分析资料,对青藏高原不同区域的夏季大气0 ℃层高度变化进行了研究,但对青藏高原全局的研究相对薄弱.探空数据获取的大气0 ℃层高度可信度高,但由于青藏高原探空站稀少,无法获得整个高原面上大气0 ℃层高度的变化.再分析资料时空分布连续,由其可获得较高精度的大气0 ℃层高度变化[39,41-45].ERA5作为最新一代的再分析资料,与上一代的ERA-Interim再分析数据相比,其空间分辨率更高,数据质量更好[46-48].青藏高原夏季大气0 ℃层高度未来如何变化,目前尚无研究,也缺乏对夏季大气0 ℃层高度变化对青藏高原冰川变化影响方面的研究.基于此,本文的目的是:(1)综合探空站数据、ERA5再分析资料以及CMIP6模式数据,分析1979—2100年高原夏季大气0 ℃层高度变化的特征及规律.(2)从高原夏季大气0 ℃层高度变化角度,预估青藏高原冰川未来变化的可能态势. ...
阿克苏河流域春季径流变化及气候成因分析
1
2009
... 采用探空站数据,以及ERA-Interim[17,39]和NCEP/NCAR[9,23,30-31,39-40]等再分析资料,对青藏高原不同区域的夏季大气0 ℃层高度变化进行了研究,但对青藏高原全局的研究相对薄弱.探空数据获取的大气0 ℃层高度可信度高,但由于青藏高原探空站稀少,无法获得整个高原面上大气0 ℃层高度的变化.再分析资料时空分布连续,由其可获得较高精度的大气0 ℃层高度变化[39,41-45].ERA5作为最新一代的再分析资料,与上一代的ERA-Interim再分析数据相比,其空间分辨率更高,数据质量更好[46-48].青藏高原夏季大气0 ℃层高度未来如何变化,目前尚无研究,也缺乏对夏季大气0 ℃层高度变化对青藏高原冰川变化影响方面的研究.基于此,本文的目的是:(1)综合探空站数据、ERA5再分析资料以及CMIP6模式数据,分析1979—2100年高原夏季大气0 ℃层高度变化的特征及规律.(2)从高原夏季大气0 ℃层高度变化角度,预估青藏高原冰川未来变化的可能态势. ...
The hydrological characteristics in Aksu River in lowflow year of 2009 and its effects on the ecological environment of the Tarim River mainstream
1
2010
... 研究指出在热带地区大气0 ℃层高度变化与海表温度密切相关,且是影响热带地区冰川变化的重要因素[8-10].近年来在我国西北、西南、黄河流域和高亚洲等地区,也进行了大气0 ℃层高度变化的研究,发现大气0 ℃层高度呈升高趋势,并与地面温度的变化呈显著正相关关系[11-20].在青藏高原地区,夏季大气0 ℃层高度的变化与冰川消融量[21]、零平衡线高度[22]以及冰川物质平衡[23]之间存在很好的线性关系,并直接影响冰川、积雪与冻土区的消融面积和强度,进而对区域径流产生重要影响[12],可诱发洪水[24-26]及断流[12,27-32]等灾害.通过建立夏季径流量对大气0 ℃层高度变化的响应关系,也可预测评估夏季河流径流量的变化[33-37].因此,夏季大气0 ℃层高度的变化不仅是大气热状况的反映,也是影响冰冻圈各要素变化的重要指标[38]. ...
2009年阿克苏河枯水年水文特征及其对塔里木河干流生态环境的影响
1
2010
... 研究指出在热带地区大气0 ℃层高度变化与海表温度密切相关,且是影响热带地区冰川变化的重要因素[8-10].近年来在我国西北、西南、黄河流域和高亚洲等地区,也进行了大气0 ℃层高度变化的研究,发现大气0 ℃层高度呈升高趋势,并与地面温度的变化呈显著正相关关系[11-20].在青藏高原地区,夏季大气0 ℃层高度的变化与冰川消融量[21]、零平衡线高度[22]以及冰川物质平衡[23]之间存在很好的线性关系,并直接影响冰川、积雪与冻土区的消融面积和强度,进而对区域径流产生重要影响[12],可诱发洪水[24-26]及断流[12,27-32]等灾害.通过建立夏季径流量对大气0 ℃层高度变化的响应关系,也可预测评估夏季河流径流量的变化[33-37].因此,夏季大气0 ℃层高度的变化不仅是大气热状况的反映,也是影响冰冻圈各要素变化的重要指标[38]. ...
Response of runoff to change of atmospheric 0 ℃ level height in summer in arid region of Northwest China
1
2012
... 研究指出在热带地区大气0 ℃层高度变化与海表温度密切相关,且是影响热带地区冰川变化的重要因素[8-10].近年来在我国西北、西南、黄河流域和高亚洲等地区,也进行了大气0 ℃层高度变化的研究,发现大气0 ℃层高度呈升高趋势,并与地面温度的变化呈显著正相关关系[11-20].在青藏高原地区,夏季大气0 ℃层高度的变化与冰川消融量[21]、零平衡线高度[22]以及冰川物质平衡[23]之间存在很好的线性关系,并直接影响冰川、积雪与冻土区的消融面积和强度,进而对区域径流产生重要影响[12],可诱发洪水[24-26]及断流[12,27-32]等灾害.通过建立夏季径流量对大气0 ℃层高度变化的响应关系,也可预测评估夏季河流径流量的变化[33-37].因此,夏季大气0 ℃层高度的变化不仅是大气热状况的反映,也是影响冰冻圈各要素变化的重要指标[38]. ...
中国西北干旱区夏季径流量对大气0 ℃层高度变化的响应
1
2012
... 研究指出在热带地区大气0 ℃层高度变化与海表温度密切相关,且是影响热带地区冰川变化的重要因素[8-10].近年来在我国西北、西南、黄河流域和高亚洲等地区,也进行了大气0 ℃层高度变化的研究,发现大气0 ℃层高度呈升高趋势,并与地面温度的变化呈显著正相关关系[11-20].在青藏高原地区,夏季大气0 ℃层高度的变化与冰川消融量[21]、零平衡线高度[22]以及冰川物质平衡[23]之间存在很好的线性关系,并直接影响冰川、积雪与冻土区的消融面积和强度,进而对区域径流产生重要影响[12],可诱发洪水[24-26]及断流[12,27-32]等灾害.通过建立夏季径流量对大气0 ℃层高度变化的响应关系,也可预测评估夏季河流径流量的变化[33-37].因此,夏季大气0 ℃层高度的变化不仅是大气热状况的反映,也是影响冰冻圈各要素变化的重要指标[38]. ...
Features of the snow and ice meltwater flood caused by high temperature in the Southern Xinjiang Region during the summer of 2015
2016
Relationship between streamflow in summer at the headwaters of Urumqi River in the Tianshan mountains and the 0 ℃ isotherm height
2012
天山乌鲁木齐河源区夏季径流量与0 ℃层高度的关系
2012
Relationship between the 0 ℃ layer height and the streamflow of the Urumqi River in the period of spring snowmelt
2010
春季融雪期0 ℃层高度与乌鲁木齐河径流量的关系
2010
Relationship of 0 ℃ level height and summer flood of Aksu River, Xinjiang
1
2004
... 研究指出在热带地区大气0 ℃层高度变化与海表温度密切相关,且是影响热带地区冰川变化的重要因素[8-10].近年来在我国西北、西南、黄河流域和高亚洲等地区,也进行了大气0 ℃层高度变化的研究,发现大气0 ℃层高度呈升高趋势,并与地面温度的变化呈显著正相关关系[11-20].在青藏高原地区,夏季大气0 ℃层高度的变化与冰川消融量[21]、零平衡线高度[22]以及冰川物质平衡[23]之间存在很好的线性关系,并直接影响冰川、积雪与冻土区的消融面积和强度,进而对区域径流产生重要影响[12],可诱发洪水[24-26]及断流[12,27-32]等灾害.通过建立夏季径流量对大气0 ℃层高度变化的响应关系,也可预测评估夏季河流径流量的变化[33-37].因此,夏季大气0 ℃层高度的变化不仅是大气热状况的反映,也是影响冰冻圈各要素变化的重要指标[38]. ...
0 ℃层高度与夏季阿克苏河洪水的关系
1
2004
... 研究指出在热带地区大气0 ℃层高度变化与海表温度密切相关,且是影响热带地区冰川变化的重要因素[8-10].近年来在我国西北、西南、黄河流域和高亚洲等地区,也进行了大气0 ℃层高度变化的研究,发现大气0 ℃层高度呈升高趋势,并与地面温度的变化呈显著正相关关系[11-20].在青藏高原地区,夏季大气0 ℃层高度的变化与冰川消融量[21]、零平衡线高度[22]以及冰川物质平衡[23]之间存在很好的线性关系,并直接影响冰川、积雪与冻土区的消融面积和强度,进而对区域径流产生重要影响[12],可诱发洪水[24-26]及断流[12,27-32]等灾害.通过建立夏季径流量对大气0 ℃层高度变化的响应关系,也可预测评估夏季河流径流量的变化[33-37].因此,夏季大气0 ℃层高度的变化不仅是大气热状况的反映,也是影响冰冻圈各要素变化的重要指标[38]. ...
Variability of atmospheric freezing-level height and its impact on the cryosphere in China
2
2011
... 研究指出在热带地区大气0 ℃层高度变化与海表温度密切相关,且是影响热带地区冰川变化的重要因素[8-10].近年来在我国西北、西南、黄河流域和高亚洲等地区,也进行了大气0 ℃层高度变化的研究,发现大气0 ℃层高度呈升高趋势,并与地面温度的变化呈显著正相关关系[11-20].在青藏高原地区,夏季大气0 ℃层高度的变化与冰川消融量[21]、零平衡线高度[22]以及冰川物质平衡[23]之间存在很好的线性关系,并直接影响冰川、积雪与冻土区的消融面积和强度,进而对区域径流产生重要影响[12],可诱发洪水[24-26]及断流[12,27-32]等灾害.通过建立夏季径流量对大气0 ℃层高度变化的响应关系,也可预测评估夏季河流径流量的变化[33-37].因此,夏季大气0 ℃层高度的变化不仅是大气热状况的反映,也是影响冰冻圈各要素变化的重要指标[38]. ...
... 为检验ERA5再分析资料在青藏高原地区的适用性,以区域内有探空资料的8个台站(图1)为参考站(https://data.cma.cn/),选取地表、700 hPa、500 hPa和400 hPa逐月平均位势高度和温度计算大气0 ℃层高度.为了确保数据质量,使用最大惩罚F法[49-50]对原始探空数据进行均一性检验和订正[23,38],以消除或减少观测的系统误差. ...
The freezing level height in the Qilian Mountains, northeast Tibetan Plateau based on reanalysis data and observations, 1979—2012
3
2015
... 采用探空站数据,以及ERA-Interim[17,39]和NCEP/NCAR[9,23,30-31,39-40]等再分析资料,对青藏高原不同区域的夏季大气0 ℃层高度变化进行了研究,但对青藏高原全局的研究相对薄弱.探空数据获取的大气0 ℃层高度可信度高,但由于青藏高原探空站稀少,无法获得整个高原面上大气0 ℃层高度的变化.再分析资料时空分布连续,由其可获得较高精度的大气0 ℃层高度变化[39,41-45].ERA5作为最新一代的再分析资料,与上一代的ERA-Interim再分析数据相比,其空间分辨率更高,数据质量更好[46-48].青藏高原夏季大气0 ℃层高度未来如何变化,目前尚无研究,也缺乏对夏季大气0 ℃层高度变化对青藏高原冰川变化影响方面的研究.基于此,本文的目的是:(1)综合探空站数据、ERA5再分析资料以及CMIP6模式数据,分析1979—2100年高原夏季大气0 ℃层高度变化的特征及规律.(2)从高原夏季大气0 ℃层高度变化角度,预估青藏高原冰川未来变化的可能态势. ...
... ,39-40]等再分析资料,对青藏高原不同区域的夏季大气0 ℃层高度变化进行了研究,但对青藏高原全局的研究相对薄弱.探空数据获取的大气0 ℃层高度可信度高,但由于青藏高原探空站稀少,无法获得整个高原面上大气0 ℃层高度的变化.再分析资料时空分布连续,由其可获得较高精度的大气0 ℃层高度变化[39,41-45].ERA5作为最新一代的再分析资料,与上一代的ERA-Interim再分析数据相比,其空间分辨率更高,数据质量更好[46-48].青藏高原夏季大气0 ℃层高度未来如何变化,目前尚无研究,也缺乏对夏季大气0 ℃层高度变化对青藏高原冰川变化影响方面的研究.基于此,本文的目的是:(1)综合探空站数据、ERA5再分析资料以及CMIP6模式数据,分析1979—2100年高原夏季大气0 ℃层高度变化的特征及规律.(2)从高原夏季大气0 ℃层高度变化角度,预估青藏高原冰川未来变化的可能态势. ...
... [39,41-45].ERA5作为最新一代的再分析资料,与上一代的ERA-Interim再分析数据相比,其空间分辨率更高,数据质量更好[46-48].青藏高原夏季大气0 ℃层高度未来如何变化,目前尚无研究,也缺乏对夏季大气0 ℃层高度变化对青藏高原冰川变化影响方面的研究.基于此,本文的目的是:(1)综合探空站数据、ERA5再分析资料以及CMIP6模式数据,分析1979—2100年高原夏季大气0 ℃层高度变化的特征及规律.(2)从高原夏季大气0 ℃层高度变化角度,预估青藏高原冰川未来变化的可能态势. ...
Spatio-temporal changes in free-air freezing level heights in Northwest China, 1960-2012
1
2013
... 采用探空站数据,以及ERA-Interim[17,39]和NCEP/NCAR[9,23,30-31,39-40]等再分析资料,对青藏高原不同区域的夏季大气0 ℃层高度变化进行了研究,但对青藏高原全局的研究相对薄弱.探空数据获取的大气0 ℃层高度可信度高,但由于青藏高原探空站稀少,无法获得整个高原面上大气0 ℃层高度的变化.再分析资料时空分布连续,由其可获得较高精度的大气0 ℃层高度变化[39,41-45].ERA5作为最新一代的再分析资料,与上一代的ERA-Interim再分析数据相比,其空间分辨率更高,数据质量更好[46-48].青藏高原夏季大气0 ℃层高度未来如何变化,目前尚无研究,也缺乏对夏季大气0 ℃层高度变化对青藏高原冰川变化影响方面的研究.基于此,本文的目的是:(1)综合探空站数据、ERA5再分析资料以及CMIP6模式数据,分析1979—2100年高原夏季大气0 ℃层高度变化的特征及规律.(2)从高原夏季大气0 ℃层高度变化角度,预估青藏高原冰川未来变化的可能态势. ...
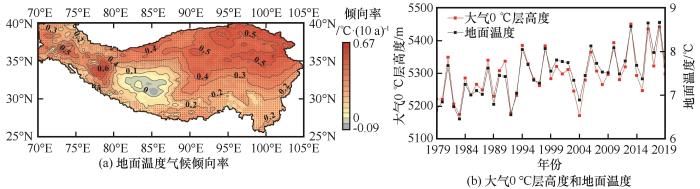
Ground temperature spatial and temporal variation in Qinghai-Xizang Plateau in recent 10 years
1
2020
... 采用探空站数据,以及ERA-Interim[17,39]和NCEP/NCAR[9,23,30-31,39-40]等再分析资料,对青藏高原不同区域的夏季大气0 ℃层高度变化进行了研究,但对青藏高原全局的研究相对薄弱.探空数据获取的大气0 ℃层高度可信度高,但由于青藏高原探空站稀少,无法获得整个高原面上大气0 ℃层高度的变化.再分析资料时空分布连续,由其可获得较高精度的大气0 ℃层高度变化[39,41-45].ERA5作为最新一代的再分析资料,与上一代的ERA-Interim再分析数据相比,其空间分辨率更高,数据质量更好[46-48].青藏高原夏季大气0 ℃层高度未来如何变化,目前尚无研究,也缺乏对夏季大气0 ℃层高度变化对青藏高原冰川变化影响方面的研究.基于此,本文的目的是:(1)综合探空站数据、ERA5再分析资料以及CMIP6模式数据,分析1979—2100年高原夏季大气0 ℃层高度变化的特征及规律.(2)从高原夏季大气0 ℃层高度变化角度,预估青藏高原冰川未来变化的可能态势. ...
近10 a来青藏高原地表温度时空变化特征分析
1
2020
... 采用探空站数据,以及ERA-Interim[17,39]和NCEP/NCAR[9,23,30-31,39-40]等再分析资料,对青藏高原不同区域的夏季大气0 ℃层高度变化进行了研究,但对青藏高原全局的研究相对薄弱.探空数据获取的大气0 ℃层高度可信度高,但由于青藏高原探空站稀少,无法获得整个高原面上大气0 ℃层高度的变化.再分析资料时空分布连续,由其可获得较高精度的大气0 ℃层高度变化[39,41-45].ERA5作为最新一代的再分析资料,与上一代的ERA-Interim再分析数据相比,其空间分辨率更高,数据质量更好[46-48].青藏高原夏季大气0 ℃层高度未来如何变化,目前尚无研究,也缺乏对夏季大气0 ℃层高度变化对青藏高原冰川变化影响方面的研究.基于此,本文的目的是:(1)综合探空站数据、ERA5再分析资料以及CMIP6模式数据,分析1979—2100年高原夏季大气0 ℃层高度变化的特征及规律.(2)从高原夏季大气0 ℃层高度变化角度,预估青藏高原冰川未来变化的可能态势. ...
The applicability of ERA-Interim land surface temperature dataset to map the permafrost distribution over the Tibetan Plateau
2015
ERA-Interim地表温度数据集在青藏高原冻土分布制图应用的适用性评估
2015
Applicability analysis of three reanalysis surface temperature data over the Tibetan Plateau
2013
三种再分析地表温度资料在青藏高原区域的适用性分析
2013
Preliminary comparison and analyses of air temperature at 2 m height between three reanalysis data-sets and observation in the east of Qinghai-Xiang Plateau
2012
青藏高原东部三种再分析资料与地面气温观测资料的对比分析
2012
Characteristic and correlation between surface temperature and 0 ℃ isotherm height derived from ERA-interim reanalysis and radiosonde data
1
2017
... 采用探空站数据,以及ERA-Interim[17,39]和NCEP/NCAR[9,23,30-31,39-40]等再分析资料,对青藏高原不同区域的夏季大气0 ℃层高度变化进行了研究,但对青藏高原全局的研究相对薄弱.探空数据获取的大气0 ℃层高度可信度高,但由于青藏高原探空站稀少,无法获得整个高原面上大气0 ℃层高度的变化.再分析资料时空分布连续,由其可获得较高精度的大气0 ℃层高度变化[39,41-45].ERA5作为最新一代的再分析资料,与上一代的ERA-Interim再分析数据相比,其空间分辨率更高,数据质量更好[46-48].青藏高原夏季大气0 ℃层高度未来如何变化,目前尚无研究,也缺乏对夏季大气0 ℃层高度变化对青藏高原冰川变化影响方面的研究.基于此,本文的目的是:(1)综合探空站数据、ERA5再分析资料以及CMIP6模式数据,分析1979—2100年高原夏季大气0 ℃层高度变化的特征及规律.(2)从高原夏季大气0 ℃层高度变化角度,预估青藏高原冰川未来变化的可能态势. ...
利用再分析与探空资料对0 ℃层高度和地面气温变化特征及其相关性的分析
1
2017
... 采用探空站数据,以及ERA-Interim[17,39]和NCEP/NCAR[9,23,30-31,39-40]等再分析资料,对青藏高原不同区域的夏季大气0 ℃层高度变化进行了研究,但对青藏高原全局的研究相对薄弱.探空数据获取的大气0 ℃层高度可信度高,但由于青藏高原探空站稀少,无法获得整个高原面上大气0 ℃层高度的变化.再分析资料时空分布连续,由其可获得较高精度的大气0 ℃层高度变化[39,41-45].ERA5作为最新一代的再分析资料,与上一代的ERA-Interim再分析数据相比,其空间分辨率更高,数据质量更好[46-48].青藏高原夏季大气0 ℃层高度未来如何变化,目前尚无研究,也缺乏对夏季大气0 ℃层高度变化对青藏高原冰川变化影响方面的研究.基于此,本文的目的是:(1)综合探空站数据、ERA5再分析资料以及CMIP6模式数据,分析1979—2100年高原夏季大气0 ℃层高度变化的特征及规律.(2)从高原夏季大气0 ℃层高度变化角度,预估青藏高原冰川未来变化的可能态势. ...
Applicability of ERA reanalysis data of land surface temperature in Zhejiang Province
1
2019
... 采用探空站数据,以及ERA-Interim[17,39]和NCEP/NCAR[9,23,30-31,39-40]等再分析资料,对青藏高原不同区域的夏季大气0 ℃层高度变化进行了研究,但对青藏高原全局的研究相对薄弱.探空数据获取的大气0 ℃层高度可信度高,但由于青藏高原探空站稀少,无法获得整个高原面上大气0 ℃层高度的变化.再分析资料时空分布连续,由其可获得较高精度的大气0 ℃层高度变化[39,41-45].ERA5作为最新一代的再分析资料,与上一代的ERA-Interim再分析数据相比,其空间分辨率更高,数据质量更好[46-48].青藏高原夏季大气0 ℃层高度未来如何变化,目前尚无研究,也缺乏对夏季大气0 ℃层高度变化对青藏高原冰川变化影响方面的研究.基于此,本文的目的是:(1)综合探空站数据、ERA5再分析资料以及CMIP6模式数据,分析1979—2100年高原夏季大气0 ℃层高度变化的特征及规律.(2)从高原夏季大气0 ℃层高度变化角度,预估青藏高原冰川未来变化的可能态势. ...
ERA再分析陆面温度资料在浙江省的适用性
1
2019
... 采用探空站数据,以及ERA-Interim[17,39]和NCEP/NCAR[9,23,30-31,39-40]等再分析资料,对青藏高原不同区域的夏季大气0 ℃层高度变化进行了研究,但对青藏高原全局的研究相对薄弱.探空数据获取的大气0 ℃层高度可信度高,但由于青藏高原探空站稀少,无法获得整个高原面上大气0 ℃层高度的变化.再分析资料时空分布连续,由其可获得较高精度的大气0 ℃层高度变化[39,41-45].ERA5作为最新一代的再分析资料,与上一代的ERA-Interim再分析数据相比,其空间分辨率更高,数据质量更好[46-48].青藏高原夏季大气0 ℃层高度未来如何变化,目前尚无研究,也缺乏对夏季大气0 ℃层高度变化对青藏高原冰川变化影响方面的研究.基于此,本文的目的是:(1)综合探空站数据、ERA5再分析资料以及CMIP6模式数据,分析1979—2100年高原夏季大气0 ℃层高度变化的特征及规律.(2)从高原夏季大气0 ℃层高度变化角度,预估青藏高原冰川未来变化的可能态势. ...
Preliminarily assessment of ERA5 reanalysis data
2018
Effects of shallow residual layer on the development of the convective boundary layer in Naqu area
1
2020
... 采用探空站数据,以及ERA-Interim[17,39]和NCEP/NCAR[9,23,30-31,39-40]等再分析资料,对青藏高原不同区域的夏季大气0 ℃层高度变化进行了研究,但对青藏高原全局的研究相对薄弱.探空数据获取的大气0 ℃层高度可信度高,但由于青藏高原探空站稀少,无法获得整个高原面上大气0 ℃层高度的变化.再分析资料时空分布连续,由其可获得较高精度的大气0 ℃层高度变化[39,41-45].ERA5作为最新一代的再分析资料,与上一代的ERA-Interim再分析数据相比,其空间分辨率更高,数据质量更好[46-48].青藏高原夏季大气0 ℃层高度未来如何变化,目前尚无研究,也缺乏对夏季大气0 ℃层高度变化对青藏高原冰川变化影响方面的研究.基于此,本文的目的是:(1)综合探空站数据、ERA5再分析资料以及CMIP6模式数据,分析1979—2100年高原夏季大气0 ℃层高度变化的特征及规律.(2)从高原夏季大气0 ℃层高度变化角度,预估青藏高原冰川未来变化的可能态势. ...
那曲地区浅薄残余层对对流边界层发展的影响
1
2020
... 采用探空站数据,以及ERA-Interim[17,39]和NCEP/NCAR[9,23,30-31,39-40]等再分析资料,对青藏高原不同区域的夏季大气0 ℃层高度变化进行了研究,但对青藏高原全局的研究相对薄弱.探空数据获取的大气0 ℃层高度可信度高,但由于青藏高原探空站稀少,无法获得整个高原面上大气0 ℃层高度的变化.再分析资料时空分布连续,由其可获得较高精度的大气0 ℃层高度变化[39,41-45].ERA5作为最新一代的再分析资料,与上一代的ERA-Interim再分析数据相比,其空间分辨率更高,数据质量更好[46-48].青藏高原夏季大气0 ℃层高度未来如何变化,目前尚无研究,也缺乏对夏季大气0 ℃层高度变化对青藏高原冰川变化影响方面的研究.基于此,本文的目的是:(1)综合探空站数据、ERA5再分析资料以及CMIP6模式数据,分析1979—2100年高原夏季大气0 ℃层高度变化的特征及规律.(2)从高原夏季大气0 ℃层高度变化角度,预估青藏高原冰川未来变化的可能态势. ...
Accounting for autocorrelation in detecting mean shifts in climate data series using the penalized maximal t or F test
1
2008
... 为检验ERA5再分析资料在青藏高原地区的适用性,以区域内有探空资料的8个台站(图1)为参考站(https://data.cma.cn/),选取地表、700 hPa、500 hPa和400 hPa逐月平均位势高度和温度计算大气0 ℃层高度.为了确保数据质量,使用最大惩罚F法[49-50]对原始探空数据进行均一性检验和订正[23,38],以消除或减少观测的系统误差. ...
Penalized maximal F test for detecting undocumented mean shift without trend change
1
2008
... 为检验ERA5再分析资料在青藏高原地区的适用性,以区域内有探空资料的8个台站(图1)为参考站(https://data.cma.cn/),选取地表、700 hPa、500 hPa和400 hPa逐月平均位势高度和温度计算大气0 ℃层高度.为了确保数据质量,使用最大惩罚F法[49-50]对原始探空数据进行均一性检验和订正[23,38],以消除或减少观测的系统误差. ...
The scenario model intercomparison project (ScenarioMIP) for CMIP6
1
2016
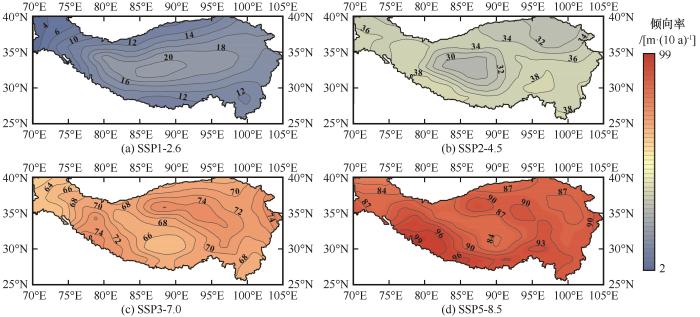
... 为探讨未来大气0 ℃层高度的变化,采用国际耦合模式比较计划第六阶段(CMIP6)的MIROC6模式模拟结果(https://esgf-node.llnl.gov/projects/cmip6/),其空间分辨率为1.4°×1.4°,模拟时段为1979—2100年.选取SSP1-2.6、SSP2-4.5、SSP3-7.0和SSP5-8.5四种共享社会经济路径情景下[51-52],三个标准气压层(600 hPa、500 hPa和400 hPa)的逐月平均位势高度和温度数据.为与探空站和ERA5再分析资料比较,采用双线性插值方法将MIROC6模式数据插值到0.25°×0.25°的经纬网格上. ...
Short commentary on CMIP6 scenario model intercomparison project(ScenarioMIP)
1
2019
... 为探讨未来大气0 ℃层高度的变化,采用国际耦合模式比较计划第六阶段(CMIP6)的MIROC6模式模拟结果(https://esgf-node.llnl.gov/projects/cmip6/),其空间分辨率为1.4°×1.4°,模拟时段为1979—2100年.选取SSP1-2.6、SSP2-4.5、SSP3-7.0和SSP5-8.5四种共享社会经济路径情景下[51-52],三个标准气压层(600 hPa、500 hPa和400 hPa)的逐月平均位势高度和温度数据.为与探空站和ERA5再分析资料比较,采用双线性插值方法将MIROC6模式数据插值到0.25°×0.25°的经纬网格上. ...
CMIP6情景模式比较计划(ScenarioMIP)概况与评述
1
2019
... 为探讨未来大气0 ℃层高度的变化,采用国际耦合模式比较计划第六阶段(CMIP6)的MIROC6模式模拟结果(https://esgf-node.llnl.gov/projects/cmip6/),其空间分辨率为1.4°×1.4°,模拟时段为1979—2100年.选取SSP1-2.6、SSP2-4.5、SSP3-7.0和SSP5-8.5四种共享社会经济路径情景下[51-52],三个标准气压层(600 hPa、500 hPa和400 hPa)的逐月平均位势高度和温度数据.为与探空站和ERA5再分析资料比较,采用双线性插值方法将MIROC6模式数据插值到0.25°×0.25°的经纬网格上. ...
1
2007
... 气候倾向率反映了各气候因子长期趋势变化的方向和程度.采用最小二乘法计算气候要素与时间的线性回归系数a,使气候要素的变化可用一元线性回归方程表示[53],其计算公式为: ...
1
2007
... 气候倾向率反映了各气候因子长期趋势变化的方向和程度.采用最小二乘法计算气候要素与时间的线性回归系数a,使气候要素的变化可用一元线性回归方程表示[53],其计算公式为: ...
Glacier changes in the Qilian Mountains in the past half century: based on the revised First and Second Chinese Glacier Inventory
2
2015
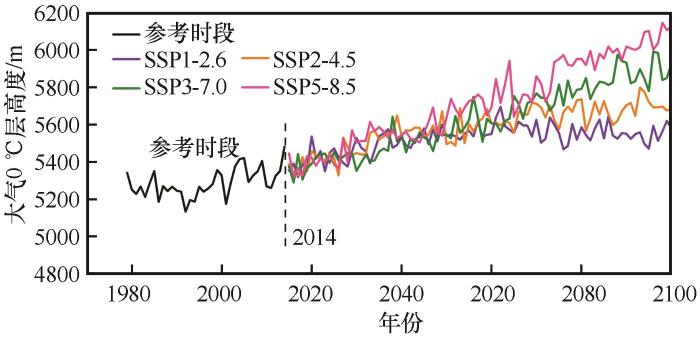
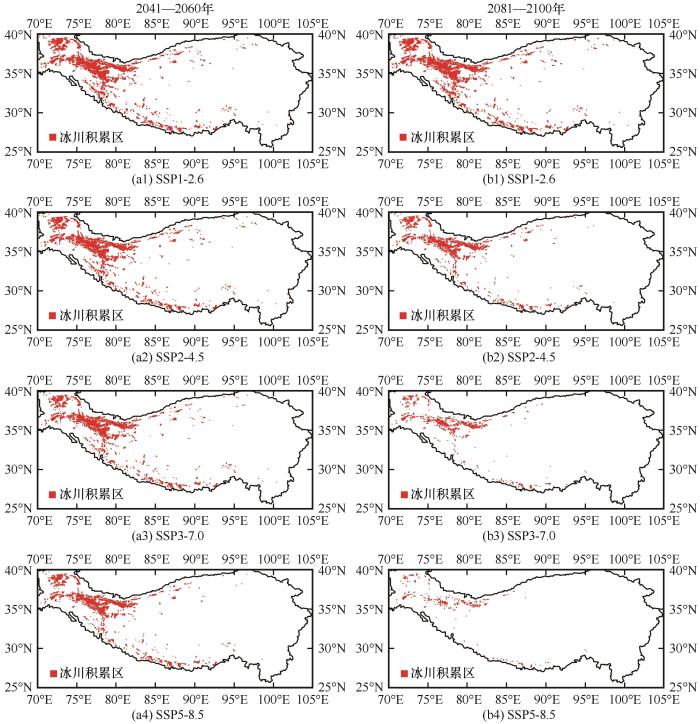
... 夏季大气0 ℃层高度的快速升高,对以冰冻圈地貌为主的青藏高原而言,必然会造成消融面积的扩大,引起积雪、冰川和冻土的加速融化.当夏季大气0 ℃层高度超过冰川顶部时,意味着夏季冰川完全处于消融状态,冰川积累区消失并将加速消融.在不同情景下,选取21世纪中叶(2041—2060年)和21世纪末期(2081—2100年)两个时间段,计算青藏高原夏季冰川表面高度低于大气0 ℃高度的面积占冰川总面积的比例(图9).在SSP1-2.6、SSP2-4.5、SSP3-7.0和SSP5-8.5情景下,2041—2060年处于大气0 ℃层高度以下的冰川面积分别是2014年第二次冰川编目[54]时的78%、80%、82%和87%,而到2081—2100年,面积比则分别增加到了79%、86%、94%和98%.仅从夏季大气0 ℃层高度变化角度看,在SSP5-8.5情景下,到本世纪末期,预估除帕米尔高原和昆仑山西北部地区外,青藏高原其他地区冰川在夏季都将不存在积累区. ...
... 以祁连山冰川为例,更能说明夏季大气0 ℃层高度的变化对青藏高原冰冻圈的影响.祁连山地区(36.5°~39.5° N,93.5°~103° E)在1980s夏季大气0 ℃层高度约为4 839 m,到2010s则升高到5 026 m,仅仅30 a夏季大气0 ℃层高度升高了约187 m,意味着祁连山地区夏季冰川积累区急速缩小,而消融区急速扩大.基于第一次和第二次冰川编目数据,发现近50 a祁连山海拔4 000 m以下的冰川已完全消失,海拔4 350~5 100 m区间冰川面积减少量占冰川面积总损失的84.24%[54].祁连山地区冰川顶部海拔一般不超过5 200 m.在SSP1-2.6、SSP2-4.5、SSP3-7.0和SSP5-8.5情景下,夏季大气0 ℃层高度在祁连山地区将分别在2083年、2066年、2052年和2038年达到5 200 m,仅从夏季大气0 ℃层高度变化角度看,夏季整个冰川都处于消融状态,这与从物质能量平衡角度预估的祁连山冰川变化结论一致[55].这对受冰川融水影响较大的西北干旱区河流径流而言,短期冰川融水的增加会调节河流径流,而当冰川得不到足够的降水补充时,冰川的退化必然影响到下游的河流径流,需尽快制定规划以应对水资源的变化. ...
近50年来祁连山冰川变化——基于中国第一、二次冰川编目数据
2
2015
... 夏季大气0 ℃层高度的快速升高,对以冰冻圈地貌为主的青藏高原而言,必然会造成消融面积的扩大,引起积雪、冰川和冻土的加速融化.当夏季大气0 ℃层高度超过冰川顶部时,意味着夏季冰川完全处于消融状态,冰川积累区消失并将加速消融.在不同情景下,选取21世纪中叶(2041—2060年)和21世纪末期(2081—2100年)两个时间段,计算青藏高原夏季冰川表面高度低于大气0 ℃高度的面积占冰川总面积的比例(图9).在SSP1-2.6、SSP2-4.5、SSP3-7.0和SSP5-8.5情景下,2041—2060年处于大气0 ℃层高度以下的冰川面积分别是2014年第二次冰川编目[54]时的78%、80%、82%和87%,而到2081—2100年,面积比则分别增加到了79%、86%、94%和98%.仅从夏季大气0 ℃层高度变化角度看,在SSP5-8.5情景下,到本世纪末期,预估除帕米尔高原和昆仑山西北部地区外,青藏高原其他地区冰川在夏季都将不存在积累区. ...
... 以祁连山冰川为例,更能说明夏季大气0 ℃层高度的变化对青藏高原冰冻圈的影响.祁连山地区(36.5°~39.5° N,93.5°~103° E)在1980s夏季大气0 ℃层高度约为4 839 m,到2010s则升高到5 026 m,仅仅30 a夏季大气0 ℃层高度升高了约187 m,意味着祁连山地区夏季冰川积累区急速缩小,而消融区急速扩大.基于第一次和第二次冰川编目数据,发现近50 a祁连山海拔4 000 m以下的冰川已完全消失,海拔4 350~5 100 m区间冰川面积减少量占冰川面积总损失的84.24%[54].祁连山地区冰川顶部海拔一般不超过5 200 m.在SSP1-2.6、SSP2-4.5、SSP3-7.0和SSP5-8.5情景下,夏季大气0 ℃层高度在祁连山地区将分别在2083年、2066年、2052年和2038年达到5 200 m,仅从夏季大气0 ℃层高度变化角度看,夏季整个冰川都处于消融状态,这与从物质能量平衡角度预估的祁连山冰川变化结论一致[55].这对受冰川融水影响较大的西北干旱区河流径流而言,短期冰川融水的增加会调节河流径流,而当冰川得不到足够的降水补充时,冰川的退化必然影响到下游的河流径流,需尽快制定规划以应对水资源的变化. ...
Simulation and prediction of equilibrium line altitude of glaciers in the eastern Tibetan Plateau
1
2017
... 以祁连山冰川为例,更能说明夏季大气0 ℃层高度的变化对青藏高原冰冻圈的影响.祁连山地区(36.5°~39.5° N,93.5°~103° E)在1980s夏季大气0 ℃层高度约为4 839 m,到2010s则升高到5 026 m,仅仅30 a夏季大气0 ℃层高度升高了约187 m,意味着祁连山地区夏季冰川积累区急速缩小,而消融区急速扩大.基于第一次和第二次冰川编目数据,发现近50 a祁连山海拔4 000 m以下的冰川已完全消失,海拔4 350~5 100 m区间冰川面积减少量占冰川面积总损失的84.24%[54].祁连山地区冰川顶部海拔一般不超过5 200 m.在SSP1-2.6、SSP2-4.5、SSP3-7.0和SSP5-8.5情景下,夏季大气0 ℃层高度在祁连山地区将分别在2083年、2066年、2052年和2038年达到5 200 m,仅从夏季大气0 ℃层高度变化角度看,夏季整个冰川都处于消融状态,这与从物质能量平衡角度预估的祁连山冰川变化结论一致[55].这对受冰川融水影响较大的西北干旱区河流径流而言,短期冰川融水的增加会调节河流径流,而当冰川得不到足够的降水补充时,冰川的退化必然影响到下游的河流径流,需尽快制定规划以应对水资源的变化. ...
青藏高原东部冰川平衡线高度的模拟及预测
1
2017
... 以祁连山冰川为例,更能说明夏季大气0 ℃层高度的变化对青藏高原冰冻圈的影响.祁连山地区(36.5°~39.5° N,93.5°~103° E)在1980s夏季大气0 ℃层高度约为4 839 m,到2010s则升高到5 026 m,仅仅30 a夏季大气0 ℃层高度升高了约187 m,意味着祁连山地区夏季冰川积累区急速缩小,而消融区急速扩大.基于第一次和第二次冰川编目数据,发现近50 a祁连山海拔4 000 m以下的冰川已完全消失,海拔4 350~5 100 m区间冰川面积减少量占冰川面积总损失的84.24%[54].祁连山地区冰川顶部海拔一般不超过5 200 m.在SSP1-2.6、SSP2-4.5、SSP3-7.0和SSP5-8.5情景下,夏季大气0 ℃层高度在祁连山地区将分别在2083年、2066年、2052年和2038年达到5 200 m,仅从夏季大气0 ℃层高度变化角度看,夏季整个冰川都处于消融状态,这与从物质能量平衡角度预估的祁连山冰川变化结论一致[55].这对受冰川融水影响较大的西北干旱区河流径流而言,短期冰川融水的增加会调节河流径流,而当冰川得不到足够的降水补充时,冰川的退化必然影响到下游的河流径流,需尽快制定规划以应对水资源的变化. ...


 甘公网安备 62010202000676号