


0 引言
随着遥感技术的应用,北极地区在河冰物候变化方面取得丰富成果[25,27]。由于监测困难及遥感技术在冰厚反演方面的局限性[44-46],阿拉斯加地区大范围长尺度的冰厚研究匮乏。为了获取河冰厚度,发展了诸多河冰模型[47-49]。在河冰研究中,相对复杂的模型对获取单点或少数点位冰厚具有重要作用。然而,由于这些模型所需输入参数较多且有些参数不易获取,对于大范围的河冰研究具有局限性。基于冰体变化对气候变化的敏感性[50-51],诸多以气温为基础的经验模型被用来研究河冰变化[52-55]。Stefan方程利用河冰厚度与冻结指数的关系以及冰的性质计算冰厚,且其常被简化为冰厚与冻结指数的关系,被广泛用于河冰厚度估算[56],也经常结合土壤指数用于多年冻土区活动层厚度估算等[13,57-59],适用于大范围反演河冰厚度。
本研究致力于利用Stefan方程、实测最大河冰厚度数据和CMIP6 CanEMS5模式在1850—2100年的日气温数据,重建和预测阿拉斯加地区1850—2100年最大河冰厚度,并分析其时空变化特征。
1 数据来源
1.1 河冰厚度数据
阿拉斯加-太平洋河冰预测中心利用钻孔和标尺等方式对阿拉斯加地区的河冰厚度进行了测量和记录(
图1
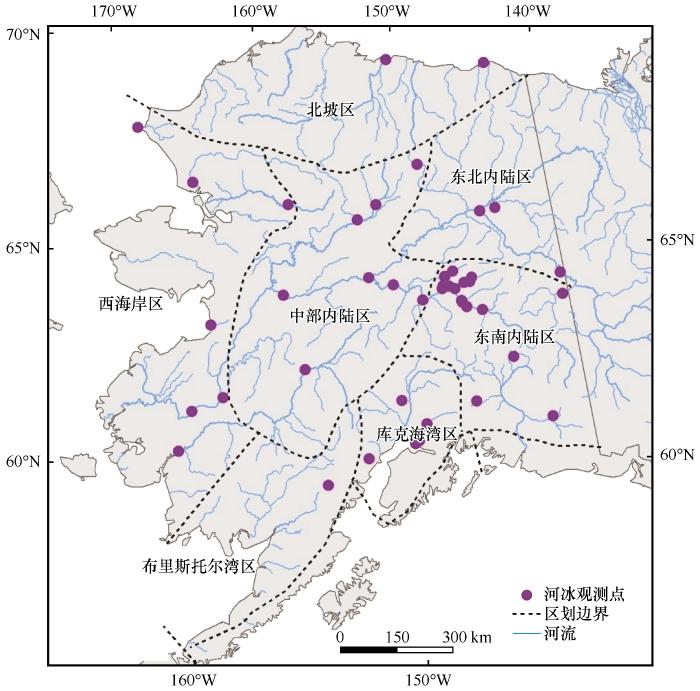
根据阿拉斯加自然区划图[60],该气候区划图根据1977—2010年气象站点月均温数据建立,这些站点在主要的自然区均有分布。其中,2个分布在北坡区,7个在西海岸区,8个在中部内陆区,3个在东北内陆区,1个在布里斯托尔湾区,7个在库克海湾区,剩余20个分布在东南内陆区。
1.2 CMIP6气温数据
第六次国际耦合模式比较计划(Coupled Model Intercomparison Project Phase 6,CMIP6)基于不同的共享社会经济路径(shared socio-economic pathways,SSP)及最新的人为排放趋势,提出了新的预估情景。本研究选用CMIP6 CanEMS5模式在1850—2100年的日气温数据,包括1个历史实验数据(1850—2014年)及四个不同预测情景(SSP126、SSP245、SSP370和SSP585;2015—2100年)。其中,SSP126代表了低脆弱性、低减缓压力和低辐射强迫的综合影响,SSP245为中等社会脆弱性与中等辐射强迫的组合,SSP370代表了高社会脆弱性与相对高的人为辐射强迫的组合,而SSP585是一种高强迫情景,是唯一可以实现2100年人为辐射强迫达到8.5 W·m-2的共享社会经济路径[61-62]。
2 研究方法
2.1 最大冰厚的确定
若在一个冻融周期内,记录值中的最大值不是最后一个记录值,则认为该最大值即为此年最大冰厚;若最大值为最后一个记录值,但该值出现在以往最大值出现日期的前后10日内,也认为该值为当年最大冰厚记录。利用该方法,查找并确定48个站点每个冻融周期内的最大河冰厚度。
2.2 冻结指数FI
冻结指数FI(freezing index)指给定时段内的负积温[13],见
式中:N为给定时段内的总天数;Ti 第i天的日平均气温。根据河冰的冻融周期,本研究将7月1日—次年6月30日作为统计年冻结指数(AFI, annual freezing index)的时段。
2.3 Stefan方程
Stefan方程[56][
式中:h为待估算的冰厚度;h0为初始冰厚度;ki为冰热导率;ρi为冰密度;Li为融化潜热。
2.4 最大河冰厚度估算
若以7月1日为初始日期进行河冰厚度的估算,此时初始冰厚为0(h0=0),则
在区域尺度上,获取冰热导率ki、冰密度ρi和融化潜热Li这些参数难度很大,这限制了Stefan方程在区域尺度的使用。然而,河冰厚度与FI呈现较好的线性关系[30],故此可将3个难以获得的参数简化为一个整体参数E[
式中:E值为冰的导热系数和融化潜热的综合指标。FI为7月1日至待估算日期的冻结指数。
在计算最大河冰厚度时,FI为7月1日至春季冰厚开始减薄时的冻结指数。虽然河冰开始减薄的日期难以确定,但开始减薄后的负温较少,故可以将FI近似为年冻结指数(AFI)。即
本文首先利用CMIP6近地表日气温数据,统计各河冰观测点处的年冻结指数AFI。然后结合对应的最大河冰厚度观测值,利用
2.5 最大河冰厚度精度评价
图2
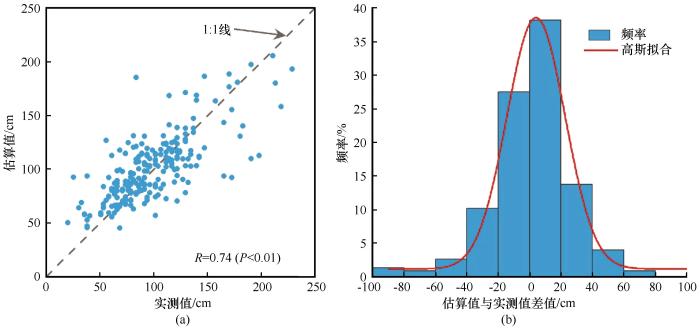
图2
最大河冰厚度野外实测值与利用年冻结指数估算的结果的对比分析(a)(灰色虚线为1∶1线)及估算值与实测值差值频率分布直方图(b)
Fig. 2
Results of regression analysis between the MRITs (maximum river ice thicknesses) from gauging sites and the MRITs estimated using Equation (5) [The gray dash line is y=x (a)] and frequency histogram of differences between the MRITs from gauging sites and the MRITs estimated using equation (b)
为验证估算数据在趋势分析上的精确度,利用Sen斜率分析了估算的最大河冰厚度在1961—2014年下降速率为(-2.40±0.13) cm·(10a)-1,接近实测数据在该时段的下降速率(-2.60±0.17) cm·(10a)-1[30],验证了估算数据在趋势分析上的准确性。
可以看出,利用70%的数据参与E值运算,最终获取的最大冰厚具有相对可靠的精度,说明了利用E因子估算最大冰厚的可行性。需要指出的是,更多的年份获取的E值更能代表站点的真实状态,故在本文的最终估算中将所有年份纳入E因子的获取。
3 结果与分析
3.1 最大河冰厚度空间差异
利用以上计算的E值,以及基于CMIP6历史实验数据的1850—2014年和四个未来情景(SSP126、SSP245、SSP370和SSP585)下的2015—2100年近地表日气温数据获取的年冻结指数,重建和预测了各站点1850—2100年的最大河冰厚度。在分析多年平均最大冰厚的空间特征时,考虑到1850—2100年时段较长,为挖掘更为精细的冰厚变化,以每50年人为划分成一个时段进行了分析,即分别统计了1850—1900年、1900—1950年、1950—2000年、2015—2050年和2050—2100年五个时段的平均最大河冰厚度。
3.1.1 最大河冰厚度整体空间差异
从整体上看(图3),1850—1900年、1900—1950年、1950—2000年三个时段的平均最大冰厚的最高值均出现在位于北坡区的站点,分别为(191.43±8.57) cm、(192.11±10.23) cm和(187.45±12.22) cm;最低值均出现在东南内陆区,分别为(47.06±2.97) cm、(45.83±3.27) cm和(45.48±2.82) cm。可以看出,在整个阿拉斯加范围内,多年平均最大冰厚的波动幅度可达近150.00 cm。三个时段的各站点平均最大河冰厚度均与纬度呈现显著正相关关系,与经度呈现显著负相关关系(表1),这说明平均最大河冰厚度自东南向西北呈增厚趋势。相对1850—1900年,44个站点在1900—1950年的平均最大冰厚减薄,减幅从-1.24 cm~-6.04 cm不等。相对于1900—1950年,所有站点在1950—2000年的平均最大冰厚均减薄,减幅最大达-7.20 cm。
图3
图3
各河冰观测站点历史时期和四种不同未来情景下的各时段平均最大河冰厚度
Fig. 3
The average maximum river ice thickness (MRIT): 1850—1900 (a), 1900—1950 (b), 1950—2000 (c), 2015—2050 (SSP126) (d), 2050—2100 (SSP126) (e), 2015—2050 (SSP245) (f), 2050—2100 (SSP245) (g), 2015—2050 (SSP370) (h), 2050—2100 (SSP370) (i), 2015—2050 (SSP585) (j), 2050—2100 (SSP585) (k)
表1 1850—1900年、1900—1950年、1950—2000年、2015—2050年和2050—2100年五个时段的平均最大河冰厚度与纬度和经度的相关性
Table 1
| 因素 | 1850—1900年 | 1900—1950年 | 1950—2000年 | 情景 | 2015—2050年 | 2050—2100年 |
|---|---|---|---|---|---|---|
| 纬度 | 0.56* | 0.59* | 0.58* | SSP126 | 0.63* | 0.65* |
| SSP245 | 0.65* | 0.70* | ||||
| SSP370 | 0.64* | 0.67* | ||||
| SSP585 | 0.64* | 0.64* | ||||
| 经度 | -0.36* | -0.36* | -0.34* | SSP126 | -0.26 | -0.21 |
| SSP245 | -0.22 | -0.09 | ||||
| SSP370 | -0.23 | 0.11 | ||||
| SSP585 | -0.24 | 0.21 |
在未来100年,与1850—2000年平均最大冰厚相同,四个未来情景下的2015—2050年平均最大冰厚的最高值均出自位于北坡区站点,分别为(158.25±12.34) cm(SSP126)、(150.60±12.59) cm(SSP245)、(153.75±13.65) cm(SSP370)和(152.05±14.68) cm(SSP585),相比1850—2000年最高值减薄近40 cm。最低值均出现在位于东南内陆区站点,分别为(40.23±3.02) cm(SSP126)、(38.83±3.34) cm(SSP245)、(39.94±3.40) cm(SSP370)和(39.57±3.49) cm(SSP585),相比1850—2000年最低值减薄约6 cm。同样,2050—2100年平均最大冰厚也出现在北坡区,分别为(144.10±10.30) cm(SSP126)、(127.62±14.34) cm(SSP245)、(97.02±25.81) cm(SSP370)和(82.91±25.14) cm(SSP585)。相比1850—2000年最高值减薄幅度更是高达约50~110 cm,且随着辐射强迫的加强,其降幅增大。最低值除在SSP126情景下出现在东南内陆区[(37.93±3.37) cm]外,其他三个情景下均在库克海湾区,分别为(33.97±7.05) cm(SSP245)、(27.06±8.12) cm(SSP370)和(22.32±7.92) cm(SSP585)。相比1850—2000年最低值减薄约8~26 cm。可见,未来50年,在整个阿拉斯加范围内,多年平均最大冰厚的波动幅度超过110.00 cm,但到了21世纪后半叶,波动幅度下降至约60.00 cm。在未来100年平均最大冰厚最大值降幅远高于最小值的降幅。
两个时段的平均最大河冰厚度在四种情景下均与纬度呈现显著负相关关系(表1),指示了其由南向北逐渐增厚的特点,但与1850—2000年不同的是,其与经度无显著相关关系(表1),这说明平均最大河冰厚度在东西方向上无明显差异,可能指示了在未来气温加剧的情形下,海洋对河冰的影响会降低。相对于2015—2050年,2050—2100年所有站点的平均最大冰厚在四个未来情景下均减薄,其中,SSP126的减幅从-2.35 cm至-18.45 cm,SSP245的减幅从-4.30 cm至-29.38 cm,SSP370的减幅从-9.80 cm至-68.13 cm,SSP585的减幅从-12.26 cm至-82.95 cm。可见,随着社会脆弱性的加剧和辐射强迫的增强,相对于21世纪前半叶,多年平均最大冰厚在21世纪后半叶的减幅在加大。
3.1.2 不同气候区的最大河冰厚度
从不同气候区看,在1850—1900年、1900—1950年和1950—2000年,北坡区的平均最大冰厚最大(表2),其分别达191.00、191.71和186.66 cm;其次为西海岸区。位于阿拉斯加南部的库克海湾区为平均最大冰厚的低值区,其在三个时段未到北坡区的1/2。相对于1850—1900年,各自然区河冰在1950—2000年的厚度均下降,且西海岸区降幅最大,达到-6.84 cm。
表2 各气候区在1850—1900年、1900—1950年和1950—2000年的平均最大冰厚 (cm)
Table 2
| 气候区 | 1850—1900年 | 1900—1950年 | 1950—2000年 |
|---|---|---|---|
| 北坡区 | 191.00 | 191.71 | 186.66 |
| 西海岸区 | 137.39 | 134.08 | 130.55 |
| 东北内陆区 | 111.44 | 109.05 | 108.13 |
| 中部内陆区 | 107.59 | 105.06 | 103.75 |
| 东南内陆区 | 91.81 | 89.35 | 88.65 |
| 布里斯托尔湾区 | 88.34 | 84.20 | 83.24 |
| 库克海湾区 | 83.12 | 79.57 | 78.90 |
在四种不同情景(SSP126、SSP245、SSP370和SSP585)下(表3),北坡区的平均最大河冰厚度均最大,其在SSP126情景下2015—2050年的平均值为158.06 cm,为同情景下同时期库克海湾区(65.21 cm)的2倍多;在2050—2100年,北坡区减薄了近-14.00 cm,降幅最大,其次为西海岸区,而位于南部的库克海湾区仅减薄6.37 cm。在SSP245、SSP370和SSP585三个情景下,也表现出北坡区和西海岸区减薄幅度大于其他气候区的现象。
表3 各气候区在不同情景(SSP126、SSP245、SSP370和SSP585)下在2015—2050年和2050—2100年的平均最大冰厚 (cm)
Table 3
| 气候区 | 2015—2050年 | 2050—2100年 | ||||||
|---|---|---|---|---|---|---|---|---|
| SSP126 | SSP245 | SSP370 | SSP585 | SSP126 | SSP245 | SSP370 | SSP585 | |
| 北坡区 | 158.06 | 150.20 | 153.44 | 151.96 | 144.09 | 127.57 | 95.72 | 80.94 |
| 西海岸区 | 108.27 | 100.52 | 103.75 | 103.68 | 97.43 | 81.23 | 59.96 | 49.45 |
| 东北内陆区 | 96.08 | 92.71 | 95.05 | 94.19 | 90.53 | 83.14 | 72.13 | 65.56 |
| 中部内陆区 | 90.99 | 86.89 | 89.30 | 88.93 | 85.30 | 76.44 | 64.80 | 58.22 |
| 东南内陆区 | 78.35 | 75.42 | 77.62 | 76.92 | 73.60 | 66.82 | 58.25 | 52.63 |
| 布里斯托尔湾区 | 67.66 | 62.81 | 65.31 | 65.33 | 60.80 | 49.98 | 38.56 | 32.28 |
| 库克海湾区 | 65.21 | 61.37 | 63.96 | 63.35 | 58.84 | 49.92 | 39.94 | 33.32 |
3.2 1850—2100年最大河冰厚度时间变化特征
3.2.1 1850—2100年最大河冰厚度整体变化
根据以上建立的48个站点1850—2100年最大河冰厚度,分析了阿拉斯加地区整体最大河冰厚度变化趋势特征(图4)。结果显示,1850—2014年,最大河冰厚度呈显著下降趋势,下降速率为(-0.72±0.25) cm·(10a)-1(P<0.05)。2015—2100年,在SSP126情景下平均变化速率为(-1.39±0.76) cm·(10a)-1,SSP245为(-3.10±0.73) cm·(10a)-1,SSP370为(-6.09±0.79) cm·(10a)-1,SSP585为(-7.45±0.63) cm·(10a)-1(P<0.05)。可见,随着社会脆弱性的加剧和辐射强迫的增强,最大河冰厚度的减薄速率加大,可达历史时期下降速率的近2倍(SSP126)、5倍(SSP245)、9倍(SSP370)和11倍(SSP585)。
图4
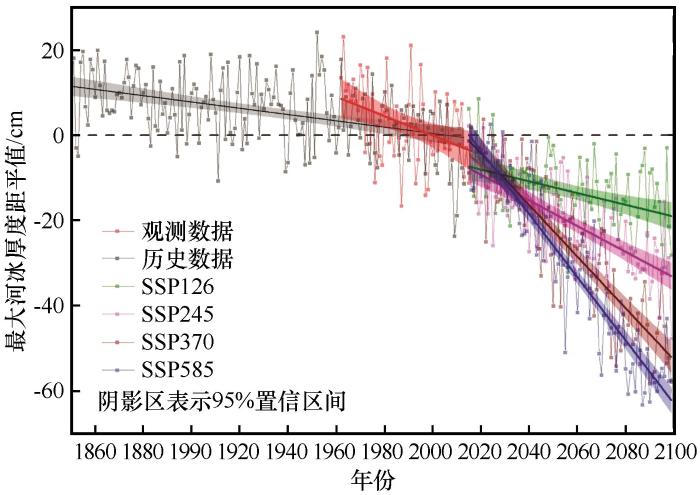
图4
基于CMIP6历史实验和四个不同情景(SSP126、SSP245、SSP370和SSP585)下的阿拉斯加地区1850—2100年整体最大河冰厚度变化趋势
Fig. 4
Trends of mean maximum river ice thicknesses (MRITs) across Alaska from 1850 to 2100 based on annual FIs calculated from daily air temperature outputs of CMIP6 historical experiment and for scenarios (SSP126, SSP245, SSP370 and SSP585)
3.2.2 1850—2100年最大河冰厚度变化速率空间差异
图5
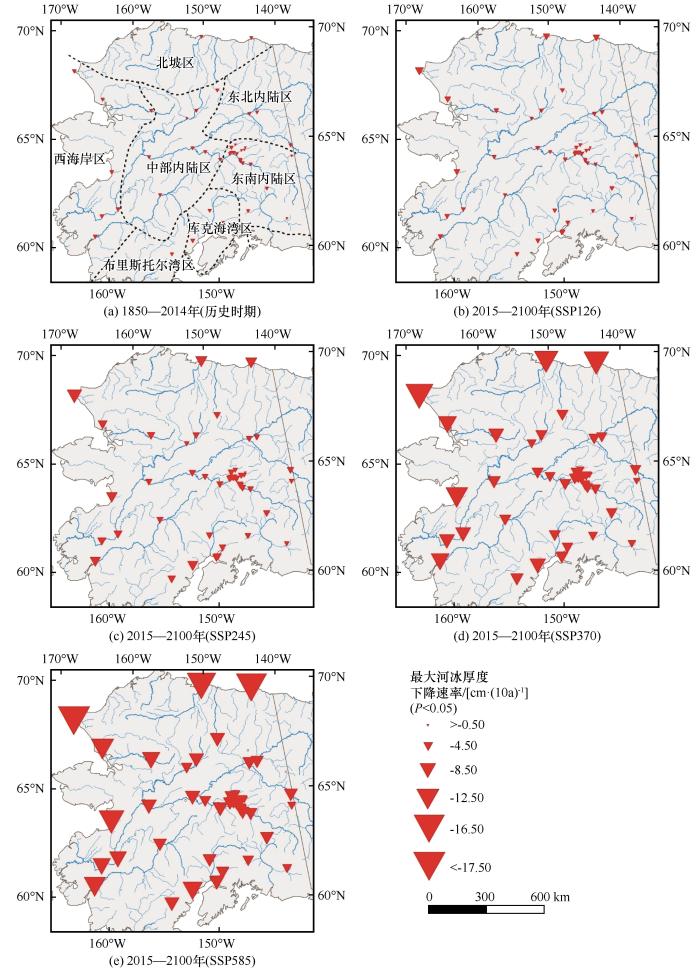
图5
1850—2014年最大河冰厚度变化率(a)以及不同未来情景下的2015—2100年最大河冰厚度变化率
Fig. 5
The changing rates of the maximum river ice thickness (MRIT) during 1850—2014 (a), and under the four future scenarios of SSP126 (b), SSP245 (c), SSP370 (d) and SSP585 (e) during 2015—2100
表4 1850—2014年最大河冰厚度变化率以及不同未来情景下的2015—2100年最大河冰厚度变化率与纬度和经度的相关性
Table 4
| 因素 | 1850—2014年 | 2015—2100年 | |||
|---|---|---|---|---|---|
| SSP126 | SSP245 | SSP370 | SSP585 | ||
| 纬度 | 0.05 | -0.42* | -0.23* | -0.38* | -0.40* |
| 经度 | 0.78* | 0.58* | 0.62* | 0.61* | 0.58* |
从不同气候区上看(表5),1850—2014年,西海岸区的平均下降速率高于其他地区[-1.14 cm·(10a)-1,P<0.05],其次为北坡区[-0.87 cm·(10a)-1,P<0.05],下降最为缓慢的为东南内陆区[-0.52 cm·(10a)-1,P<0.05]。2015—2100年,北坡区和西海岸区在四个不同情景下均有较快的减薄速度,东北内陆区和东南内陆区减薄相对较缓慢。相对于1850—2014年,各个区域的最大河冰厚度在2015—2100年均加速减薄,减薄速率可达历史时期的1~2倍(SSP126)、3~4倍(SSP245)、7~8倍(SSP370),甚至10~12倍(SSP585)。
表5 各气候区在历史实验(1850—2014年)和四个不同情景(2015—2100年)下的最大河冰厚度变化速率[单位:cm·(10a)-1,P<0.05]
Table 5
| 气候区 | 历史实验 | SSP126 | SSP245 | SSP370 | SSP585 |
|---|---|---|---|---|---|
| 西海岸区 | -1.14 | -2.07 | -4.67 | -9.95 | -11.80 |
| 北坡区 | -0.87 | -2.70 | -5.77 | -13.38 | -16.09 |
| 布里斯托尔湾区 | -0.86 | -1.07 | -3.32 | -6.02 | -7.16 |
| 库克海湾区 | -0.69 | -1.11 | -2.94 | -5.38 | -6.60 |
| 中部内陆区 | -0.66 | -1.09 | -2.59 | -5.52 | -6.82 |
| 东北内陆区 | -0.57 | -1.12 | -2.43 | -5.10 | -6.44 |
| 东南内陆区 | -0.52 | -0.88 | -2.19 | -4.29 | -5.43 |
4 讨论
本文利用Stefan方程和CMIP6 CanESM模式数据对最大河冰厚度进行估算,估算精度分析显示存在一定误差。影响估算精度的潜在因素有以下几个方面:
图6
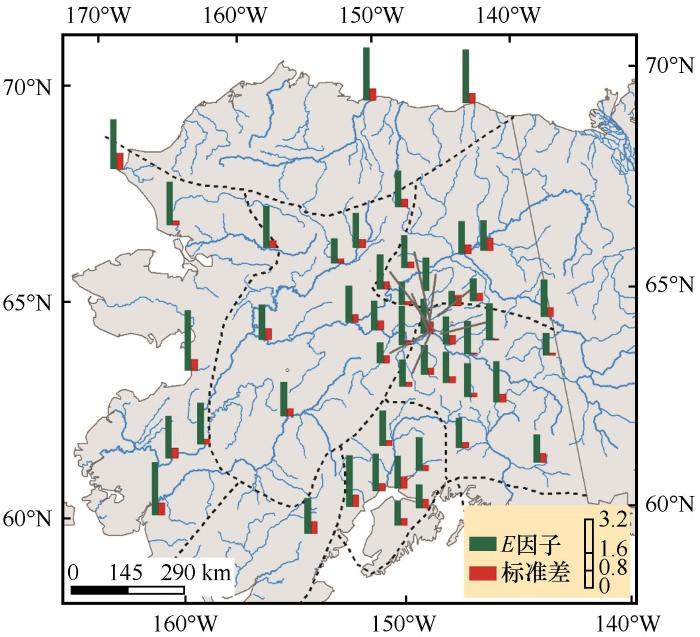
图6
利用年冻结指数(基于CMIP6历史实验的近地表日气温数据)与对应的实测最大河冰厚度计算各河冰观测站点的E因子及其标准差
Fig. 6
The values of E in Equation (5) and their standard deviations (STDs) which were estimated by the annual FIs calculated from daily air temperature outputs of CMIP6 experiment and the maximum river ice thicknesses (MRTIs)
第二个因素是冻结指数。根据最大河冰厚度计算公式,年冻结指数是计算最大冰厚的决定性因素之一。然而,冻结指数是基于CMIP6 CanESM模式数据统计获取,它与站点观测数据存在误差。另外,CMIP6 CanESM模式数据为栅格数据,而实际野外观测的河冰厚度数据是站点尺度,模式获取的冻结指数存在以面代点的情况,这也可能导致其与站点处实际冻结指数不符,从而最终导致河冰估算误差加大。
综上,高精度的河冰厚度估算,需要长时间大范围的野外观测,包括河冰厚度、河冰属性、积雪厚度、积雪属性等,以及气象观测,收集更加全面的观测数据,从而明晰河冰冻融过程及各种因素影响机理,建立完善的河冰估算模型。
5 结论
本研究利用阿拉斯加地区河冰站点实测最大厚度数据、CMIP6 CanESM模式下的历史实验数据及四种未来情景下(SSP126、SSP245、SSP370和SSP585)的近地表日气温数据统计的冻结指数,估算了Stefan方程中用于计算河冰厚度的E因子,并由此建立了1850—2100年最大河冰厚度,从而分析并获取了阿拉斯加地区1850—2100年最大河冰厚的时空变化特征。主要结论如下:
(1)河冰在1850—1900年、1900—1950年、1950—2000年、2015—2050年和2050—2100年的平均最大冰厚在纬度方向上均呈现自南向北增厚的特征,在经度方向上,前三时段的平均最大冰厚由东向西增厚,但2015—2050年和2050—2100年平均最大冰厚在东西方向上无明显差异。北坡区在各时段的平均值均最大,库克湾区平均值最小,不足对应时期北坡区的1/2。
(2)整体上,阿拉斯加地区1850—2100年最大河冰厚度呈显著下降趋势。其中,1850—2014年下降速率为(-0.72±0.25) cm·(10a)-1。2015—2100年,在SSP126情景下为(-1.39±0.76) cm·(10a)-1,SSP245为(-3.10±0.73) cm·(10a)-1,SSP370为(-6.09±0.79) cm·(10a)-1,SSP585为(-7.45±0.63) cm·(10a)-1。
(3)1850—2100年下降速率在空间上呈现出自东向西增大的特点,在南北方向上,除1850—2014年和SSP245情景下的2015—2100年变化速率无明显差异外,其他三个情景下的变化速率自南向北加快。西海岸区和北坡区站点变化速率快于其他气候区。
北极阿拉斯加地区最大河冰厚度有着显著的时空差异,且随着社会脆弱性的加剧和辐射强迫的增强,未来100年最大冰厚减薄愈发明显。鉴于河冰对当地生产生活的重要作用,本研究可为当地居民和政府如何应对河冰变化提供数据支持。另外,关于河冰厚度的时空差异,还需进一步研究。
参考文献
Climate change 2021: the physical science basis: Contribution of Working Group I to the Sixth Assessment Report of the Intergovernmental Panel on Climate Change
[R].
Mechanism of seasonal Arctic sea ice evolution and Arctic amplification
[J].
Processes and impacts of Arctic amplification: a research synthesis
[J].
Ongoing climate change in the Arctic
[J].
Review of changes and impacts of the cryosphere under the background of rapid Arctic warming
[J].
北极快速增暖背景下冰冻圈变化及其影响研究综述
[J].
Variability and trends in the Arctic Sea ice cover: results from different techniques
[J].
Arctic sea ice thickness, volume, and multiyear ice coverage: losses and coupled variability (1958—2018)
[J].
Loss of sea ice in the Arctic
[J].
The central role of diminishing sea ice in recent Arctic temperature amplification
[J].
The Arctic’s rapidly shrinking sea ice cover: a research synthesis
[J].
State of the climate in 2015
[J].
Spatiotemporal changes in active layer thickness under contemporary and projected climate in the Northern Hemisphere
[J].
Rapid initialization of retrogressive thaw slumps in the Canadian high Arctic and their response to climate and terrain factors
[J].
A global synthesis of biodiversity responses to glacier retreat
[J].
Rapid glacier retreat and downwasting throughout the European Alps in the early 21st century
[J].
A review on the advances in surge-type glacier study
[J].
跃动冰川研究进展
[J].
Northern Hemisphere spring snow cover variability and change over 1922—2010 including an assessment of uncertainty
[J].
The changing cryosphere: pan-Arctic snow trends (1979—2009)
[J].
Snow cover trends in Finland over 1961—2014 based on gridded snow depth observations
[J].
Spatiotemporal variability of snow cover timing and duration over the Eurasian continent during 1966—2012
[J].
Long-term ice phenology records from eastern-central Europe
[J].
River ice responses to a warming Arctic: recent evidence from Russian rivers
[J].
The past and future of global river ice
[J].
Identifying historic river ice breakup timing using MODIS and Google Earth Engine in support of operational flood monitoring in Northern Ontario
[J].
Long-term variations of river ice breakup timing across Canada and its response to climate change
[J].
Spatial and temporal patterns in Arctic river ice breakup revealed by automated ice detection from MODIS imagery
[J].
Pan-Arctic detection of river ice breakup and freeze-up timing on rivers wider than 150 m using MODIS imagery from 2000—2019
[C]//
Past and future changes in Arctic lake and river ice
[J].
Dramatic thinning of Alaskan river ice and its climatic controls
[J].
Hydrodynamics of storage release during river ice breakup
[J].
Rapid decline in river icings detected in Arctic Alaska: implications for a changing hydrologic cycle and river ecosystems
[J].
Hydro-ecological effects of changing Arctic river and lake ice covers: a review
[J].
Perspectives in winter limnology: closing the annual cycle of freezing lakes
[J].
The role of winter phenology in shaping the ecology of freshwater fish and their sensitivities to climate change
[J].
Plankton ecology in an ice-covered bay of Lake Michigan: utilization of a winter phytoplankton bloom by reproducing copepods
[J].
Hydrogeomorphic processes of thermokarst lakes with grounded‐ice and floating‐ice regimes on the Arctic coastal plain, Alaska
[J].
Numerical simulation of permafrost thermal regime and talik development under shallow thaw lakes on the Alaskan Arctic Coastal Plain
[J].
Changing Arctic river dynamics cause localized permafrost thaw
[J].
Arctic societies, cultures, and peoples in a changing cryosphere
[J].
Consequences of lake and river ice loss on cultural ecosystem services
[J].
Inuit vulnerability and adaptive capacity to climate change in Ulukhaktok, Northwest Territories, Canada
[J].
Observation-derived ice growth curves show patterns and trends in maximum ice thickness and safe travel duration of Alaskan lakes and rivers
[J].
Ice thickness inversion and ice storage estimation of Yellow River based on satellite radar characteristic parameters
[J].
基于星载雷达特征参数的黄河冰厚反演及冰储量估算
[J].
On the accuracy of thin-ice thickness retrieval using MODIS thermal imagery over Arctic first-year ice
[J].
Thin-ice dynamics and ice production in the Storfjorden polynya for winter-seasons 2002/2003—2013/2014 using MODIS thermal infrared imagery
[J].
Modelling of ice thermodynamics in natural water bodies
[J].
Measuring the sensitivity of southern Wisconsin lake ice to climate variations and lake depth using a numerical model
[J].
Lake ice changes in the Third Pole and the Arctic
[J].
从第三极到北极: 湖冰研究进展
[J].
Changes in winter air temperatures near Lake Michigan, 1851—1993, as determined from regional lake‐ice records
[J].
Freeze-up and break-up of lakes as an index of temperature changes during the transition seasons: a case study for Finland
[J].
Ice‐cover variability on shallow lakes at high latitudes: model simulations and observations
[J].
Potential climate change effects on ice covers of five freshwater lakes
[J].
Long-term changes in lake ice cover in Finland
[J].
Ice cover as an indicator of winter air temperature changes: case study of the Polish Lowland lakes
[J].
Über die Theorie der Eisbildung, insbesondere über die Eisbildung im Polarmee
[J].
Spatial and temporal variability in active layer thickness over the Russian Arctic drainage basin
[J].
Effects of climate on the active layer and permafrost on the north slope of Alaska, U.S.A
[J].
Application of Stefan equation on simulating freezing-thawing process of permafrost
[J].
Stefan方程在土壤冻融过程模拟中的应用
[J].
Climate divisions for alaska based on objective methods
[J].
Short commentary on CMIP6 Scenario Model Intercomparison Project (ScenarioMIP)
[J].
CMIP6情景模式比较计划(ScenarioMIP)概况与评述
[J].
The scenario model intercomparison project (ScenarioMIP) for CMIP6
[J].

 甘公网安备 62010202000676号