


0 引言
大气中的挥发性有机物(VOCs)和颗粒物(PM)造成的空气污染是危害人类健康的主要环境风险之一,已经成为一个全球性问题[1-2]。作为二次污染的共同前体物,VOCs与氮氧化物经光化学反应形成O3,且VOCs氧化过程中产生的一些低挥发性产物或半挥发性有机物可以通过“气固分配”进入颗粒相,形成二次有机气溶胶(SOA)[3-5]。VOCs组分复杂且排放持续增加,中国人为VOCs排放量由1990年的9.76 Tg增加到2017年的28.5 Tg[6],而VOCs排放与二次污染物生成之间的关系是非线性的,这使得VOCs的控制及其监管成为一个环境管理的难题[7]。其次,大气PM可由局部扩散至周边甚至全球,对环境空气质量和人体健康造成严重影响[8]。PM污染特征具有区域差异性,传统的固定区域单一污染因子治理方法已经不能满足当前日渐严重的复合污染防治需求[9]。
我国对VOCs和PM的研究多集中在京津冀、长三角、珠三角和四川盆地等地区和城市[10-13],而对我国西北地区VOCs和PM的研究较少。西北地区包含塔克拉玛干、古尔班通古特、巴丹吉林、腾格里等沙漠地带的戈壁沙漠,是世界沙尘的主要来源之一。甘新地区大多数城市都位于“丝绸之路经济带”的关键位置,由政府主导不断扩大的投资建设和经济发展带来更多的人为影响[14-15]。因此,沙尘暴、干旱以及化石燃料产业的西扩使得甘新城市的空气环境受到自然来源和人为来源的综合影响,有别于其他发达城市群[16]。为治理大气污染,国务院先后印发并实施了《大气污染防治行动计划》(2013—2017年)和《打赢蓝天保卫战三年行动计划》(2018—2020年)。到目前为止,西北地区二氧化氮(NO2)和PM2.5浓度的年均下降幅度分别为0.5 μg·m-3和3.9 μg·m-3,显著低于东部地区的1.7 μg·m-3和5.3 μg·m-3、西南地区1.4 μg·m-3和4.1 μg·m-3[17]。而且,西北地区O3浓度呈现显著的升高趋势,年均升高幅度达6.1 μg·m-3,显著高于东部的2.9 μg·m-3和西南地区的0.9 μg·m-3。这表明西北地区二次污染程度正在恶化[17]。因此,对西北地区VOCs及PM开展研究迫在眉睫,这些研究对于制定有效的大气污染控制措施、改善区域空气质量和保障公众健康具有重要意义。
此外,之前的研究中VOCs的测量主要采用气相色谱-质谱检测仪(GC-MS)或火焰离子化检测仪(GC-FID)[18]。GC技术的缺点一是需要进行预浓缩以达到最低检测限,二是需要注意样品保存变化(罐内壁吸附和氧化剂影响)以及大气水汽和二氧化碳(CO2)对分析的影响等问题,这些都限制了分析样品的数量和准确性[19]。为了克服气相色谱法的局限性,可利用质谱法或光学法对VOCs进行实时测量。例如,本研究使用质子转移反应质谱(PTR-MS)进行测量,仪器具有检测限低(0.3 ppbv)(ppbv为十亿分之一的体积混合比)和时间分辨率高(0.1 s)的特点。PTR技术的优点:一是该技术是一种软电离方法,通常不会导致产物离子的碎片化[20];二是可以定量测量更多VOCs组分,尤其是大量的氧化性VOCs(OVOCs)[21]。因此,本文PTR-MS的应用可以极大地促进对VOCs在西北大气环境中形成二次污染的理解,这对雾霾形成机理研究具有重要意义[22]。
综上所述,我国正全面开展大气复合污染的治理攻坚,而西北地区近年来二次污染程度不断加剧,VOCs和PM作为主要污染物,对其污染特征和健康风险的研究亟待加强。因此,本文开展该地区VOCs和PM的系统研究,厘清污染形成的特征和影响,为我国甘新地区大气污染的精准防控提供科学依据和政策建议。
1 数据与方法
1.1 采样信息
本研究选取中国西北甘新地区的十三个城市作为研究对象(图1和表1),甘肃省内包含天水(TS)、兰州(LZ)、武威(WW)、金昌(JC)、张掖(ZY)、酒泉(JQ)、玉门(YM)和敦煌(DH),新疆维吾尔自治区内包含哈密(HM)、乌鲁木齐(UC)、克拉玛依(KM)、吉木乃(JN)和富蕴(FY)。城市类型包含多人口城市(兰州和乌鲁木齐)、工业城市(金昌)、石油城市(玉门和克拉玛依)、偏远城市(吉木乃和富蕴)以及其他城市(天水、武威、张掖、酒泉、敦煌和哈密)。采样时间为2018年3—4月(3月25日—4月21日)、6—7月(6月9日—7月6日)和12月(12月2日—12月29日)。采样内容为:(1)VOCs数据(102天在线),其采样城市包含兰州、金昌、玉门、哈密、乌鲁木齐、克拉玛依、吉木乃和富蕴;(2)PM数据(642个离线样品),其中PM10样品174个,采样城市包含武威、张掖、酒泉、敦煌、金昌、玉门、哈密、乌鲁木齐、克拉玛依、吉木乃和富蕴;PM2.5样品342个,采样城市包含天水、兰州、武威、张掖、酒泉、敦煌、金昌、玉门、哈密、乌鲁木齐、克拉玛依、吉木乃和富蕴;PM1样品126个,采样城市包含金昌、玉门、哈密、乌鲁木齐、克拉玛依、吉木乃和富蕴。
图1
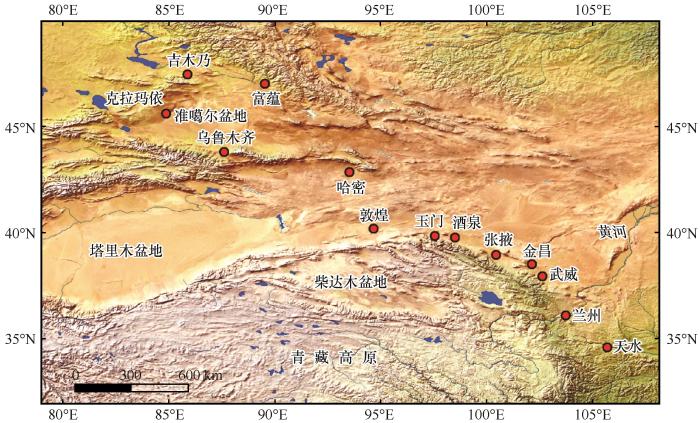
表1 甘新城市站点采样信息(2018年)
Table 1
| 城市 | 经纬度 | 站点位置 | 类型 | 人口/百万人 | GDP/百亿元 | 车辆/百万辆 | 温度/℃ | 相对湿度/% | 边界层高度/m | 采样项目 |
|---|---|---|---|---|---|---|---|---|---|---|
| 天水(TS) | 34.57° N,105.70° E | 天水师范学院 | 文教 | 0.70 | 4.04 | 0.31 | 11.3 | 54 | 679.0 | PM2.5(n=84) |
| 兰州(LZ) | 36.09° N,103.69° E | 兰州城市学院 | 文教 | 2.46 | 24.22 | 0.88 | 11.0 | 32 | 662.9 | VOCs(n=18), PM2.5(n=84) |
| 武威(WW) | 37.93° N,102.62° E | 亚欧酒店 | 居民 | 0.34 | 2.93 | 0.21 | 10.1 | 46 | 738.9 | PM10(n=12), PM2.5(n=12) |
| 金昌(JC) | 38.50° N,102.17° E | 龙首山庄 | 居民 | 0.17 | 1.91 | 0.08 | 9.4 | 19 | 674.0 | PM10(n=12), PM2.5(n=12) |
| 张掖(ZY) | 38.95° N,100.47° E | 张掖气象局 | 混合 | 0.27 | 1.81 | 0.19 | 8.1 | 43 | 671.2 | PM10(n=12), PM2.5(n=12) |
| 酒泉(JQ) | 39.73° N,98.50° E | 商汇酒店 | 居民 | 0.39 | 1.77 | 0.19 | 8.4 | 50 | 967.4 | PM10(n=12), PM2.5(n=12) |
| 玉门(YM) | 40.29° N,97.03° E | 中国科学院祁连山冰川站 | 混合 | 0.08 | 1.51 | — | 7.3 | 30 | 704.2 | VOCs(n=12), PM10(n=18), PM2.5(n=18), PM1(n=18) |
| 敦煌(DH) | 40.13° N,94.71° E | 敦煌气象局 | 混合 | 0.12 | 0.99 | — | 9.9 | 42 | 964.9 | VOCs(n=12), PM10(n=18), PM2.5(n=18), PM1(n=18) |
| 哈密(HM) | 42.83° N,93.47° E | 哈密气象局 | 混合 | 0.25 | 4.00 | 0.17 | 10.4 | 19 | 711.0 | VOCs(n=12), PM10(n=18), PM2.5(n=18), PM1(n=18) |
| 乌鲁木齐(UC) | 43.86° N,87.56° E | 中国科学院新疆分院 | 居民 | 2.87 | 31.00 | 0.95 | 7.4 | 33 | 350.4 | VOCs(n=12), PM10(n=18), PM2.5(n=18), PM1(n=18) |
| 克拉玛依(KM) | 45.57° N,84.88° E | 克拉玛依气象局 | 混合 | 0.45 | 8.98 | 0.11 | 8.4 | 36 | 432.8 | VOCs(n=12), PM10(n=18), PM2.5(n=18), PM1(n=18) |
| 吉木乃(JN) | 47.44° N, 85.86° E | 中国科学院阿尔泰山冰川站 | 背景 | 0.02 | 0.15 | — | 5.3 | 59 | 521.7 | VOCs(n=12), PM10(n=18), PM2.5(n=18), PM1(n=18) |
| 富蕴(FY) | 46.99° N,89.51° E | 富蕴气象局 | 混合 | 0.05 | 0.52 | — | 3.9 | 32 | 562.4 | VOCs(n=12), PM10(n=18), PM2.5(n=18), PM1(n=18) |
1.2 数据采集与质控
1.2.1 VOCs的采集与质控
本研究使用质子转移反应质谱仪(PTR-MS,Ionicon)在线监测空气中的VOCs。仪器主要由离子源、PTR漂移管和浓度检测系统三个部分构成:(1)在离子源中,纯净水在空心阴极放电中被分解,通过电子碰撞产生高纯度H3O+;(2)在PTR漂移管反应室内发生质子转移反应(H3O++VOC→VOCH++H2O),漂移管提供稳定的电场,空气中VOCs进入漂移管后,通过质子转移反应被电离成VOCH+;(3)浓度检测系统包括四极杆质谱分析器(QMS)和二次电子倍增器(SEM),主要完成试剂离子H3O+和产物离子VOCH+的质量分析和浓度检测[23]。仪器测量范围为质量电荷比(m/z)在1~300 mua内的VOCs,测量速度快(ms),灵敏度高(pptv,pptv指万亿分之一的体积混合比)。空气中的VOCs通过1/16"PEEK材质管线(0.1 mm ID)连续收集,PEEK材质的选择可减少由于壁效应造成VOCs的损失。管线全程用自控加热电阻丝(40 ℃)包裹,以防止管内VOCs冷凝。在管口安装内嵌式颗粒过滤器,以防止沙尘和碎片进入仪器内部。
PTR-MS在H3O+电离模式下运行,漂移管压力为2.3 mbar、电压为600 V、温度为80 ℃,场强/气密比(E/N)为135 Td。仪器以全扫描模式连续观测VOCs,即离子质荷比从20 m/z扫描至200 m/z,质谱图扫描周期为每28.5 s记录一次。为保证采样数据质量,需进行仪器的背景实验、标气校准和调校[24]。在整个测量期间,仪器中的主离子计数(主要试剂H3O+离子引起的信号)始终在1.5×10⁵ ncps以上。在背景测量时,通过切换阀门,使空气通过一个加热到250 ℃的装有铂棉的催化转化器(GCU-0703,Ionicon),以去除大气中的VOCs,产生零气用以校正组分的背景浓度。在校准测量时,通过动态稀释VOCs气体标准品进行校准,标气主要包括甲醇、乙腈、混标(丙烯、乙醛、丙酮、异戊二烯、苯、甲苯、对二甲苯和单萜烯)(Japan Fine Products)和TO-14A(Restek)。各组分浓度约为1 ppmv(ppmv指百万分之一的体积混合比),标定时将零气与标气混合,稀释到不同的浓度范围(1~10 ppbv)进行校准。本研究分析的VOCs组分信息如表2所示,其中,灵敏度通常被定义为当仪器反应离子H3O+的计数速率为106 cps时,测量十亿分之一体积混合比的有机物R时,仪器所能探测到RH+ 离子的计数速率。
表2 PTR-MS仪器扫描的离子质荷比及组分信息
Table 2
| 类别 | 质荷比(m/z) | 分子式 | 中文名 | 英文名 | 灵敏度(ncps/ppbv) | LOD/ppbv | 不确定度/% |
|---|---|---|---|---|---|---|---|
| OVOCs | 33 | CH4O | 甲醇 | Methanol | 25.1 | 0.46 | 28.6 |
| OVOCs | 45 | C2H4O | 乙醛 | Acetaldehyde | 33.6 | 0.15 | 18.3 |
| OVOCs | 47 | C2H6O | 甲酸 | Formic acid | |||
| OVOCs | 59 | C3H6O | 丙酮 | Acetone | 32.8 | 0.10 | 18.8 |
| OVOCs | 61 | C2H4O2 | 乙酸 | Acetic acid | |||
| OVOCs | 73 | C4H8O | 甲基乙基酮 | MEK | — | — | — |
| 烃类 | 43 | C3H6 | 丙烯 | Propene | 21.1 | 0.12 | 20.1 |
| 示踪物 | 42 | CH3CN | 乙腈 | Acetonitrile | 37.3 | 0.10 | 22.6 |
| 生物源 | 69 | C5H8 | 异戊二烯 | Isoprene | 30.3 | 0.09 | 20.1 |
| 生物源 | 71 | C4H6O | 甲基乙烯基酮+ 甲基丙烯醛 | MVK+MACR | — | — | — |
| 生物源 | 137 | C10H16 | 单萜 | Monoterpene | 19.7 | 0.09 | 21.5 |
| 芳香烃 | 79 | C6H6 | 苯 | Benzene | 25.4 | 0.07 | 16.8 |
| 芳香烃 | 93 | C7H8 | 甲苯 | Toluene | 27.8 | 0.10 | 18.9 |
| 芳香烃 | 105 | C8H8 | 苯乙烯 | Styrene | 21.0 | 0.10 | 19.8 |
| 芳香烃 | 107 | C8H10 | C8芳烃 | C8 Aromatics | 18.6 | 0.08 | 17.6 |
| 芳香烃 | 121 | C9H12 | C9芳烃 | C9 Aromatics | 17.4 | 0.08 | 18.4 |
| 芳香烃 | 129 | C10H8 | 萘 | Naphthalene | — | — | — |
| 芳香烃 | 135 | C10H14 | C10芳烃 | C10Aromatics | 28.9 | 0.12 | 19.4 |
1.2.2 颗粒物的采集与质控
利用中流量颗粒物采样器(TH-150F,武汉天虹)采集PM10、PM2.5和PM1样品,采样滤膜选择石英膜(Ø90 mm,Whatman)。采样前后处理按照中国生态环境部HJ 618—2011文件相关规定执行。记录每日样品信息:每个样品连续采集23 h(08:00 am—次日07:00 am,北京时间,下同)。颗粒物的实验室分析内容包括水溶性无机离子分析、碳质组分分析和无机元素分析。离子色谱仪(IC,Thermo fisher)用于分析水溶性阴、阳离子[25],主要包括SO42-、NO3-、Cl-、F-、NO2-、Ca2+、Mg2+、Na+、K+和NH4+。每十个样品测一个平行样,测量偏差在5%以内,样品测定的加标回收率范围在87.5%~112.7%之间。离子的标准曲线R2均大于0.99,检测限的范围为0.01~0.03 μg·m-3[26]。热/光碳分析仪(Sunset Model 4L,Tigard)用于分析碳组分,包括OC、EC和TC。实验前用蔗糖标准溶液标定仪器,确定校准常数,定期用NIST可追踪气体流量计(Restek-ProF LOW 6000)进行流量传感器检查和校准。每次样品分析前进行1~2次空白膜检测,保证仪器内的残留气体充分燃烧完。每十个样品测一个平行样,测量偏差在5%以内。OC和EC的检测限均为0.2 mg·cm-2[27]。电感耦合等离子体发射光谱仪(ICP-MS,7700X,Agilent)用于分析元素,主要包括Al、Ca、Fe、Mg、Zn、Ba、Cd、Cr、Cu、Mn、Pb、As、Ni和Se。每批次消解样品中包括1个空白样(同样体积和批次的盐酸、硝酸、氢氟酸),以去除酸本身的影响。每十个样品测一个平行样,测量偏差在5%以内。样品测定的加标回收率的范围在80.1%~119.6%之间。各元素的标准曲线R2均大于0.99,检测限范围为9.61~3 779 pptv。
1.2.3 其他数据
温度(T)、相对湿度(RH)和边界层高度(ABLH)等气象数据来自中国气象数据网(
1.3 研究方法
1.3.1 富集因子法
富集因子法(EF)计算公式如下[28]:
式中:
1.3.2 健康风险评估模型
(1) 暴露评价
VOCs和PM中重金属的暴露评价的计算方法如下:
式中:ECi 为第i种VOCs组分的日均暴露浓度;ADDi 为第i种重金属的暴露量;Ci 为第i种VOCs组分或重金属元素的浓度;IR为呼吸量;ET为暴露时间;EF为暴露频率;ED为暴露持续时间;BW为体重;AT为平均暴露时间。取值见表3。
表3 大气污染物的日均暴露参数
Table 3
| 参数 | 甘肃 | 新疆 |
|---|---|---|
| IR/(m3·d-1) | 16.5 | 16.6 |
| BW/kg | 63.4 | 64.7 |
| ET/(h·d-1) | 24 | 24 |
| EF/(d·a-1) | 350 | 350 |
| ED/a | 30 | 30 |
| AT(非致癌)/h | 365×24×ED | 365×24×ED |
| AT(致癌)/h | 365×24×72.33 | 365×24×72.58 |
(2) 健康风险评估
VOCs的非致癌风险(HI)和致癌风险(LCR)评估表示为:
PM中重金属的非致癌风险(HI)和致癌风险(LCR)评估表示为:
式中:HQi 为第i种VOCs组分或重金属的非致癌风险危害熵值;RfCi 为第i种VOCs或重金属经呼吸途径的参考浓度剂量;
表4 大气污染物的风险系数
Table 4
| VOCs | RfCi /(mg·m-3) | IURi /(m3·μg-1) | 重金属 | RfCi /(mg·kg-1·d-1) | SFi /(kg·d·mg-1) |
|---|---|---|---|---|---|
| 乙腈 | 6.00×10⁻² | — | Mn | 1.43×10⁻⁵ | — |
| MEK | 5.00 | — | Zn | 3.01×10⁻¹ | — |
| 甲苯 | 5.00 | — | Cu | 4.02×10⁻² | — |
| 苯乙烯 | 1.00 | — | Pb | 3.52×10⁻³ | — |
| 二甲苯 | 1.00×10⁻¹ | — | Cd | 1.00×10⁻³ | 6.3 |
| 三甲基苯 | 6.00×10⁻² | — | As | 3.01×10⁻⁴ | 15.1 |
| 乙醛 | 9.00×10⁻³ | 2.20×10⁻⁶ | Cr | 2.86×10⁻⁵ | 42.0 |
| 苯 | 3.00×10⁻² | 7.80×10⁻⁶ | Ni | 2.06×10⁻² | 8.40×10⁻¹ |
| 萘 | 3.00 | 3.40×10⁻⁵ |
2 结果与讨论
2.1 VOCs浓度和组分特征
表5为甘新城市VOCs的浓度水平。平均总VOCs(TVOCs)浓度为(41.84±7.56) ppbv(平均值±标准偏差),对各VOCs组分浓度进行差异显著性分析,不同组分浓度有显著性差异(P<0.01)。各VOCs组分的浓度由高到低依次排序为甲醇[(22.75±4.93) ppbv]>乙醛[(5.23±2.79) ppbv]>甲酸+乙醇[(2.75±0.87) ppbv]>丙酮[(2.57±1.24) ppbv]>乙酸[(2.10±2.01) ppbv]>丙烯[(1.98±1.02) ppbv]>C9芳烃[(1.70±1.04) ppbv]>MEK[(0.48±0.33) ppbv]>乙腈[(0.31±0.21) ppbv]>异戊二烯[(0.30±0.15) ppbv]。对各城市浓度进行差异显著性分析,不同城市之间的TVOCs和OVOCs有显著性差异(P<0.01)。TVOCs浓度由高到低依次排序为金昌[(62.25±11.42) ppbv]>乌鲁木齐[(54.10±6.79) ppbv]>兰州[(53.76±7.36) ppbv]>玉门[(39.33±6.02) ppbv]>富蕴[(38.15±6.21) ppbv]>克拉玛依[(31.68±3.38) ppbv]>吉木乃[(30.07±3.17) ppbv]>哈密[(25.35±3.57) ppbv]。从OVOCs浓度来看,金昌[(50.84±8.39) ppbv]、乌鲁木齐[(49.33±5.51) ppbv]和兰州[(46.58±6.92) ppbv]较高,而克拉玛依[(26.95±3.91) ppbv]、吉木乃[(25.85±4.10) ppbv]和哈密[(21.30±3.62) ppbv]较低。甲醇浓度占TVOCs浓度的36.1%~72.3%,在人口多的省会城市(乌鲁木齐和兰州)占比更高,分别为72.3%和60.9%。乙醛浓度占TVOCs浓度的8.1%~17.8%,在工业城市(金昌)占比更高,为17.8%。丙酮浓度占TVOCs浓度的2.7%~16.5%,乙酸浓度占TVOCs浓度的2.2%~9.4%,丙酮在石油城市(玉门和克拉玛依)的占比更高,为16.5%和8.0%,乙酸在玉门和克拉玛依的占比也更高,分别为9.4%和6.3%。总之,金昌、乌鲁木齐和兰州的VOCs浓度较高,OVOCs是甘新城市VOCs的重要组成部分。
表5 甘新城市VOCs的浓度水平 (ppbv)
Table 5
| VOCs | 兰州 | 金昌 | 玉门 | 哈密 | 乌鲁木齐 | 克拉玛依 | 吉木乃 | 富蕴 | 平均 |
|---|---|---|---|---|---|---|---|---|---|
| TVOCs | 53.76±7.36 | 62.25±11.42 | 39.33±6.02 | 25.35±3.57 | 54.10±6.79 | 31.68±3.38 | 30.07±3.17 | 38.15±6.21 | 41.84±7.56 |
| OVOCs | 46.58±6.92 | 50.84±8.39 | 33.62±5.25 | 21.30±3.62 | 49.33±5.51 | 26.95±3.91 | 25.85±4.10 | 32.61±5.81 | 35.88±6.65 |
| 甲醇 | 32.72±4.94 | 28.13±6.45 | 14.20±4.66 | 13.66±3.36 | 39.10±4.83 | 14.93±3.69 | 16.37±3.93 | 22.87±5.30 | 22.75±4.93 |
| 乙醛 | 5.05±2.40 | 11.08±2.78 | 6.49±1.99 | 3.32±1.35 | 4.48±1.97 | 4.32±1.05 | 4.01±1.05 | 3.09±1.17 | 5.23±2.79 |
| 甲酸+乙醇 | 2.32±0.69 | 4.77±1.17 | 2.46±0.71 | 2.07±0.55 | 2.37±0.77 | 2.87±0.91 | 2.24±0.81 | 2.93±0.77 | 2.75±0.87 |
| 丙酮 | 2.51±1.46 | 3.05±1.83 | 6.47±1.63 | 1.08±0.61 | 1.48±0.73 | 2.53±1.99 | 1.36±0.78 | 2.09±0.86 | 2.57±1.24 |
| 乙酸 | 3.42±1.71 | 2.41±2.54 | 3.68±2.06 | 0.95±0.54 | 1.21±0.58 | 1.99±0.76 | 1.70±1.28 | 1.44±0.58 | 2.10±2.01 |
| MEK | 0.56±0.26 | 1.40±0.92 | 0.32±0.14 | 0.22±0.16 | 0.69±0.46 | 0.31±0.17 | 0.17±0.07 | 0.19±0.06 | 0.48±0.33 |
| 丙烯 | 2.70±1.06 | 2.93±1.35 | 1.90±0.88 | 1.18±0.63 | 1.75±0.97 | 2.01±0.71 | 1.63±0.95 | 1.73±0.59 | 1.98±1.02 |
| 乙腈 | 0.69±0.46 | 0.48±0.73 | 0.19±0.06 | 0.17±0.05 | 0.30±0.17 | 0.19±0.06 | 0.26±0.08 | 0.19±0.07 | 0.31±0.21 |
| BVOCs | 0.96±0.29 | 1.18±0.42 | 0.49±0.16 | 0.42±0.15 | 0.45±0.12 | 0.51±0.11 | 0.42±0.10 | 0.45±0.10 | 0.61±0.17 |
| 异戊二烯 | 0.45±0.23 | 0.54±0.37 | 0.24±0.11 | 0.22±0.11 | 0.22±0.10 | 0.28±0.09 | 0.22±0.09 | 0.23±0.09 | 0.30±0.15 |
| MVK+MACR | 0.36±0.21 | 0.48±0.41 | 0.16±0.07 | 0.12±0.06 | 0.14±0.07 | 0.14±0.05 | 0.12±0.05 | 0.13±0.05 | 0.21±0.12 |
| 单萜 | 0.15±0.09 | 0.16±0.12 | 0.09±0.05 | 0.08±0.04 | 0.09±0.05 | 0.09±0.05 | 0.08±0.04 | 0.09±0.04 | 0.10±0.06 |
| 芳香烃类 | 2.83±0.65 | 6.83±1.56 | 3.12±0.92 | 2.29±0.87 | 2.28±0.56 | 2.02±0.44 | 2.01±0.36 | 3.17±0.81 | 3.07±1.25 |
| 苯 | 0.54±0.36 | 0.48±0.86 | 0.11±0.05 | 0.11±0.06 | 0.22±0.12 | 0.11±0.05 | 0.12±0.06 | 0.14±0.11 | 0.23±0.21 |
| 甲苯 | 0.72±0.52 | 0.53±0.57 | 0.13±0.06 | 0.12±0.05 | 0.22±0.14 | 0.18±0.07 | 0.16±0.07 | 0.24±0.22 | 0.29±0.21 |
| 苯乙烯 | 0.33±0.16 | 0.48±0.80 | 0.25±0.10 | 0.20±0.11 | 0.19±0.09 | 0.18±0.08 | 0.16±0.10 | 0.24±0.11 | 0.25±0.21 |
| C8芳烃 | 0.61±0.43 | 0.66±0.56 | 0.15±0.08 | 0.13±0.07 | 0.28±0.19 | 0.15±0.09 | 0.13±0.07 | 0.20±0.17 | 0.29±0.21 |
| C9芳烃 | 0.28±0.21 | 4.13±1.31 | 2.21±0.81 | 1.48±0.75 | 1.11±0.44 | 1.15±0.34 | 1.20±0.23 | 2.03±0.73 | 1.70±1.04 |
| 萘 | 0.20±0.15 | 0.22±0.15 | 0.10±0.05 | 0.08±0.04 | 0.10±0.06 | 0.09±0.05 | 0.08±0.04 | 0.09±0.04 | 0.12±0.07 |
| C10芳烃 | 0.15±0.08 | 0.33±0.26 | 0.17±0.08 | 0.17±0.12 | 0.16±0.09 | 0.16±0.08 | 0.16±0.13 | 0.23±0.16 | 0.19±0.13 |
甘新城市主要VOCs浓度与16个全球城市对比如图2所示,图中的VOCs均为PTR-MS测量的各城春季浓度。不同城市站点观测的VOCs浓度会受到很多因素的影响,比如采样时段、站点位置、气象条件和化学反应等。然而,通过对比有助于整体把握这些城市的VOCs水平。甘新城市主要VOCs的总浓度高于其他15个城市的平均浓度(20.94 ppbv),其浓度与北京(30.83 ppbv)[13]相当,但低于莫哈里(59.8 ppbv)[32]、墨西哥(45.8 ppbv)[33]和艾哈迈达巴德(34.55 ppbv)[34]。甘新城市OVOCs浓度高于其他15个城市的平均浓度,主要为甲醇的浓度较高。示踪物(生物质燃烧和生物源)浓度低于其他城市,而芳香烃浓度远低于其他城市。OVOCs既是一次污染物,又可以由NMHCs二次反应后生成,最初排放到大气中的NMHCs参加一系列大气化学反应,如与OH、HO2、NO3等自由基反应之后导致OVOCs的增加,逐渐提升OVOCs在总VOCs的比重[35]。甘新城市OVOCs浓度较高的可能原因如下:(1)采样城市包含西北典型城市金昌(工业城市)、玉门和克拉玛依(石油城市),工业生产和石油开采活动可能会贡献大气中OVOCs的一次排放[36];(2)由于大多西北城市位于高海拔地区,太阳辐射和循环更加强烈,因此具有更强的氧化环境,能加快OVOCs的二次生成[37]。而甘新城市的低芳香烃浓度的可能原因如下:(1)城市居民区的芳香烃主要来自于汽车排放[38],与墨西哥和长三角等城市相比,中国西北部城市的车辆密度普遍较低(表1),导致由汽车排放生成的芳香烃量较少。(2)芳香烃与大气OH自由基的反应速率常数(kOH)相比OVOCs组分更大,故芳香烃的大气寿命短,致使芳香烃浓度总体较低[39]。例如芳香烃中的苯、甲苯和C8芳烃的kOH分别为1.22×10-12、5.96×10-12和23.60×10-12 cm3·molecule-1·s-1,对应的大气寿命分别为6.27、1.29和0.33天;而OVOCs中的丙酮和甲醇的kOH分别为0.18×10⁻¹²和0.90×10⁻¹² cm3·molecule-1·s-1,对应的大气寿命分别为42.90和8.57天[39]。(3)甘新地区春季的风速相对较高,可能会对芳香烃会有一定的扩散作用[24]。根据文献[40],春季风速相对较低的城市(风速范围为0.47~2.80 m·s-1)有墨西哥、艾哈迈达巴德、浦那、莫哈里、加德满都、广州和深圳,这些城市芳香烃的浓度普遍较高。风速相对较高的城市(风速范围为2.80~4.49 m·s-1和4.49~6.91 m·s-1)有曼彻斯特、赫尔辛基、巴黎、新罕布什尔、长岛、北京和甘新城市,这些城市芳香烃的浓度普遍较低。
图2
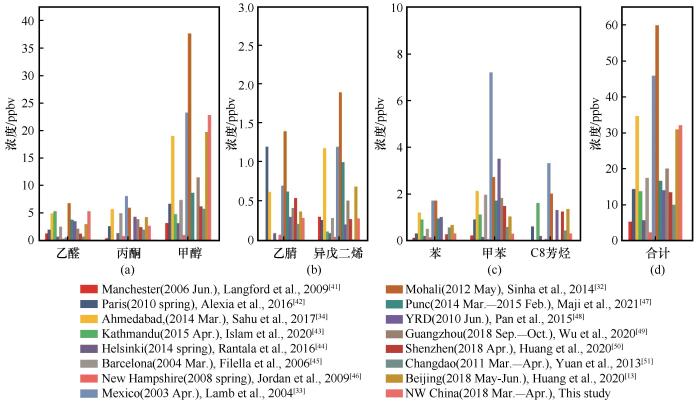
图2
甘新城市VOCs浓度与国内外其他城市对比(均为PTR-MS测量结果)
Fig. 2
Comparison of VOCs’ concentration between Gansu-Xinjiang cities and other cities at home and abroad (PTR-MS measurement results)
2.2 颗粒物浓度和组分特征
如表6所示,甘新城市PM10、PM2.5和PM1的平均浓度分别为(139.39±32.63) μg·m-3、(77.66±25.39) μg·m-3和(44.76±17.59) μg·m-3。PM10和PM2.5浓度均明显超过世界卫生组织的空气质量标准(PM10:50 μg·m-3,PM2.5:25 μg·m-3),且PM2.5浓度超过中国环境空气质量标准(GB 3095—2012)的二级标准(PM10:150 μg·m-3,PM2.5:75 μg·m-3)。金昌、玉门、乌鲁木齐和酒泉的PM10和PM2.5浓度均超过国家二级标准。
表6 甘新城市大气污染物浓度水平
Table 6
| 污染物 | 天水 | 兰州 | 武威 | 张掖 | 酒泉 | 敦煌 | 金昌 | 玉门 | 哈密 | 乌鲁 木齐 | 克拉 玛依 | 吉木乃 | 富蕴 | 平均 |
|---|---|---|---|---|---|---|---|---|---|---|---|---|---|---|
| PM10/ (μg·m-3) | — | — | 112.48± 31.89 | 112.14± 36.90 | 151.66± 24.96 | 118.06± 13.46 | 287.31± 48.95 | 186.92± 52.61 | 189.94± 34.62 | 159.31± 39.69 | 80.20± 24.02 | 51.48± 18.37 | 83.79± 33.47 | 139.39± 32.63 |
| PM2.5/ (μg·m-3) | 80.21± 20.92 | 131.04± 32.87 | 69.78± 38.61 | 78.27± 49.06 | 80.88± 24.25 | 74.91± 15.33 | 115.23± 20.88 | 105.87± 44.77 | 64.47± 34.34 | 75.60± 9.06 | 52.32± 13.51 | 43.59± 20.92 | 37.42± 15.49 | 77.66± 25.39 |
| PM1/ (μg·m-3) | — | — | — | — | — | — | 89.32± 26.41 | 59.77± 15.33 | 25.01± 9.91 | 44.62± 16.28 | 45.71± 18.13 | 35.26± 24.57 | 13.66± 12.50 | 44.76± 17.59 |
| PM2.5/PM10 | — | — | 0.62 | 0.70 | 0.53 | 0.64 | 0.40 | 0.57 | 0.34 | 0.48 | 0.65 | 0.85 | 0.45 | 0.57 |
| PM1/PM2.5 | — | — | — | — | — | — | 0.78 | 0.56 | 0.39 | 0.59 | 0.87 | 0.81 | 0.37 | 0.63 |
| SO2/ (μg·m-3) | 9.64± 2.66 | 18.86± 6.26 | 2.58± 0.64 | 8.63± 2.68 | 10.34± 3.63 | — | 5.68± 3.63 | — | 9.53± 7.05 | 12.20± 4.28 | 5.47± 3.17 | — | — | 10.23± 6.0 |
| NO2/ (μg·m-3) | 32.06± 10.78 | 58.75± 21.87 | 23.06± 7.10 | 15.23± 5.30 | 18.81± 4.01 | — | 14.82± 9.92 | — | 14.70± 8.29 | 27.35± 13.78 | 10.83± 6.51 | — | — | 26.42± 14.17 |
| CO/ (mg·m-3) | 0.52± 0.20 | 1.07± 0.42 | 0.49± 0.10 | 0.29± 0.07 | 0.51± 0.08 | — | 0.44± 0.27 | — | 1.10± 0.13 | 0.81± 0.30 | 0.77± 0.19 | — | — | 0.79± 0.22 |
| O3/ (μg·m-3) | 76.17± 27.68 | 62.57± 30.33 | 98.98± 14.82 | 98.22± 14.89 | 106.52± 9.25 | — | 86.22± 21.54 | — | 99.29± 18.90 | 78.10± 24.39 | 84.18± 25.14 | — | — | 81.09± 25.66 |
甘新城市PM10、PM2.5和PM1中的WSIIs平均浓度分别(35.43±7.56) μg·m-3、(24.88±4.23) μg·m-3和(14.19±2.01) μg·m-3,分别占总PM浓度的25.4%、32.0%和31.7%。如图3所示,甘新城市的SO42-和Ca2+为主要的离子,约占总离子浓度的50%。SO42-是人为生产生活排放的标识,通常工业生产和燃烧排放时SO42-浓度较高[52],Ca2+是土壤尘埃的指标,通常沙尘暴发生时Ca2+浓度会升高[53],表明该地区人为活动和沙尘事件活跃。一般来说,NO3-和SO42-较多由前体气态污染物经过二次转化反应生成,NO3-的前体物NO x 受机动车排放影响,SO42-的前体物SO2受燃烧排放影响,故二者比值可以初步判定污染来源(移动源或固定源)[54]。如图3所示,甘新城市NO3-/SO42-比值范围为0.4~0.6(PM10:0.47,PM2.5:0.55和PM1:0.42),平均值低于中国其他城市,表明固定污染源(例如燃煤和工业废气排放)仍然是主要污染源[55]。兰州和乌鲁木齐的WSIIs污染更为严重,且兰州的WSIIs的组成与乌鲁木齐较为相似,但兰州的Ca2+高于乌鲁木齐,表明兰州受粉尘污染的影响更大,乌鲁木齐有最高的NO3-/SO42-比值(0.9~1.0),这表明由于近年来乌鲁木齐汽车保有量的增加(2019年达95×104辆汽车),汽车尾气排放在该地区离子来源中发挥了重要作用。阴离子当量(AE)/阳离子当量(CE)的比值(RA/C)可用于评估颗粒物的酸度[56],公式包含
图3
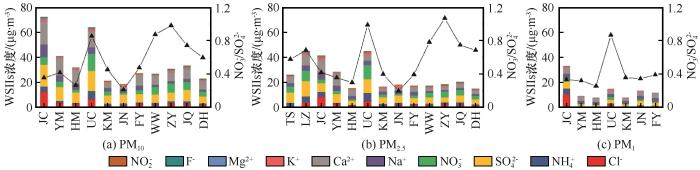
图3
甘新城市颗粒物中水溶性无机离子的质量浓度和组成
Fig. 3
Mass concentration and composition of water-soluble inorganic ions (WSIIs) in particulate matter in Gansu-Xinjiang cities
甘新城市PM10、PM2.5和PM1的平均RA/C分别为1.05、1.09和0.72,表明除PM1外,颗粒物基本被中和。PM1的RA/C较低的主要原因可能是:(1)颗粒物中有机酸(如草酸等)测量的缺失[57]。有机酸能与阳离子结合,但不能被色谱柱分离检测,造成测到的阳离子增加[58]。而有机酸对PM1的贡献通常大于PM2.5和PM10[59-60],造成甘新城市的细颗粒物呈现弱碱性。(2)地壳源阳离子输送较多[61]。Ca2+和Mg2+主要来自于地壳源如土壤、建筑粉尘和道路扬尘等,在粗颗粒物中受土壤来源的影响更显著,在细颗粒物中受道路扬尘影响更显著[62],部分研究推测细粒径段(<0.1 μm)的Ca2+和Mg2+还可能来源于燃烧过程排放产物[63-64]。在甘新地区,虽然粗颗粒的Ca2+和Mg2+浓度高于细颗粒物,但受城市道路扬尘和燃烧排放影响,PM1中Ca2+和Mg2+占总离子的比重高于PM2.5和PM10,造成RA/C比值较低。
甘新城市PM10、PM2.5和PM1中的OC平均浓度分别(12.00±2.22) μg·m-3、(11.24±2.53) μg·m-3和(6.73±1.18) μg·m-3,分别占总PM浓度的8.6%、14.5 %和15.0%;PM10、PM2.5和PM1中EC平均浓度分别为(4.03±0.89) μg·m-3、(3.08±1.03) μg·m-3和(1.16±0.46) μg·m-3,分别占总PM浓度的2.9%、4.0%和2.6%。OC是直接排放或由挥发性有机物发生化学反应形成的,而EC主要是通过生物燃料和化石燃料的不完全燃烧直接排放[65],因此,OC/EC可以作为碳质气溶胶来源的诊断指标。以往的研究表明,特定OC/EC比值表明特定来源:森林火灾(14.5)、生物质燃烧(9.0)、煤炭燃烧(2.7)和机动车辆(1.1)[66]。OC/EC比值>2表明SOA的形成[67]。Saarikoski等[68]研究发现车辆排放的OC/EC比值为0.71,生物质燃烧的OC/EC比值为6.6。这与Schauer等[69]报道的结果相似,其研究表明木材燃烧的OC/EC比值为16.8~40.0,柴油/汽油驱动的汽车尾气比值为1.0~4.2。因此,化石燃料燃烧产生的OC/EC比值普遍较低,而生物质燃烧排放物的OC/EC比值往往较高[70]。甘新城市OC与EC之间有高的相关系数(R2=0.87~0.93,P<0.01),表明二者具有较强的共同排放源[71]。PM10、PM2.5和PM1中的OC/EC比值分别为3.2、6.8和10.8。OC/EC比值均大于2.0表明SOA形成较强,对粗颗粒来说,化石燃料更多地促成了碳质气溶胶的排放,而对较细颗粒来说,生物质燃烧排放会有显著贡献[72]。不同城市的比值不同,如图4所示,吉木乃的OC/EC比值较高,表明吉木乃的SOA形成较多。结合生物质燃烧指示物乙腈的数据来看,吉木乃的乙腈浓度也相对较高(0.26 ppbv),吉木乃是中国西北端的边陲小镇,人口较少,但较高的OC/EC比值结果表明吉木乃的秸秆燃烧更为普遍。
图4

图4
甘新城市颗粒物中碳质气溶胶的质量浓度和组成
Fig. 4
Mass concentration and composition of carbonaceous aerosols in particulate matter in Gansu-Xinjiang cities
本文的无机元素实验只分析了武威、张掖、酒泉和敦煌的PM10和PM2.5样品。结果表明,PM10和PM2.5中无机元素的平均浓度分别为(13.96±1.67) μg·m-3和(7.14±0.86) μg·m-3,分别占总PM浓度的10.0%和9.2%。浓度较高的无机元素为Ca>Al>Mg>Fe>Zn,这五种元素之和对PM10和PM2.5中的元素总和的贡献分别为96%~97%和93%~94%,说明地壳元素浓度较高。如图5所示,Cu、Pb、Zn、Cd、As和Se的EF值均大于10,可以确定这些元素来源于人为来源,如工业废气排放和汽车尾气排放等。Fe、Mg、Mn和Ca、的EF值均小于10,Fe的EF值甚至小于1,说明这些元素来自于地壳源。Ba、Cr和Ni的EF值范围为在10左右波动,如武威站点PM2.5中的Ni和Cr以及张掖站点PM2.5中的Ba超过10,这些元素的存在同时受地壳自然排放来源和人为活动排放来源影响。
图5
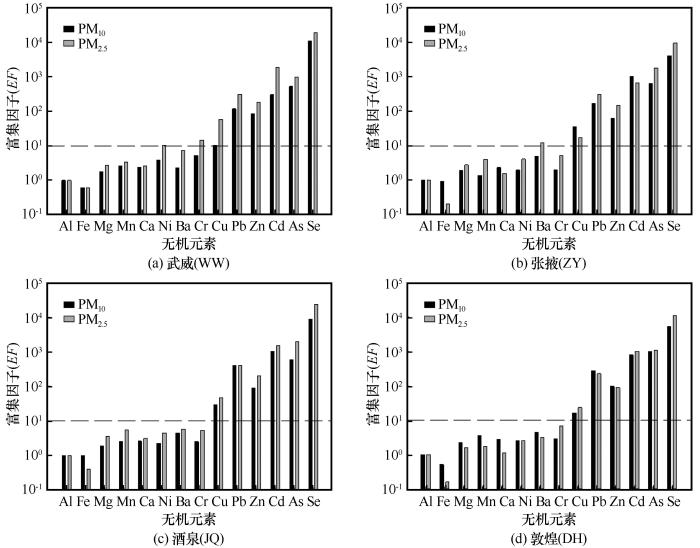
图5
甘新城市无机元素的富集因子(EF)
Fig. 5
Enrichment factors (EF) of inorganic elements in Gansu-Xinjiang cities: Wuwei (a), Zhangye (b), Jiuquan (c) and Dunhuang (d)
2.3 VOCs和颗粒物的健康风险评估
2.3.1 VOCs的非致癌和致癌风险评估
甘新城市VOCs组分(乙腈、MEK、甲苯、苯乙烯、二甲苯、三甲基苯、乙醛、苯和萘)对人群的非致癌风险评估见表7。九种VOCs组分的非致癌累积风险指数(HI)值是1.32(范围为8.63×10⁻¹~2.83),HI均值大于1(暴露人群的可接受水平),说明城市VOCs的非致癌风险显著。HI值较高的城市为金昌(2.83)、玉门(1.61)和兰州(1.22),HI值较低的城市为哈密(8.63×10⁻¹)、富蕴(8.69×10⁻¹)和吉木乃(9.90×10⁻¹)。HI值较高的组分为乙醛(1.12)、三甲基苯(1.47×10⁻¹)和苯(2.58×10⁻²),HI值较低的组分为萘(2.21×10⁻⁴)、甲苯(2.29×10⁻⁴)和MEK(3.02×10⁻⁴)。并且,乙醛的非致癌风险危害熵值(HQ)值在兰州、金昌和玉门均大于1,说明兰州、金昌和玉门存在潜在的乙醛暴露非致癌风险,而其他城市各VOCs组分的HQ值均小于1。
表7 甘新城市VOCs的非致癌和致癌风险评估
Table 7
| 非致癌风险 | 兰州 | 金昌 | 玉门 | 哈密 | 乌鲁木齐 | 克拉玛依 | 吉木乃 | 富蕴 | 平均 |
|---|---|---|---|---|---|---|---|---|---|
| 乙腈 | 2.07×10⁻² | 1.44×10⁻² | 5.69×10⁻³ | 5.09×10⁻³ | 8.99×10⁻³ | 5.69×10⁻³ | 7.79×10⁻³ | 5.69×10⁻³ | 9.25×10⁻³ |
| MEK | 3.50×10⁻⁴ | 8.75×10⁻⁴ | 2.00×10⁻⁴ | 1.38×10⁻⁴ | 4.31×10⁻⁴ | 1.94×10⁻⁴ | 1.06×10⁻⁴ | 1.19×10⁻⁴ | 3.02×10⁻⁴ |
| 甲苯 | 5.73×10⁻⁴ | 4.22×10⁻⁴ | 1.04×10⁻⁴ | 9.55×10⁻⁵ | 1.75×10⁻⁴ | 1.43×10⁻⁴ | 1.27×10⁻⁴ | 1.91×10⁻⁴ | 2.29×10⁻⁴ |
| 苯乙烯 | 1.48×10⁻³ | 2.16×10⁻³ | 1.12×10⁻³ | 8.99×10⁻⁴ | 8.54×10⁻⁴ | 8.09×10⁻⁴ | 7.19×10⁻⁴ | 1.08×10⁻³ | 1.14×10⁻³ |
| 二甲苯 | 2.79×10⁻² | 3.02×10⁻² | 6.87×10⁻³ | 5.98×10⁻³ | 1.28×10⁻² | 6.87×10⁻³ | 5.95×10⁻³ | 9.16×10⁻³ | 1.32×10⁻² |
| 三甲基苯 | 2.42×10⁻² | 3.57×10⁻¹ | 1.91×10⁻¹ | 1.28×10⁻¹ | 9.58×10⁻² | 9.93×10⁻² | 1.04×10⁻¹ | 1.75×10⁻¹ | 1.47×10⁻¹ |
| 乙醛 | 1.08 | 2.37 | 1.39 | 7.11×10⁻¹ | 9.59×10⁻¹ | 9.25×10⁻¹ | 8.58×10⁻¹ | 6.61×10⁻¹ | 1.12 |
| 苯 | 6.09×10⁻² | 5.41×10⁻² | 1.24×10⁻² | 1.24×10⁻² | 2.48×10⁻² | 1.24×10⁻² | 1.35×10⁻² | 1.58×10⁻² | 2.58×10⁻² |
| 萘 | 3.68×10⁻⁴ | 4.05×10⁻⁴ | 1.84×10⁻⁴ | 1.47×10⁻⁴ | 1.84×10⁻⁴ | 1.66×10⁻⁴ | 1.47×10⁻⁴ | 1.66×10⁻⁴ | 2.21×10⁻⁴ |
| HI值 | 1.22 | 2.83 | 1.61 | 8.63×10⁻¹ | 1.10 | 1.05 | 9.90×10⁻¹ | 8.69×10⁻¹ | 1.32 |
| 致癌风险 | 兰州 | 金昌 | 玉门 | 哈密 | 乌鲁木齐 | 克拉玛依 | 吉木乃 | 富蕴 | 平均 |
| 乙醛 | 8.88×10⁻⁶ | 1.95×10⁻⁵ | 1.14×10⁻⁵ | 5.82×10⁻⁶ | 7.85×10⁻⁶ | 7.57×10⁻⁶ | 7.02×10⁻⁶ | 5.41×10⁻⁶ | 9.18×10⁻⁶ |
| 苯 | 5.91×10⁻⁶ | 5.25×10⁻⁶ | 1.20×10⁻⁶ | 1.20×10⁻⁶ | 2.40×10⁻⁶ | 1.20×10⁻⁶ | 1.31×10⁻⁶ | 1.53×10⁻⁶ | 2.50×10⁻⁶ |
| 萘 | 1.56×10⁻⁵ | 1.71×10⁻⁵ | 7.79×10⁻⁶ | 6.21×10⁻⁶ | 7.76×10⁻⁶ | 6.98×10⁻⁶ | 6.21×10⁻⁶ | 6.99×10⁻⁶ | 9.33×10⁻⁶ |
| LCR值 | 3.04×10⁻⁵ | 4.19×10⁻⁵ | 2.04×10⁻⁵ | 1.32×10⁻⁵ | 1.80×10⁻⁵ | 1.58×10⁻⁵ | 1.45×10⁻⁵ | 1.39×10⁻⁵ | 2.10×10⁻⁵ |
甘新城市VOCs组分(乙醛、苯和萘)对人群的致癌风险评估见表7。三种VOCs组分的终生致癌风险指数(LCR)值是2.10×10⁻⁵(范围为1.32×10⁻⁵至4.19×10⁻⁵),LCR均值介于1.00×10⁻⁴(暴露人群的可耐受水平)至1.00×10⁻⁶(暴露人群的可接受水平)之间,说明城市VOCs的致癌风险处于可接受水平。LCR值较高的城市为金昌(4.19×10⁻⁵)、兰州(3.04×10⁻⁵)和玉门(2.04×10⁻⁵),LCR值较低的城市为哈密(1.31×10⁻⁵)、富蕴(1.39×10⁻⁵)和吉木乃(1.45×10⁻⁵)。各组分的LCR值高低排序为萘(9.33×10⁻⁶)>乙醛(9.18×10⁻⁶)>苯(2.50×10⁻⁶),且萘和乙醛在所有城市的致癌暴露的(Risk)值介于1.00×10⁻⁴~1.00×10⁻⁶之间,说明城市的萘和乙醛的致癌风险处于可接受水平。
因此,为减少VOCs的非致癌风险需要管控乙醛,为减少致癌风险需要管控乙醛和萘。研究表明甘新城市居民区大气中乙醛主要来自于机动车尾气,其次为溶剂使用[37]。城市汽车含氧燃料(包括乙醇和甲基叔丁基醚混合燃料等)的使用会增加燃料乙醛的排放量[73];城市化进程中,人为生产生活的溶剂使用会挥发大量乙醛,例如装修油品、工业有机原料等[74]。建议严格管控城市机动车尾气排放和溶剂使用以减少乙醛的排放。此外,据Altshuller[75]计算,乙醛的二次生成可能大于一次排放,且二次生成的高峰期通常出现在中午时期(11:00 am—15:00 pm)。建议当地居民应尽量避免在高浓度乙醛下(即中午时期)暴露。萘的来源主要为汽车尾气排放和煤炭/生物质燃烧,其次是工业排放等[76],Kumar等[77]提出汽车尾气排放的萘占城区大气中萘总量的70%,Tang等[78]提出煤炭燃烧是大气中萘的主要贡献者(43.4%)。建议优先管控甘新城市机动车尾气排放和生物质/煤炭燃烧以减少萘的排放。
2.3.2 颗粒物中重金属的非致癌和致癌风险评估
甘新城市PM10和PM2.5中重金属(Mn、Zn、Cu、Pb、Cd、As、Cr和Ni)对人群的非致癌风险评估分别见表8和表9。PM10和PM2.5中八种重金属的HI均值是2.39(范围为1.24至3.28)和1.81(范围为1.41至2.27),HI值均大于1,说明城市PM中重金属的非致癌风险显著,PM10高于PM2.5。PM10中重金属的HI值较高的城市为敦煌(3.28),较低的城市为张掖(1.24);PM2.5中重金属的HI值较高的城市为敦煌(2.27),较低的城市为张掖(1.41)。所有城市PM中的Mn元素的风险指数HQ值均大于1,说明各城市存在潜在的Mn暴露非致癌风险。其他七种元素的HQ值均小于1,说明各城市的Zn、Cu、Pb、Cd、As、Cr和Ni元素不存在非致癌风险。
表8 甘新城市PM10中重金属的非致癌风险和致癌风险评估
Table 8
| 非致癌风险 | 武威 | 张掖 | 酒泉 | 敦煌 | 平均 |
|---|---|---|---|---|---|
| Mn | 2.37 | 1.09 | 2.18 | 2.91 | 2.14 |
| Zn | 2.59×10⁻⁴ | 1.73×10⁻⁴ | 2.68×10⁻⁴ | 2.59×10⁻⁴ | 2.40×10⁻⁴ |
| Cu | 1.94×10⁻⁴ | 5.83×10⁻⁴ | 5.18×10⁻⁴ | 2.59×10⁻⁴ | 3.88×10⁻⁴ |
| Pb | 5.91×10⁻³ | 6.65×10⁻³ | 1.77×10⁻² | 1.11×10⁻² | 1.04×10⁻² |
| Cd | 1.36×10⁻⁴ | 4.53×10⁻⁵ | 4.53×10⁻⁵ | 1.36×10⁻⁴ | 2.02×10⁻³ |
| As | 4.32×10⁻² | 4.32×10⁻² | 6.05×10⁻² | 7.78×10⁻² | 5.62×10⁻² |
| Cr | 2.73×10⁻¹ | 9.10×10⁻² | 9.10×10⁻² | 2.73×10⁻¹ | 1.82×10⁻¹ |
| Ni | 2.53×10⁻⁴ | 1.26×10⁻⁴ | 1.26×10⁻⁴ | 1.26×10⁻⁴ | 1.58×10⁻⁴ |
| HI值 | 2.69 | 1.24 | 2.36 | 3.28 | 2.39 |
| 致癌风险 | 武威 | 张掖 | 酒泉 | 敦煌 | 平均 |
| Cd | 6.80×10⁻⁷ | 6.80×10⁻⁶ | 6.80×10⁻⁶ | 6.80×10⁻⁶ | 6.80×10⁻⁶ |
| As | 8.15×10⁻⁵ | 8.15×10⁻⁵ | 1.14×10⁻⁴ | 1.47×10⁻⁴ | 1.14×10⁻⁴ |
| Cr | 1.36×10⁻⁴ | 4.53×10⁻⁵ | 4.53×10⁻⁵ | 1.36×10⁻⁴ | 9.07×10⁻⁵ |
| Ni | 1.81×10⁻⁶ | 9.07×10⁻⁷ | 9.07×10⁻⁷ | 9.07×10⁻⁷ | 9.07×10⁻⁷ |
| LCR值 | 2.20×10⁻⁴ | 1.35×10⁻⁴ | 1.67×10⁻⁴ | 2.90×10⁻⁴ | 2.12×10⁻⁴ |
表9 甘新城市PM2.5中重金属的非致癌风险和致癌风险评估
Table 9
| 非致癌风险 | 武威 | 张掖 | 酒泉 | 敦煌 | 平均 |
|---|---|---|---|---|---|
| Mn | 1.27 | 1.27 | 1.82 | 2.00 | 1.59 |
| Zn | 2.25×10⁻⁴ | 2.51×10⁻⁴ | 2.25×10⁻⁴ | 2.42×10⁻⁴ | 2.36×10⁻⁴ |
| Cu | 4.53×10⁻⁴ | 1.94×10⁻⁴ | 3.24×10⁻⁴ | 3.88×10⁻⁴ | 3.40×10⁻⁴ |
| Pb | 5.91×10⁻³ | 8.13×10⁻³ | 6.65×10⁻³ | 9.61×10⁻³ | 7.58×10⁻³ |
| Cd | 2.60×10⁻³ | 2.60×10⁻⁴ | 2.60×10⁻³ | 2.60×10⁻³ | 2.02×10⁻³ |
| As | 3.46×10⁻² | 3.46×10⁻² | 4.32×10⁻² | 6.92×10⁻² | 4.54×10⁻² |
| Cr | 2.73×10⁻¹ | 9.10×10⁻² | 9.10×10⁻² | 1.82×10⁻¹ | 1.59×10⁻¹ |
| Ni | 2.53×10⁻⁴ | 1.26×10⁻⁴ | 1.26×10⁻⁴ | 1.26×10⁻⁴ | 1.58×10⁻⁴ |
| HI值 | 1.59 | 1.41 | 1.96 | 2.27 | 1.81 |
| 致癌风险 | 武威 | 张掖 | 酒泉 | 敦煌 | 平均 |
| Cd | 6.80×10⁻⁶ | 6.80×10⁻⁷ | 6.80×10⁻⁶ | 6.80×10⁻⁶ | 6.80×10⁻⁶ |
| As | 6.52×10⁻⁵ | 6.52×10⁻⁵ | 8.15×10⁻⁵ | 1.30×10⁻⁴ | 8.15×10⁻⁵ |
| Cr | 1.36×10⁻⁴ | 4.53×10⁻⁵ | 4.53×10⁻⁵ | 9.07×10⁻⁵ | 9.07×10⁻⁵ |
| Ni | 1.81×10⁻⁶ | 9.07×10⁻⁷ | 9.07×10⁻⁷ | 9.07×10⁻⁷ | 9.07×10⁻⁷ |
| LCR值 | 2.10×10⁻⁴ | 1.12×10⁻⁴ | 1.35×10⁻⁴ | 2.29×10⁻⁴ | 1.80×10⁻⁴ |
甘新城市PM10和PM2.5中的重金属(As、Cd、Ni和Cr)对人群的致癌风险评估见表8和表9。PM10和PM2.5中四种重金属的LCR值分别是2.12×10⁻⁴(范围为1.35×10⁻⁴~2.90×10⁻⁴)和1.80×10⁻⁴(范围为1.12×10⁻⁴~2.29×10⁻⁴),LCR值均大于1.00×10⁻⁴,说明城市PM中重金属的致癌风险显著,对PM10高于PM2.5。PM10中重金属的LCR值较高的城市为敦煌(2.90×10⁻⁴),较低的城市为张掖(1.35×10⁻⁴);PM2.5中重金属的LCR值较高的城市为敦煌(2.29×10⁻⁴),较低的城市为张掖(1.12×10⁻⁴)。对于各重金属元素来说,各城市Ni元素的致癌风险指数Risk值低于1.00×10⁻⁶,说明Ni元素的致癌风险可忽略不计。各城市As、Cd和Cr元素的致癌风险指数Risk值介于1.00×10⁻⁴~1.00×10⁻⁶之间,As元素最高,说明As、Cd和Cr元素致癌风险在可接受范围内,但As的致癌风险更高。
因此,为减少重金属的非致癌风险需要管控Mn元素,为减少致癌风险需要管控As元素。研究表明Mn元素主要由风起扬尘过程产生,其次为金属冶炼和机动车尾气排放等[79-80]。在无机元素的富集因子分析中表明(图5),甘新城市Mn元素的EF值低于1,印证该地区大气Mn污染主要来自扬尘。建议优先管控甘新城市的扬尘以减少Mn的排放,例如道路、堆场和施工扬尘等。而As元素主要由人为活动产生,研究表明甘新城市As污染主要来自燃煤,其他少量来源为工业生产及含砷农药的使用等[81-82],建议优先管控甘新城市的燃煤以减少As的排放。As和Mn元素一般会富集在PM上进入大气中,故可提升污染排放PM的除尘技术,并改善对应设备[83]。最后,建议推进大气污染物中As和Mn元素排放标准的制修订工作,将其纳为环境空气质量标准的基本项目。
2.3.3 不确定性分析
健康风险评估存在一定不确定性,主要体现在:(1)模型中人群暴露参数的获取途径主要基于以往的文献研究,而非采样或实验获取。暴露参数的研究结果具有一定代表性,但可能会产生过高或过低的评估误差。(2)由于大气污染物主要由呼吸进入人体,本文主要考虑由呼吸道吸入途径的健康风险,经消化道和皮肤摄入途径忽略不计,这会一定程度低估污染物的健康风险。(3)受数据和参考资料限制,未计算所有大气污染物的健康风险,如正己烷等毒性较强的VOCs,这会一定程度低估污染物的健康风险。
3 结论
VOCs和PM在我国的排放负荷巨大,西北地区大气环境具有沙尘量高且湿度低的特点,近年来二次污染程度不断加剧,对该地区大气污染特征和影响的科学认识亟待提高。通过对甘新地区十三个城市的VOCs和三种粒径颗粒物(PM10、PM2.5和PM1)进行综合观测,本文揭示了该地区VOCs和颗粒物的污染特征和健康风险,主要结论如下:
(1)污染特征分析表明甘新城市平均TVOCs浓度为41.84 ppbv,主要VOCs物种为甲醇(22.75 ppbv)、乙醛(5.23 ppbv)、甲酸+乙醇(2.75 ppbv)、丙酮(2.57 ppbv)和乙酸(2.10 ppbv)。金昌、乌鲁木齐和兰州的VOCs浓度较高,而克拉玛依、吉木乃和哈密的浓度较低。VOCs组分的总浓度高于国内外其他城市的平均浓度,主要为甲醇的浓度较高,而芳香烃的浓度低于其他城市。PM10、PM2.5和PM1的平均质量浓度分别为139.39 μg·m-3、77.66 μg·m-3和44.76 μg·m-3,金昌、玉门、乌鲁木齐和酒泉的PM10和PM2.5浓度超过国家二级标准,WSIIs是PM的主要组分,占总PM浓度的25%~32%。
(2)健康风险评估表明甘新城市VOCs的非致癌风险显著,致癌风险处于可接受水平。金昌市VOCs的致癌和非致癌风险均较高,而哈密市均最低。各VOCs组分中,乙醛的非致癌风险较高,萘的致癌风险较高。PM10和PM2.5中重金属元素的非致癌和致癌风险均显著,且PM10的致癌和非致癌风险均高于PM2.5。敦煌市重金属元素的致癌和非致癌风险均最高,而张掖市均最低。各重金属元素中,Mn元素的非致癌风险较高,As元素的致癌风险较高。
参考文献
Air quality and radiative forcing impacts of anthropogenic volatile organic compound emissions from ten world regions
[J].
Review on recent progress in observations, source identifications and countermeasures of PM2.5
[J].
Atmospheric degradation of volatile organic compounds
[J].
Chemistry of secondary organic aerosol: formation and evolution of low-volatility organics in the atmosphere
[J].
Persistent growth of anthropogenic non-methane volatile organic compound (NMVOC) emissions in China during 1990—2017: drivers, speciation and ozone formation potential
[J].
Long-term efforts for blue sky forever: pollution co-controlling on PM2.5 and ozone
[J].
久久为功, 蓝天永驻: PM2.5与臭氧协同控制
[J].
PM2.5 pollution in a megacity of southwest China: source apportionment and implication
[J].
Characterization of non-methane hydrocarbons and their sources in an industrialized coastal city, Yangtze River Delta, China
[J].
Source directional apportionment of ambient PM2.5 in urban and industrial sites at a megacity in China
[J].
Sources of oxygenated volatile organic compounds (OVOCs) in urban atmospheres in North and South China
[J].
Variation in PM2.5 source over megacities on the ancient Silk Road, northwestern China
[J].
Chemical nature and predominant sources of PM10 and PM2.5 from multiple sites on the Silk Road, Northwest China
[J].
Characteristics of the severe March 2021 Gobi Desert dust storm and its impact on air pollution in China
[J].
Alert to the migration of air pollution and carbon emission to northwest China
[J].
警惕大气污染和碳排放向西北迁移
[J].
The molecular identification of organic compounds in the atmosphere: state of the art and challenges
[J].
Proton-transfer reaction mass spectrometry
[J].
Measurements of volatile organic compounds in the earth’s atmosphere using proton-transfer-reaction mass spectrometry
[J].
On quantitative determination of volatile organic compound concentrations using proton transfer reaction time-of-flight mass spectrometry
[J].
Proton-transfer-reaction mass spectrometry: applications in atmospheric sciences
[J].
Validation of proton transfer reaction mass spectrometry (PTR-MS) measurements of gas-phase organic compounds in the atmosphere during the New England Air Quality Study (NEAQS) in 2002
[J].
Multisize particulate matter and volatile organic compounds in arid and semiarid areas of Northwest China
[J].
Soluble species in aerosol and snow and their relationship at Glacier 1, Tien Shan, China
[J].
Determination of soluble ions in atmospheric aerosol by ion chromatography
[J].
Carbonaceous Aerosols in PM1, PM2.5, and PM10 Size Fractions over the Lanzhou City, Northwest China
[J].
The geochemical evolution of the continental crust
[J].
High wintertime particulate matter pollution over an offshore island (Kinmen) off southeastern China: an overview
[J].
Risk assessment guidance for superfund: Volume I. Human health evaluation manual (Part E, supplemental guidance for dermal risk assessment)
[R].
Chemical composition of pre-monsoon air in the Indo-Gangetic plain measured using a new air quality facility and PTR-MS: high surface ozone and strong influence of biomass burning
[J].
Ambient VOC measurements in Mexico City during the MCMA 2002 and 2003 field campaigns
[C]//
Contribution of biogenic and photochemical sources to ambient VOCs during winter to summer transition at a semi-arid urban site in India
[J].
Chemical evolution of volatile organic compounds in the outflow of the Mexico City Metropolitan area
[J].
Monitoring of volatile organic compounds (VOCs) from an oil and gas station in Northwest China for 1 year
[J].
Volatile organic compounds in a typical petrochemical industrialized valley city of northwest China based on high-resolution PTR-MS measurements: characterization, sources and chemical effects
[J].
Source attributions of hazardous aromatic hydrocarbons in urban, suburban and rural areas in the Pearl River Delta (PRD) region
[J].
Evaluated kinetic and photochemical data for atmospheric chemistry: Volume II-gas phase reactions of organic species
[J].
WorldClim 2: new 1 km spatial resolution climate surfaces for global land areas
[J].
Mixing ratios and eddy covariance flux measurements of volatile organic compounds from an urban canopy (Manchester, UK)
[J].
Seasonal variability and source apportionment of volatile organic compounds (VOCs) in the Paris megacity (France)
[J].
Ambient air quality in the Kathmandu Valley, Nepal, during the pre-monsoon: concentrations and sources of particulate matter and trace gases
[J].
Anthropogenic and biogenic influence on VOC fluxes at an urban background site in Helsinki, Finland
[J].
Daily, weekly and seasonal relationships among VOCs, NOx and O3 in a semi-urban area near Barcelona
[J].
Long-term study of VOCs measured with PTR-MS at a rural site in New Hampshire with urban influences
[J].
On the processes governing the variability of PTR-MS based VOCs and OVOCs in different seasons of a year over hillocky mega city of India
[J].
Examining the major contributors of ozone pollution in a rural area of the Yangtze River Delta region during harvest season
[J].
Measurement report: important contributions of oxygenated compounds to emissions and chemistry of volatile organic compounds in urban air
[J].
Exploration of sources of OVOCs in various atmospheres in southern China
[J].
VOC emissions, evolutions and contributions to SOA formation at a receptor site in eastern China
[J].
Increasing importance of nitrate formation for heavy aerosol pollution in two megacities in Sichuan Basin, southwest China
[J].
Mixing of Asian dust with pollution aerosol and the transformation of aerosol components during the dust storm over China in spring 2007
[J].
Relationships among aerosol constituents from Asia and the north pacific during pem-west
[J].
Annual and diurnal variations of gaseous and particulate pollutants in 31 provincial capital cities based on in situ air quality monitoring data from China National Environmental Monitoring Center
[J].
Chemical characterization of fine particulate matter in Changzhou, China, and source apportionment with offline aerosol mass spectrometry
[J].
Ion balance and acidity of size-segregated particles during haze episodes in urban Beijing
[J].
Airborne submicron particulate (PM1) pollution in Shanghai: chemical variability, source apportionments and the impacts on haze formation
[D].
上海市大气亚微米级颗粒物(PM1)污染特征与霾污染形成机制
[D].
Size-resolved airborne particulate oxalic and related secondary organic aerosol species in the urban atmosphere of Chengdu, China
[J].
Characteristics of water-soluble ions in multi-size particles in Chongqing
[J].
. 重庆市不同粒径颗粒物中水溶性离子污染特征
[J].
Characteristics of secondary inorganic aerosol and sulfate species in size-fractionated aerosol particles in Shanghai
[J].
Particle size distribution and pollution characteristics of water-soluble ions in atmospheric particulate matter in Jiangbei New Area, Nanjing
[D].
南京江北新区大气颗粒物中水溶性离子的粒径分布和污染特征
[D].
Seasonal variations in particle size distribution and water-soluble ion composition of atmospheric particles in Chengdu
[J].
成都市大气颗粒物粒径分布及水溶性离子组成的季节变化特征
[J].
Size distribution of water-soluble inorganic ions in urban aerosols in Shanghai
[J].
Characterization and source apportionment of atmospheric organic and elemental carbon during fall and winter of 2003 in Xi’an, China
[J].
Review of volatile organic compound source apportionment by chemical mass balance
[J].
Descriptive analysis of PM2.5 and PM10 at regionally representative locations during SJVAQS/AUSPEX
[J].
Impact of biomass combustion on urban fine particulate matter in Central and Northern Europe
[J].
Measurement of emissions from air pollution sources. 5. C1-C32 organic compounds from gasoline-powered motor vehicles
[J].
Different characteristics of char and soot in the atmosphere and their ratio as an indicator for source identification in Xi’an, China
[J].
Characterization of carbonaceous aerosols over the urban tropical location and a new approach to evaluate their climatic importance
[J].
Simultaneous measurements of black carbon and PM2.5, CO and NO x variability at a locally polluted urban location in India
[J].
Sources and sinks of formaldehyde and acetaldehyde: an analysis of Denver’s ambient concentration data
[J].
Pollution characteristics and sources of atmospheric VOCs in Nanchang in 2021
[D].
南昌市2021年大气VOCs污染特征和来源分析
[D].
Production of aldehydes as primary emissions and from secondary atmospheric reactions of alkenes and alkanes during the night and early morning hours
[J].
Ambient naphthalene and methylnaphthalenes observed at an urban site in the Pearl River Delta region: sources and contributions to secondary organic aerosol
[J].
Studies on carcinogenic PAHs emission generated by vehicles and its correlation to fuel and engine types
[J].
Triple isotopes (δ 13C, δ 2H, and Δ14C) compositions and source apportionment of atmospheric naphthalene: a key surrogate of intermediate-volatility organic compounds (IVOCs)
[J].
Emission inventory of eight elements, Fe, Al, K, Mg, Mn, Na, Ca and Ti, in dust source region of East Asia
[J].
Review of PM2.5 source apportionment methods in China
[J].
中国PM2.5来源解析方法综述
[J].
Heavy metal pollution levels, source apportionment and risk assessment in dust storms in key cities in Northwest China
[J].
The pollution characteristics, source analysis and health risk assessment of PM2.5, PM10 and their inorganic elements in Jiayuguan City
[D].
嘉峪关市大气颗粒物PM2.5, PM10及其无机元素污染特征、来源解析及健康风险评价
[D].

 甘公网安备 62010202000676号