Applicability evaluation of CLM5. 0 in simulating soil temperature and carbon cycle in Alaskan permafrost region
YAN Xuchun,1,2, WU Xiaodong,1, LÜ Yaqiong3, WU Tonghua1, LI Ren1, HU Guojie1, ZOU Defu1, LIU Yadong1,2, WEI Xianhua1,2, FAN Xiaoying1,2, WANG Dong1,2
1.Cryosphere Research Station on the Qinghai-Tibet Plateau,State Key Laboratory of Cryospheric Science,Northwest Institute of Eco-Environment and Resources,Chinese Academy of Sciences,Lanzhou 730000,China
2.University of Chinese Academy of Sciences,Beijing 100049,China
3.Institute of Mountain Hazards and Environment,Chinese Academy of Sciences,Chengdu 610299,China
气候变暖对北极多年冻土和植被产生了重要的影响。CLM(Community Land Model)是应用最广泛的陆面过程模式之一,但其中复杂的边界条件和参数化过程导致模式模拟结果存在一定的不确定性。本研究评估了CLM5.0对阿拉斯加多年冻土区表层土壤温度和碳循环的模拟能力,结果表明,CLM5.0可以捕捉到表层土壤温度的季节变化。在苔原和针叶林站点,CLM5.0在日尺度和月尺度都可以很好地模拟出总初级生产力(GPP)随时间的变化,但对净生态系统碳交换(NEE)的模拟结果存在一定的不确定性。CLM5.0可以较为合理地模拟高纬度多年冻土区的土壤温度季节变化,在未来的研究中可能还需要从结构、参数化方案等过程进行改进,从而进一步提升高纬度多年冻土区碳循环的模拟精度。
关键词:CLM5.0
;
阿拉斯加
;
土壤温度
;
碳循环
;
多年冻土
Abstract
Climate warming has an important effect on Arctic permafrost and vegetation. Community Land Model (CLM) is one of the most widely used land surface models. However, the complex boundary conditions and parameterization process lead to uncertainty of the simulated results. In this study, we evaluated the simulation performance of the surface soil temperature and carbon cycle in Alaskan permafrost region using the CLM5.0. The results showed that CLM5.0 could capture the seasonal changes of surface soil temperature. At the tundra and needleleaf forests sites, the change of gross primary productivity (GPP) with time simulated by CLM5.0 on both daily and monthly scales were well simulated. The simulated net ecosystem exchange (NEE) has certain uncertainty. This study demonstrates that CLM5.0 can simulate the seasonal changes of soil temperature in high latitudinal permafrost region, but the model may be necessarily improved in the structure, parameterization scheme to improve the simulation accuracy for the carbon cycle.
YAN Xuchun, WU Xiaodong, LÜ Yaqiong, WU Tonghua, LI Ren, HU Guojie, ZOU Defu, LIU Yadong, WEI Xianhua, FAN Xiaoying, WANG Dong. Applicability evaluation of CLM5. 0 in simulating soil temperature and carbon cycle in Alaskan permafrost region[J]. Journal of Glaciology and Geocryology, 2023, 45(3): 902-914 doi:10.7522/j.issn.1000-0240.2023.0068
Community Land Model version 5.0(CLM5.0)是Community Earth System Mode version 2.0的陆面模块最新版本[18]。CLM是应用最广泛的陆面过程模式之一,并且有助于全球模式的比较和对于未来气候的预测[17,19]。CLM可以模拟出北半球多年冻土区冻土的变化趋势[20]和未来变暖情景下的碳动态[21]。目前最新版本的CLM5.0对于与植被相关的碳通量、水通量、能量通量和生物地球化学进行了改进[22]。与过去版本的模型(即CLM4.0和CLM4.5)相比,CLM5.0在全球范围内都有所改善。已经在全球很多区域对CLM碳循环的模拟性能进行了评估,强迫数据、植被功能型、植物氮循环、微生物动态和积雪方案等的改进可以降低CLM碳循环模拟的偏差[21,23-27]。
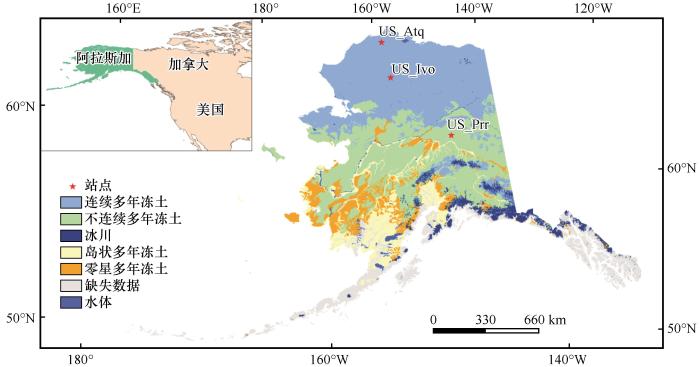
阿拉斯加位于北半球高纬度地区(图1),经纬度范围54°~71° N、130°~173° W。三面环海(北太平洋、白令海和北冰洋),降水量丰富(多积雪)。多年冻土约占阿拉斯加总面积的80%,包括连续多年冻土(29%)、不连续多年冻土(35%)、零星多年冻土(8%)和岛状多年冻土(8%)。阿拉斯加15%的地区没有多年冻土,冰川和冰盖占总面积的4%,大型水体占总面积的1%[28],主要地表覆盖类型为苔原和森林[29]。选择三个站点为研究对象Atqasuk (US_Atq)[30]、Ivotuk (US_Ivo)[31]、Poker Flat Research Range Black Spruce Forest (US_Prr)[32]。US_Atq站点位于阿拉斯加Barrow南100 km连续多年冻土区,为排水良好的高地,植被类型为苔原(潮湿沿海莎草),站点年均积雪覆盖300天;US_Ivo站点位于阿拉斯加Barrow南300 km布鲁克斯山脉山麓的连续多年冻土区,植被类型为苔原(矮灌木、苔藓),站点年均积雪覆盖280天;US_Prr站点位于阿拉斯加中部不连续多年冻土区,地形平坦,植被类型为常绿针叶林(黑云杉林),站点年均积雪覆盖210天。详细信息如表1所示。
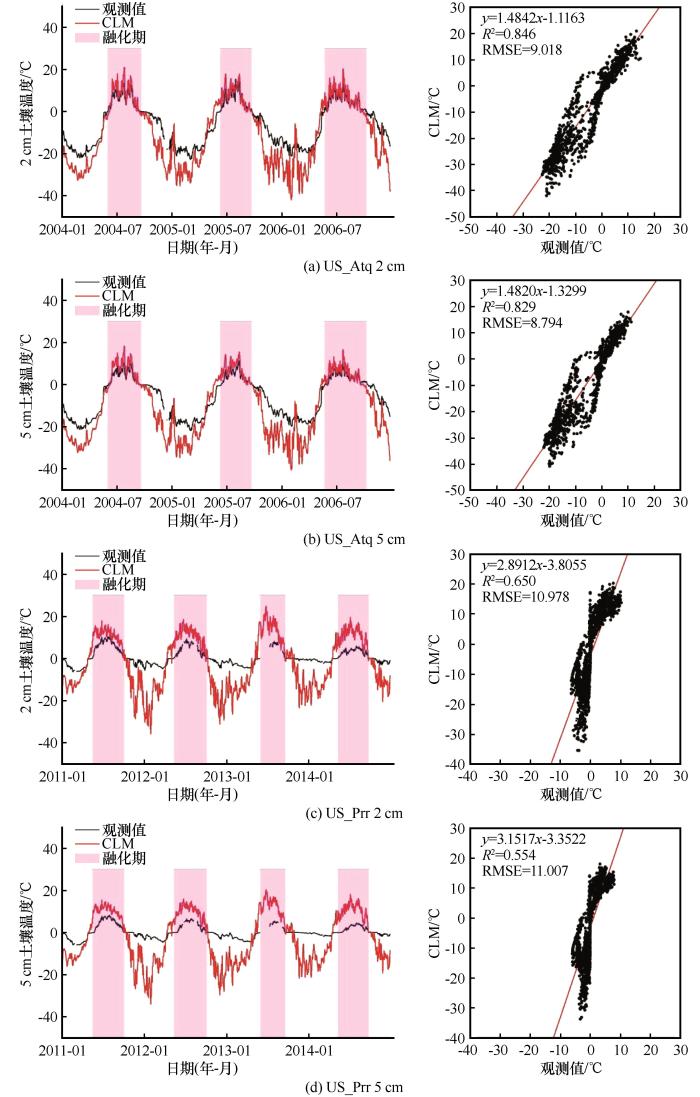
Fig. 2
Simulated and observed surface soil temperature [The left panels show time series of CLM simulations (red lines) and observed surface soil temperature (black lines); the right panels show scatter plots of CLM simulations and observed surface soil temperature, and the red lines are fitted lines. In this study, shading indicates the thawing period (The thaw start-date, thaw end-date, and thaw duration were calculated by determining daily soil temperature at a depth of 2 cm was above or below 0 ℃[47]). The thawing period is from 151 to 264 (day of year, the same below) in 2004, 161 to 267 in 2005, 144 to 285 in 2006 at US_Atq site; from 135 to 277 in 2011, 133 to 279 in 2012, 150 to 264 in 2013, 132 to 270 in 2014 at US_Prr site]
Table 3
表3
表3各站点模拟表层土壤温度的评价指标
Table 3 Evaluation indexes of simulated soil temperature at the observation sites
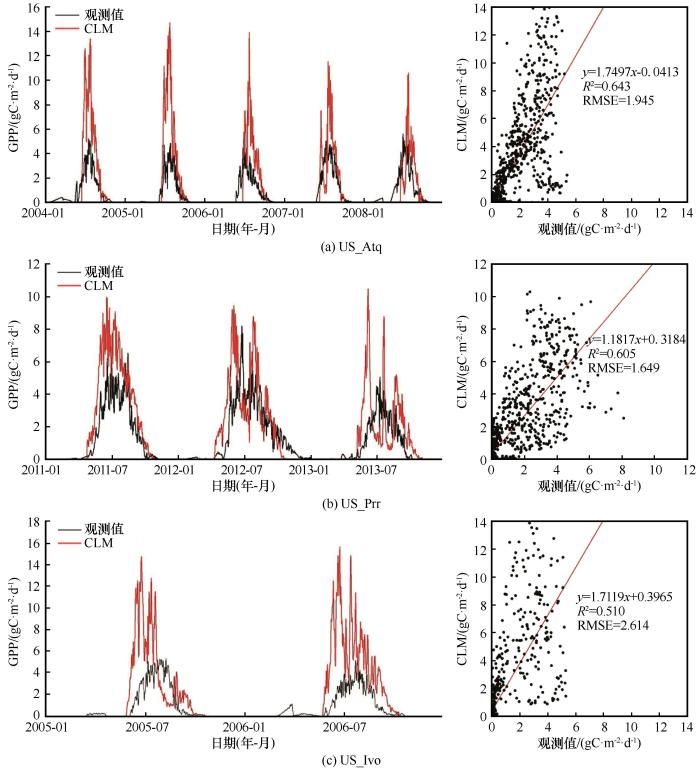
Fig. 3
Simulated and observed GPP (gross primary production) on daily time scale [The left panels show time series of CLM simulations (red lines) and GPP using flux tower observations (black lines); the right panels show scatter plots of CLM simulations and observed GPP, and the red lines are fitted lines]
Table 4
表4
表4各站点日尺度模拟GPP与NEE的评价指标
Table 4 Evaluation indexes of simulated GPP and NEE (net ecosystem exchange) on daily time scale at the observation sites
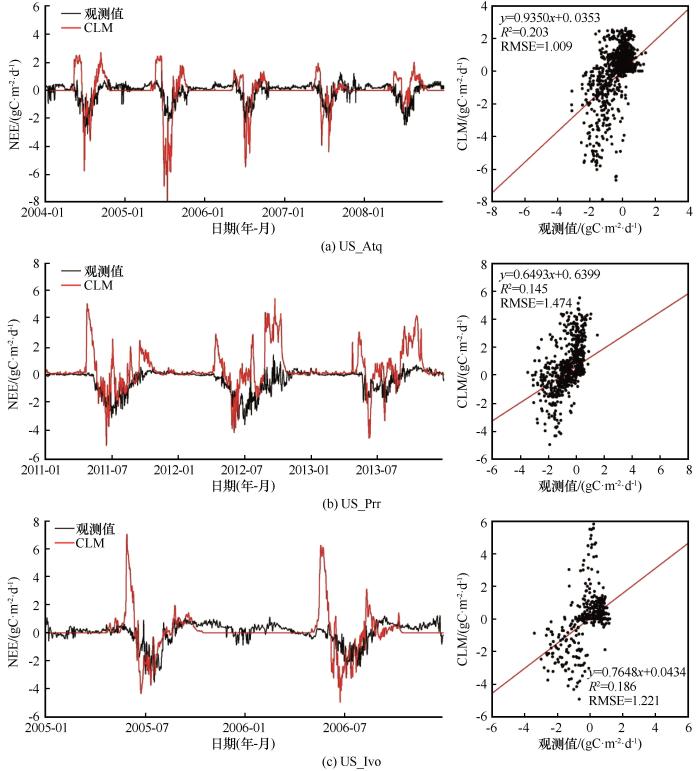
Fig. 4
Simulated and observed NEE on daily time scale [The left panels show time series of CLM simulations (red lines) and NEE using flux tower observations (black lines); the right panels show scatter plots of CLM simulations and observed NEE, and the red lines are fitted lines]
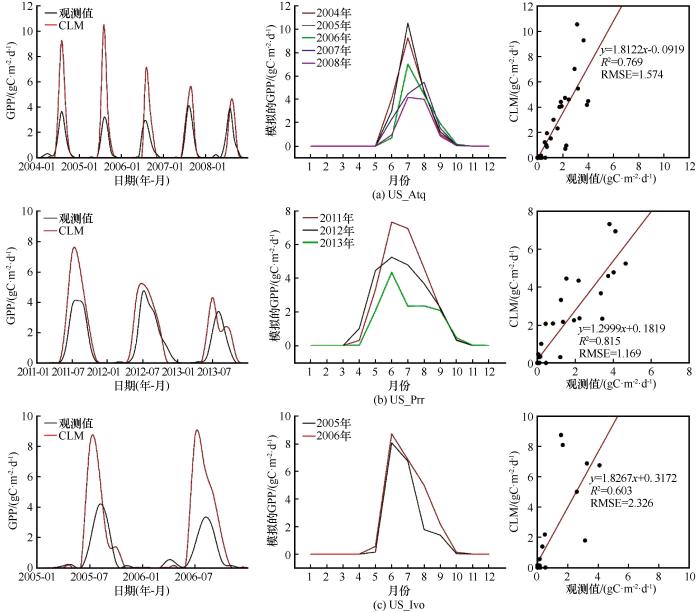
Fig. 5
Simulated and observed GPP on monthly time scale [The left panels show time series of CLM simulations (red lines) and GPP using flux tower observations (black lines); the middle panels show monthly changes in simulated GPP for different years; the right panels show scatter plots of CLM simulations and observed GPP, and the red lines are fitted lines]
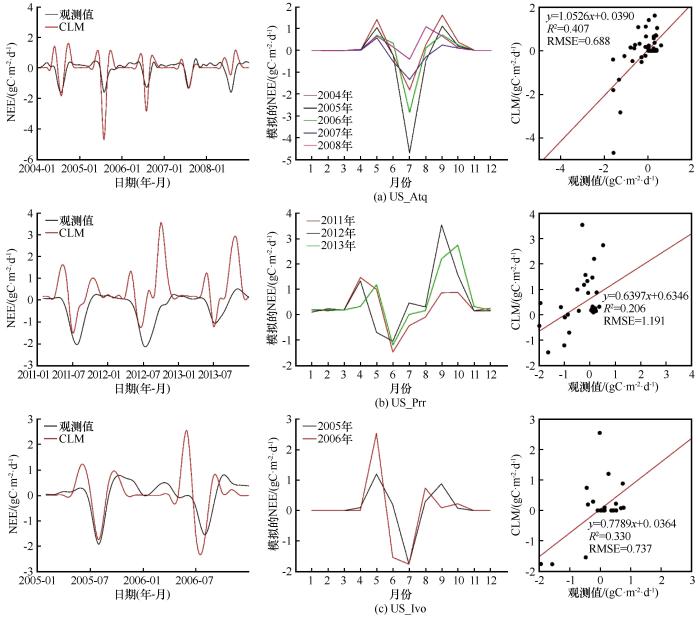
Fig. 6
Simulated and observed NEE on monthly time scale [The left panels show time series of CLM simulations (red lines) and NEE using flux tower observations (black lines); the middle panels show monthly changes in simulated NEE for different years; the right panels show scatter plots of CLM simulations and observed NEE, and the red lines are fitted lines]
Table 5
表5
表5各站点月尺度GPP与NEE模拟的评价指标
Table 5 Evaluation indexes of simulated GPP and NEE on monthly time scale at the observation sites
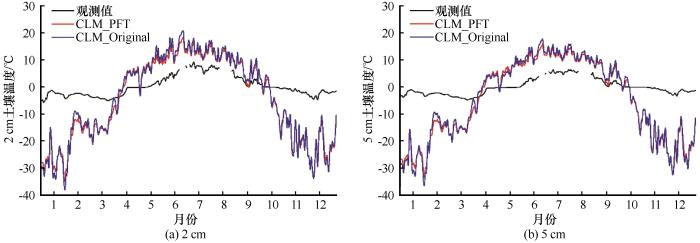
Fig. 7
Simulated and observed surface soil temperature at US_Prr site [Time series of CLM simulations (CLM_PFT means changed surface vegetation, red lines; CLM_Original means model default, blue lines) and observed surface soil temperature (black lines)]
Table 6
表6
表6US_Prr站点2012年模拟表层土壤温度的评价指标
Table 6 Evaluation indexes of simulated surface soil temperature in 2012 at US_Prr site
在当前的气候条件下,在站点尺度,CLM5.0对于阿拉斯加NEE的模拟表现出很强的碳吸收能力,同时也可以模拟出季节性NEE峰值时间。这与ecosys模型模拟结果以及基于观测的产品相一致,但是对于碳循环的季节性的捕捉还有很大的不确定性[67]。Fisher等[68]用10个North American Carbon Program (NACP)站点集成模型比较分析了阿拉斯加North Slope苔原区域(Atqasuk和Barrow站点)的GPP和NEE。与本研究相比,在US_Atq站点,CLM5.0对于NEE模拟的R2=0.407,这比10个NACP站点集成模型的模拟结果更好(R2=0.13)。在US_Atq站点观测到的最大的碳吸收通常是在6月,而CLM5.0模拟的最大碳吸收是在7月,CLM5.0可以模拟出季节性NEE峰值时间,虽然模型模拟的NEE峰值有轻微时间滞后,但是也表明CLM可以扩展到区域分析,这与多模型平均的结果相一致[68]。
Role of remotely sensed leaf area index assimilation in eco-hydrologic processes in different ecosystems over East Asia with Community Land Model version 4.5: biogeochemistry
... Community Land Model version 5.0(CLM5.0)是Community Earth System Mode version 2.0的陆面模块最新版本[18].CLM是应用最广泛的陆面过程模式之一,并且有助于全球模式的比较和对于未来气候的预测[17,19].CLM可以模拟出北半球多年冻土区冻土的变化趋势[20]和未来变暖情景下的碳动态[21].目前最新版本的CLM5.0对于与植被相关的碳通量、水通量、能量通量和生物地球化学进行了改进[22].与过去版本的模型(即CLM4.0和CLM4.5)相比,CLM5.0在全球范围内都有所改善.已经在全球很多区域对CLM碳循环的模拟性能进行了评估,强迫数据、植被功能型、植物氮循环、微生物动态和积雪方案等的改进可以降低CLM碳循环模拟的偏差[21,23-27]. ...
The community earth system model version 2(CESM2)
1
2020
... Community Land Model version 5.0(CLM5.0)是Community Earth System Mode version 2.0的陆面模块最新版本[18].CLM是应用最广泛的陆面过程模式之一,并且有助于全球模式的比较和对于未来气候的预测[17,19].CLM可以模拟出北半球多年冻土区冻土的变化趋势[20]和未来变暖情景下的碳动态[21].目前最新版本的CLM5.0对于与植被相关的碳通量、水通量、能量通量和生物地球化学进行了改进[22].与过去版本的模型(即CLM4.0和CLM4.5)相比,CLM5.0在全球范围内都有所改善.已经在全球很多区域对CLM碳循环的模拟性能进行了评估,强迫数据、植被功能型、植物氮循环、微生物动态和积雪方案等的改进可以降低CLM碳循环模拟的偏差[21,23-27]. ...
Evaluation of terrestrial carbon cycle models for their response to climate variability and to CO2 trends
1
2013
... Community Land Model version 5.0(CLM5.0)是Community Earth System Mode version 2.0的陆面模块最新版本[18].CLM是应用最广泛的陆面过程模式之一,并且有助于全球模式的比较和对于未来气候的预测[17,19].CLM可以模拟出北半球多年冻土区冻土的变化趋势[20]和未来变暖情景下的碳动态[21].目前最新版本的CLM5.0对于与植被相关的碳通量、水通量、能量通量和生物地球化学进行了改进[22].与过去版本的模型(即CLM4.0和CLM4.5)相比,CLM5.0在全球范围内都有所改善.已经在全球很多区域对CLM碳循环的模拟性能进行了评估,强迫数据、植被功能型、植物氮循环、微生物动态和积雪方案等的改进可以降低CLM碳循环模拟的偏差[21,23-27]. ...
Simulation of present-day and future permafrost and seasonally frozen ground conditions in CCSM4
1
2012
... Community Land Model version 5.0(CLM5.0)是Community Earth System Mode version 2.0的陆面模块最新版本[18].CLM是应用最广泛的陆面过程模式之一,并且有助于全球模式的比较和对于未来气候的预测[17,19].CLM可以模拟出北半球多年冻土区冻土的变化趋势[20]和未来变暖情景下的碳动态[21].目前最新版本的CLM5.0对于与植被相关的碳通量、水通量、能量通量和生物地球化学进行了改进[22].与过去版本的模型(即CLM4.0和CLM4.5)相比,CLM5.0在全球范围内都有所改善.已经在全球很多区域对CLM碳循环的模拟性能进行了评估,强迫数据、植被功能型、植物氮循环、微生物动态和积雪方案等的改进可以降低CLM碳循环模拟的偏差[21,23-27]. ...
Divergent patterns of experimental and model-derived permafrost ecosystem carbon dynamics in response to Arctic warming
4
2018
... Community Land Model version 5.0(CLM5.0)是Community Earth System Mode version 2.0的陆面模块最新版本[18].CLM是应用最广泛的陆面过程模式之一,并且有助于全球模式的比较和对于未来气候的预测[17,19].CLM可以模拟出北半球多年冻土区冻土的变化趋势[20]和未来变暖情景下的碳动态[21].目前最新版本的CLM5.0对于与植被相关的碳通量、水通量、能量通量和生物地球化学进行了改进[22].与过去版本的模型(即CLM4.0和CLM4.5)相比,CLM5.0在全球范围内都有所改善.已经在全球很多区域对CLM碳循环的模拟性能进行了评估,强迫数据、植被功能型、植物氮循环、微生物动态和积雪方案等的改进可以降低CLM碳循环模拟的偏差[21,23-27]. ...
The Community Land Model version 5: description of new features, benchmarking, and impact of forcing uncertainty
5
2019
... Community Land Model version 5.0(CLM5.0)是Community Earth System Mode version 2.0的陆面模块最新版本[18].CLM是应用最广泛的陆面过程模式之一,并且有助于全球模式的比较和对于未来气候的预测[17,19].CLM可以模拟出北半球多年冻土区冻土的变化趋势[20]和未来变暖情景下的碳动态[21].目前最新版本的CLM5.0对于与植被相关的碳通量、水通量、能量通量和生物地球化学进行了改进[22].与过去版本的模型(即CLM4.0和CLM4.5)相比,CLM5.0在全球范围内都有所改善.已经在全球很多区域对CLM碳循环的模拟性能进行了评估,强迫数据、植被功能型、植物氮循环、微生物动态和积雪方案等的改进可以降低CLM碳循环模拟的偏差[21,23-27]. ...
Can land surface models capture the observed soil moisture control of water and carbon fluxes in temperate-to-boreal forests?
1
2021
... Community Land Model version 5.0(CLM5.0)是Community Earth System Mode version 2.0的陆面模块最新版本[18].CLM是应用最广泛的陆面过程模式之一,并且有助于全球模式的比较和对于未来气候的预测[17,19].CLM可以模拟出北半球多年冻土区冻土的变化趋势[20]和未来变暖情景下的碳动态[21].目前最新版本的CLM5.0对于与植被相关的碳通量、水通量、能量通量和生物地球化学进行了改进[22].与过去版本的模型(即CLM4.0和CLM4.5)相比,CLM5.0在全球范围内都有所改善.已经在全球很多区域对CLM碳循环的模拟性能进行了评估,强迫数据、植被功能型、植物氮循环、微生物动态和积雪方案等的改进可以降低CLM碳循环模拟的偏差[21,23-27]. ...
Evaluation and uncertainty analysis of regional-scale CLM4.5 net carbon flux estimates
0
2018
Beyond static benchmarking: using experimental manipulations to evaluate land model assumptions
0
2019
Evaluation of atmospheric and terrestrial effects in the carbon cycle for forest and grassland ecosystems using a remote sensing and modeling approach
Addressing biases in Arctic-boreal carbon cycling in the Community Land Model Version 5
3
2021
... Community Land Model version 5.0(CLM5.0)是Community Earth System Mode version 2.0的陆面模块最新版本[18].CLM是应用最广泛的陆面过程模式之一,并且有助于全球模式的比较和对于未来气候的预测[17,19].CLM可以模拟出北半球多年冻土区冻土的变化趋势[20]和未来变暖情景下的碳动态[21].目前最新版本的CLM5.0对于与植被相关的碳通量、水通量、能量通量和生物地球化学进行了改进[22].与过去版本的模型(即CLM4.0和CLM4.5)相比,CLM5.0在全球范围内都有所改善.已经在全球很多区域对CLM碳循环的模拟性能进行了评估,强迫数据、植被功能型、植物氮循环、微生物动态和积雪方案等的改进可以降低CLM碳循环模拟的偏差[21,23-27]. ...
Simulated and observed surface soil temperature [The left panels show time series of CLM simulations (red lines) and observed surface soil temperature (black lines); the right panels show scatter plots of CLM simulations and observed surface soil temperature, and the red lines are fitted lines. In this study, shading indicates the thawing period (The thaw start-date, thaw end-date, and thaw duration were calculated by determining daily soil temperature at a depth of 2 cm was above or below 0 ℃<sup>[<xref ref-type="bibr" rid="R47">47</xref>]</sup>). The thawing period is from 151 to 264 (day of year, the same below) in 2004, 161 to 267 in 2005, 144 to 285 in 2006 at US_Atq site; from 135 to 277 in 2011, 133 to 279 in 2012, 150 to 264 in 2013, 132 to 270 in 2014 at US_Prr site]Fig. 2
各站点模拟表层土壤温度的评价指标 ...
... [47]). The thawing period is from 151 to 264 (day of year, the same below) in 2004, 161 to 267 in 2005, 144 to 285 in 2006 at US_Atq site; from 135 to 277 in 2011, 133 to 279 in 2012, 150 to 264 in 2013, 132 to 270 in 2014 at US_Prr site]Fig. 2
各站点模拟表层土壤温度的评价指标 ...
Soil thermal conductivity and its influencing factors at the Tanggula permafrost region on the Qinghai-Tibet Plateau
Role of remotely sensed leaf area index assimilation in eco-hydrologic processes in different ecosystems over East Asia with Community Land Model version 4.5: biogeochemistry
Rapidly changing high-latitude seasonality: implications for the 21st century carbon cycle in Alaska
1
2022
... 在当前的气候条件下,在站点尺度,CLM5.0对于阿拉斯加NEE的模拟表现出很强的碳吸收能力,同时也可以模拟出季节性NEE峰值时间.这与ecosys模型模拟结果以及基于观测的产品相一致,但是对于碳循环的季节性的捕捉还有很大的不确定性[67].Fisher等[68]用10个North American Carbon Program (NACP)站点集成模型比较分析了阿拉斯加North Slope苔原区域(Atqasuk和Barrow站点)的GPP和NEE.与本研究相比,在US_Atq站点,CLM5.0对于NEE模拟的R2=0.407,这比10个NACP站点集成模型的模拟结果更好(R2=0.13).在US_Atq站点观测到的最大的碳吸收通常是在6月,而CLM5.0模拟的最大碳吸收是在7月,CLM5.0可以模拟出季节性NEE峰值时间,虽然模型模拟的NEE峰值有轻微时间滞后,但是也表明CLM可以扩展到区域分析,这与多模型平均的结果相一致[68]. ...
Carbon cycle uncertainty in the Alaskan Arctic
2
2014
... 在当前的气候条件下,在站点尺度,CLM5.0对于阿拉斯加NEE的模拟表现出很强的碳吸收能力,同时也可以模拟出季节性NEE峰值时间.这与ecosys模型模拟结果以及基于观测的产品相一致,但是对于碳循环的季节性的捕捉还有很大的不确定性[67].Fisher等[68]用10个North American Carbon Program (NACP)站点集成模型比较分析了阿拉斯加North Slope苔原区域(Atqasuk和Barrow站点)的GPP和NEE.与本研究相比,在US_Atq站点,CLM5.0对于NEE模拟的R2=0.407,这比10个NACP站点集成模型的模拟结果更好(R2=0.13).在US_Atq站点观测到的最大的碳吸收通常是在6月,而CLM5.0模拟的最大碳吸收是在7月,CLM5.0可以模拟出季节性NEE峰值时间,虽然模型模拟的NEE峰值有轻微时间滞后,但是也表明CLM可以扩展到区域分析,这与多模型平均的结果相一致[68]. ...


 甘公网安备 62010202000676号