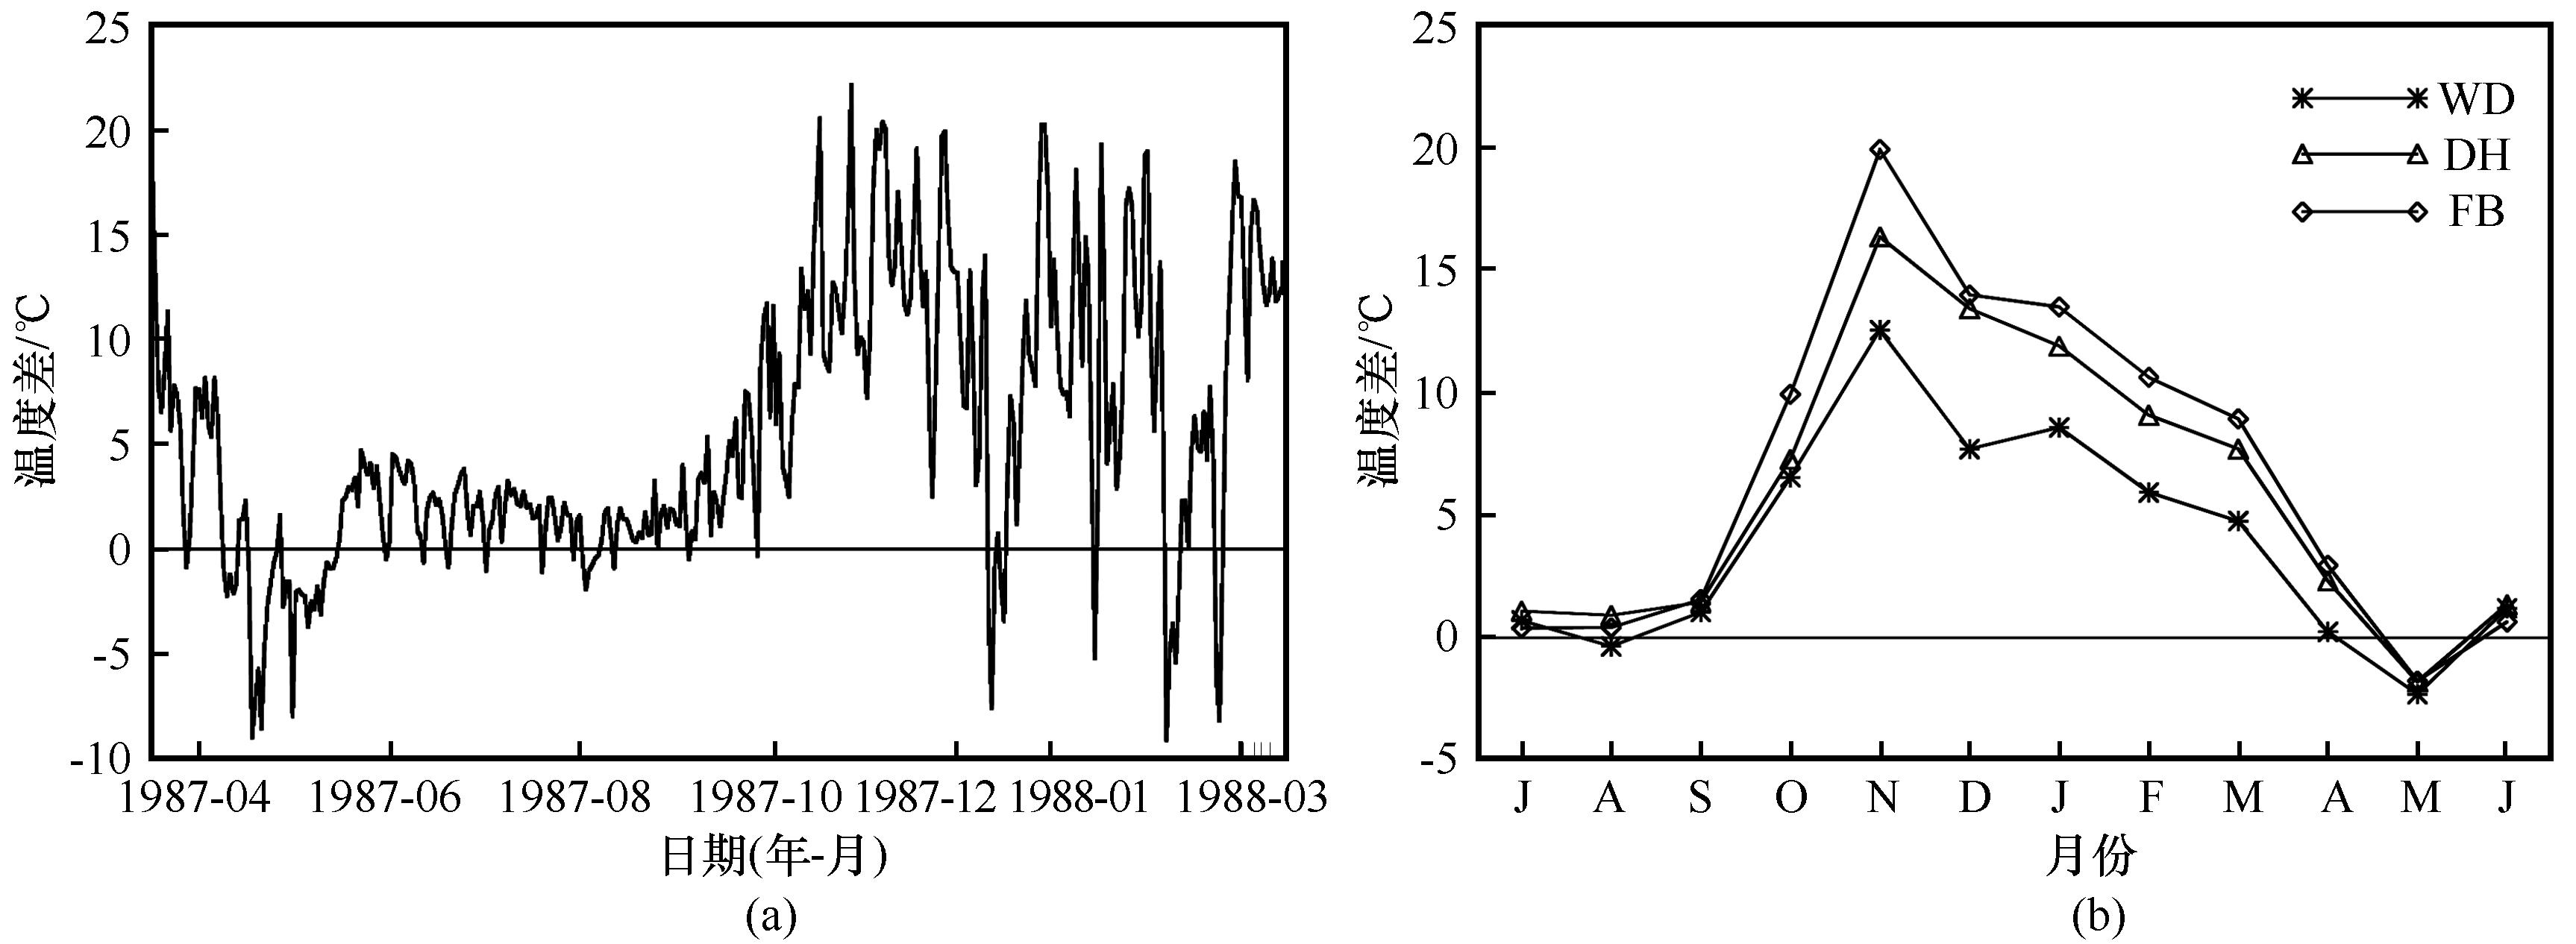
Fig. 6 1930—2000 seasonal freeze depth changes (blue line, closed circles) across the Eurasian high latitudes, including ±1 standard deviation (between thin blue lines)[42] and the results of Frauenfeld et al[38] (gray line) (a); 1951—2012 seasonal freeze depth changes (red line), including ±1 standard deviation (gray shading), 7-year smoothing (green), and linear trend (1967—2012)[43] (b)
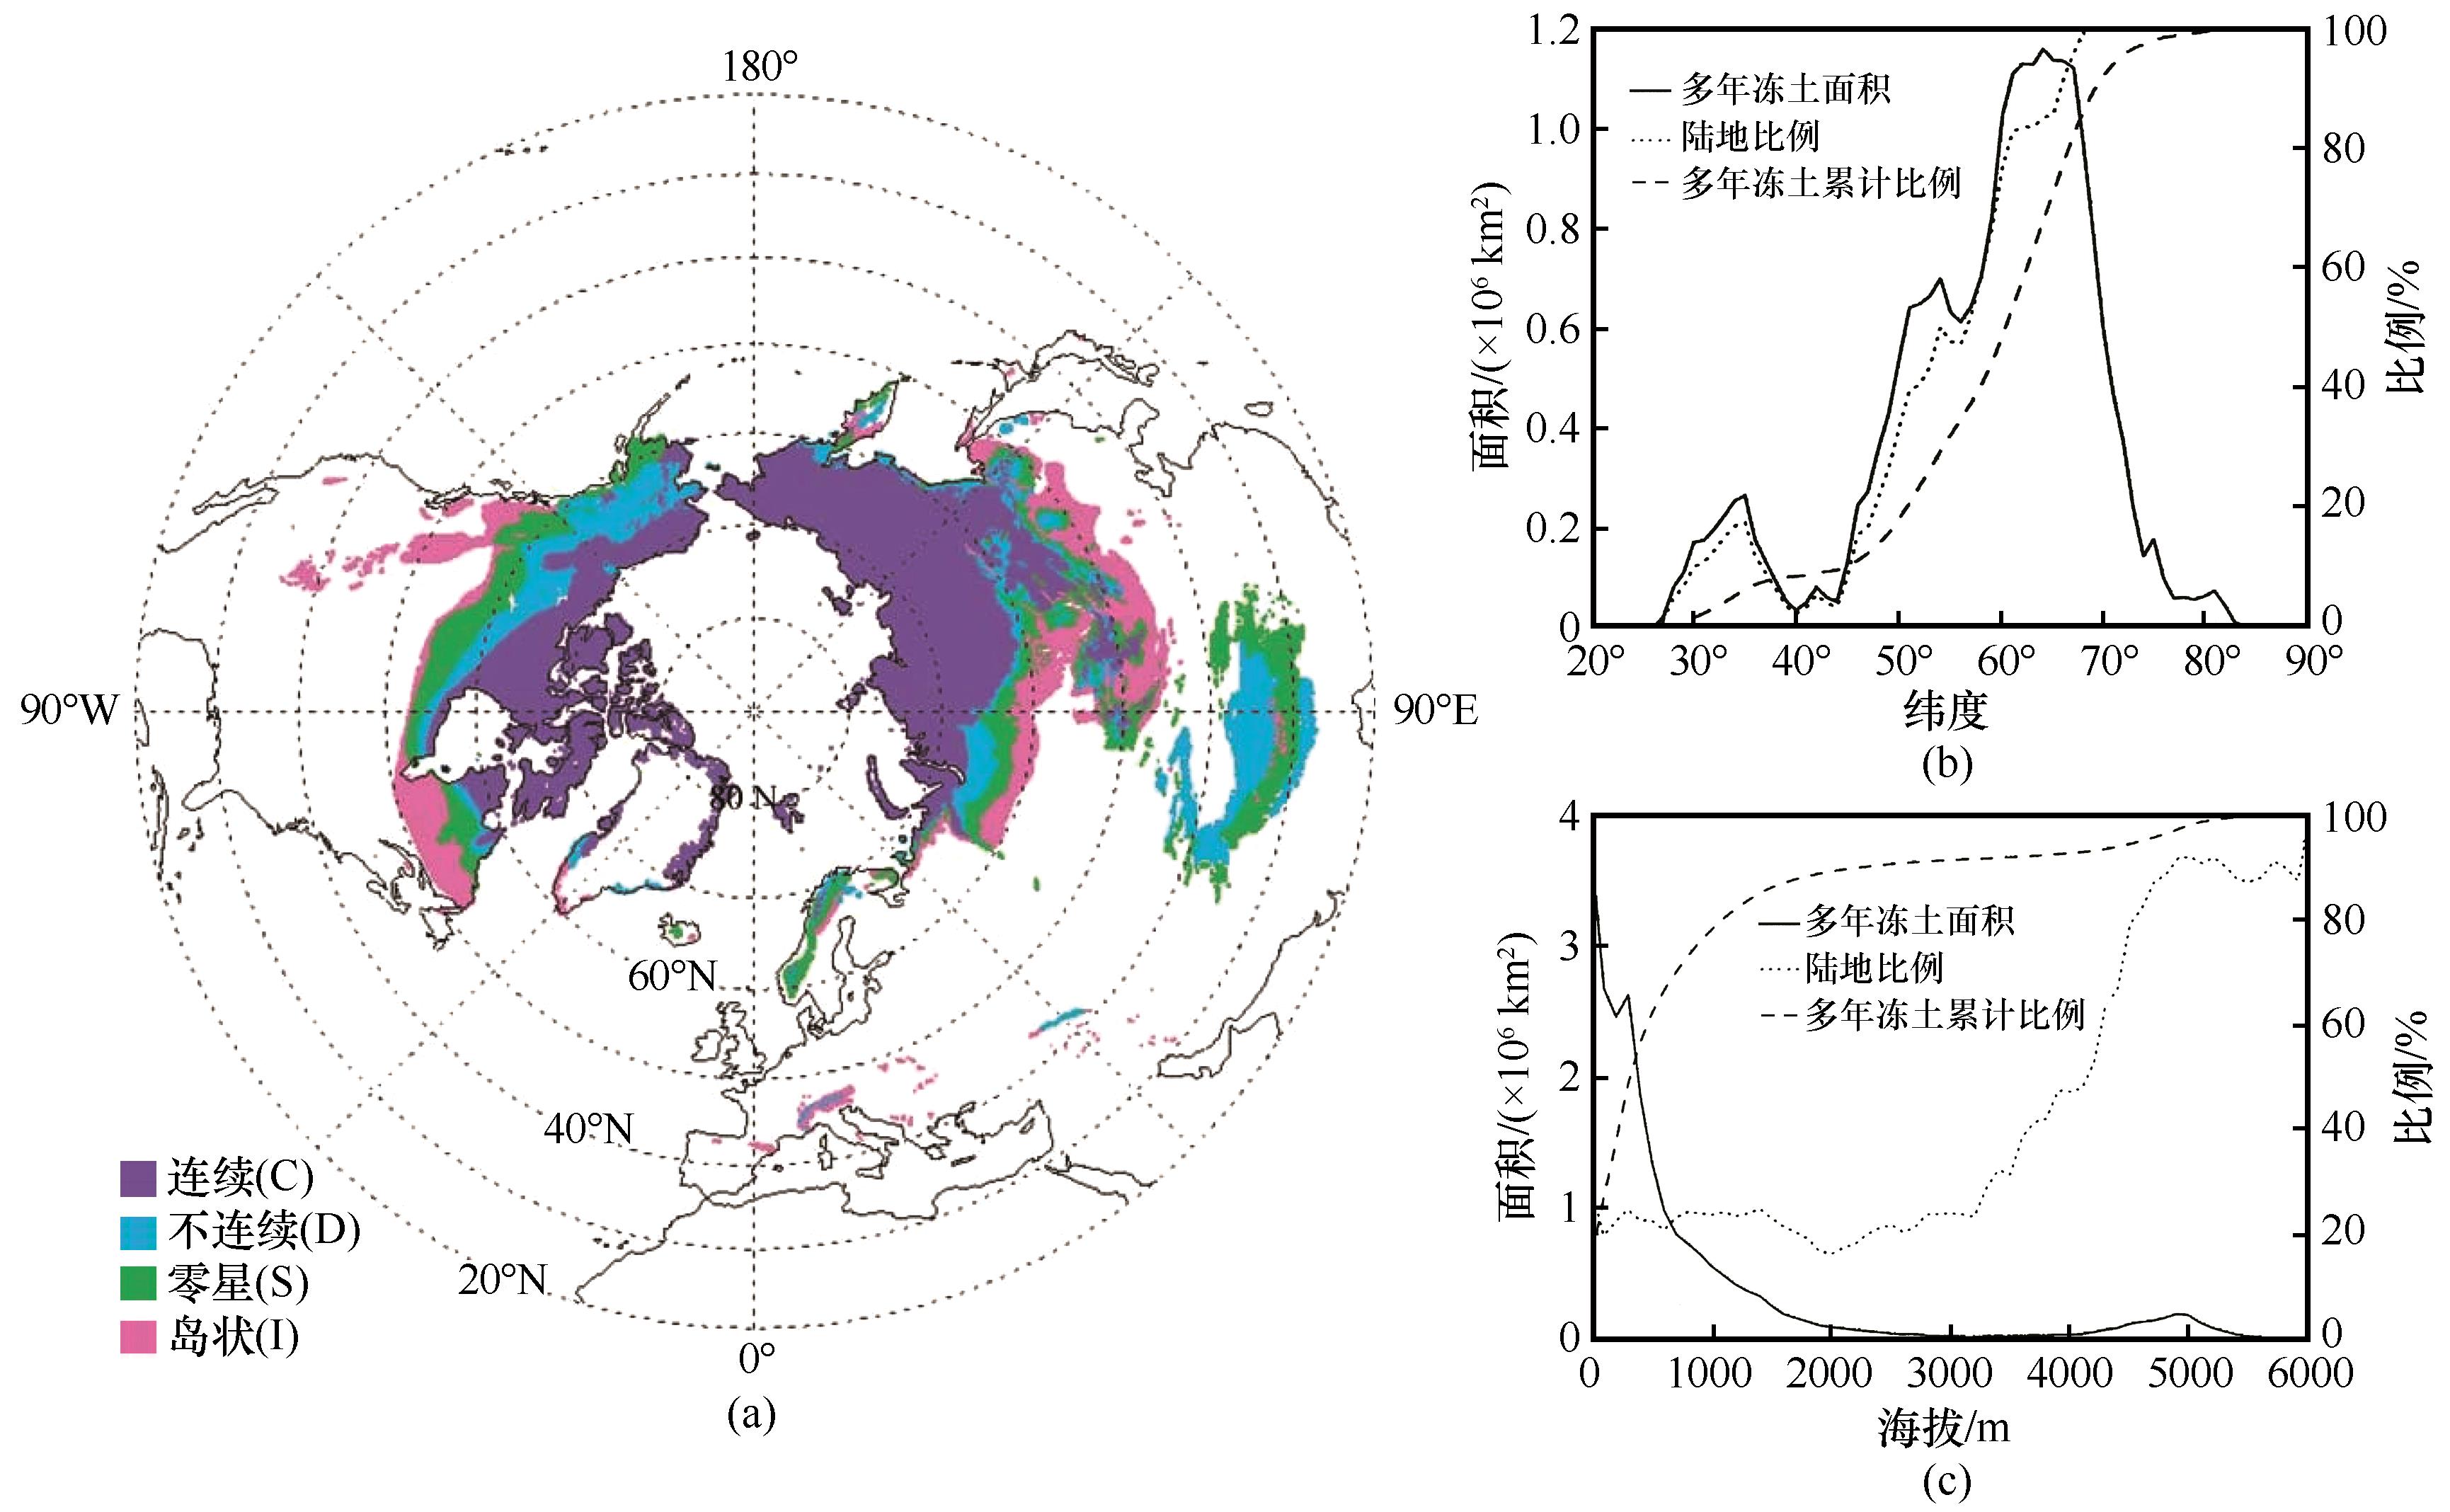
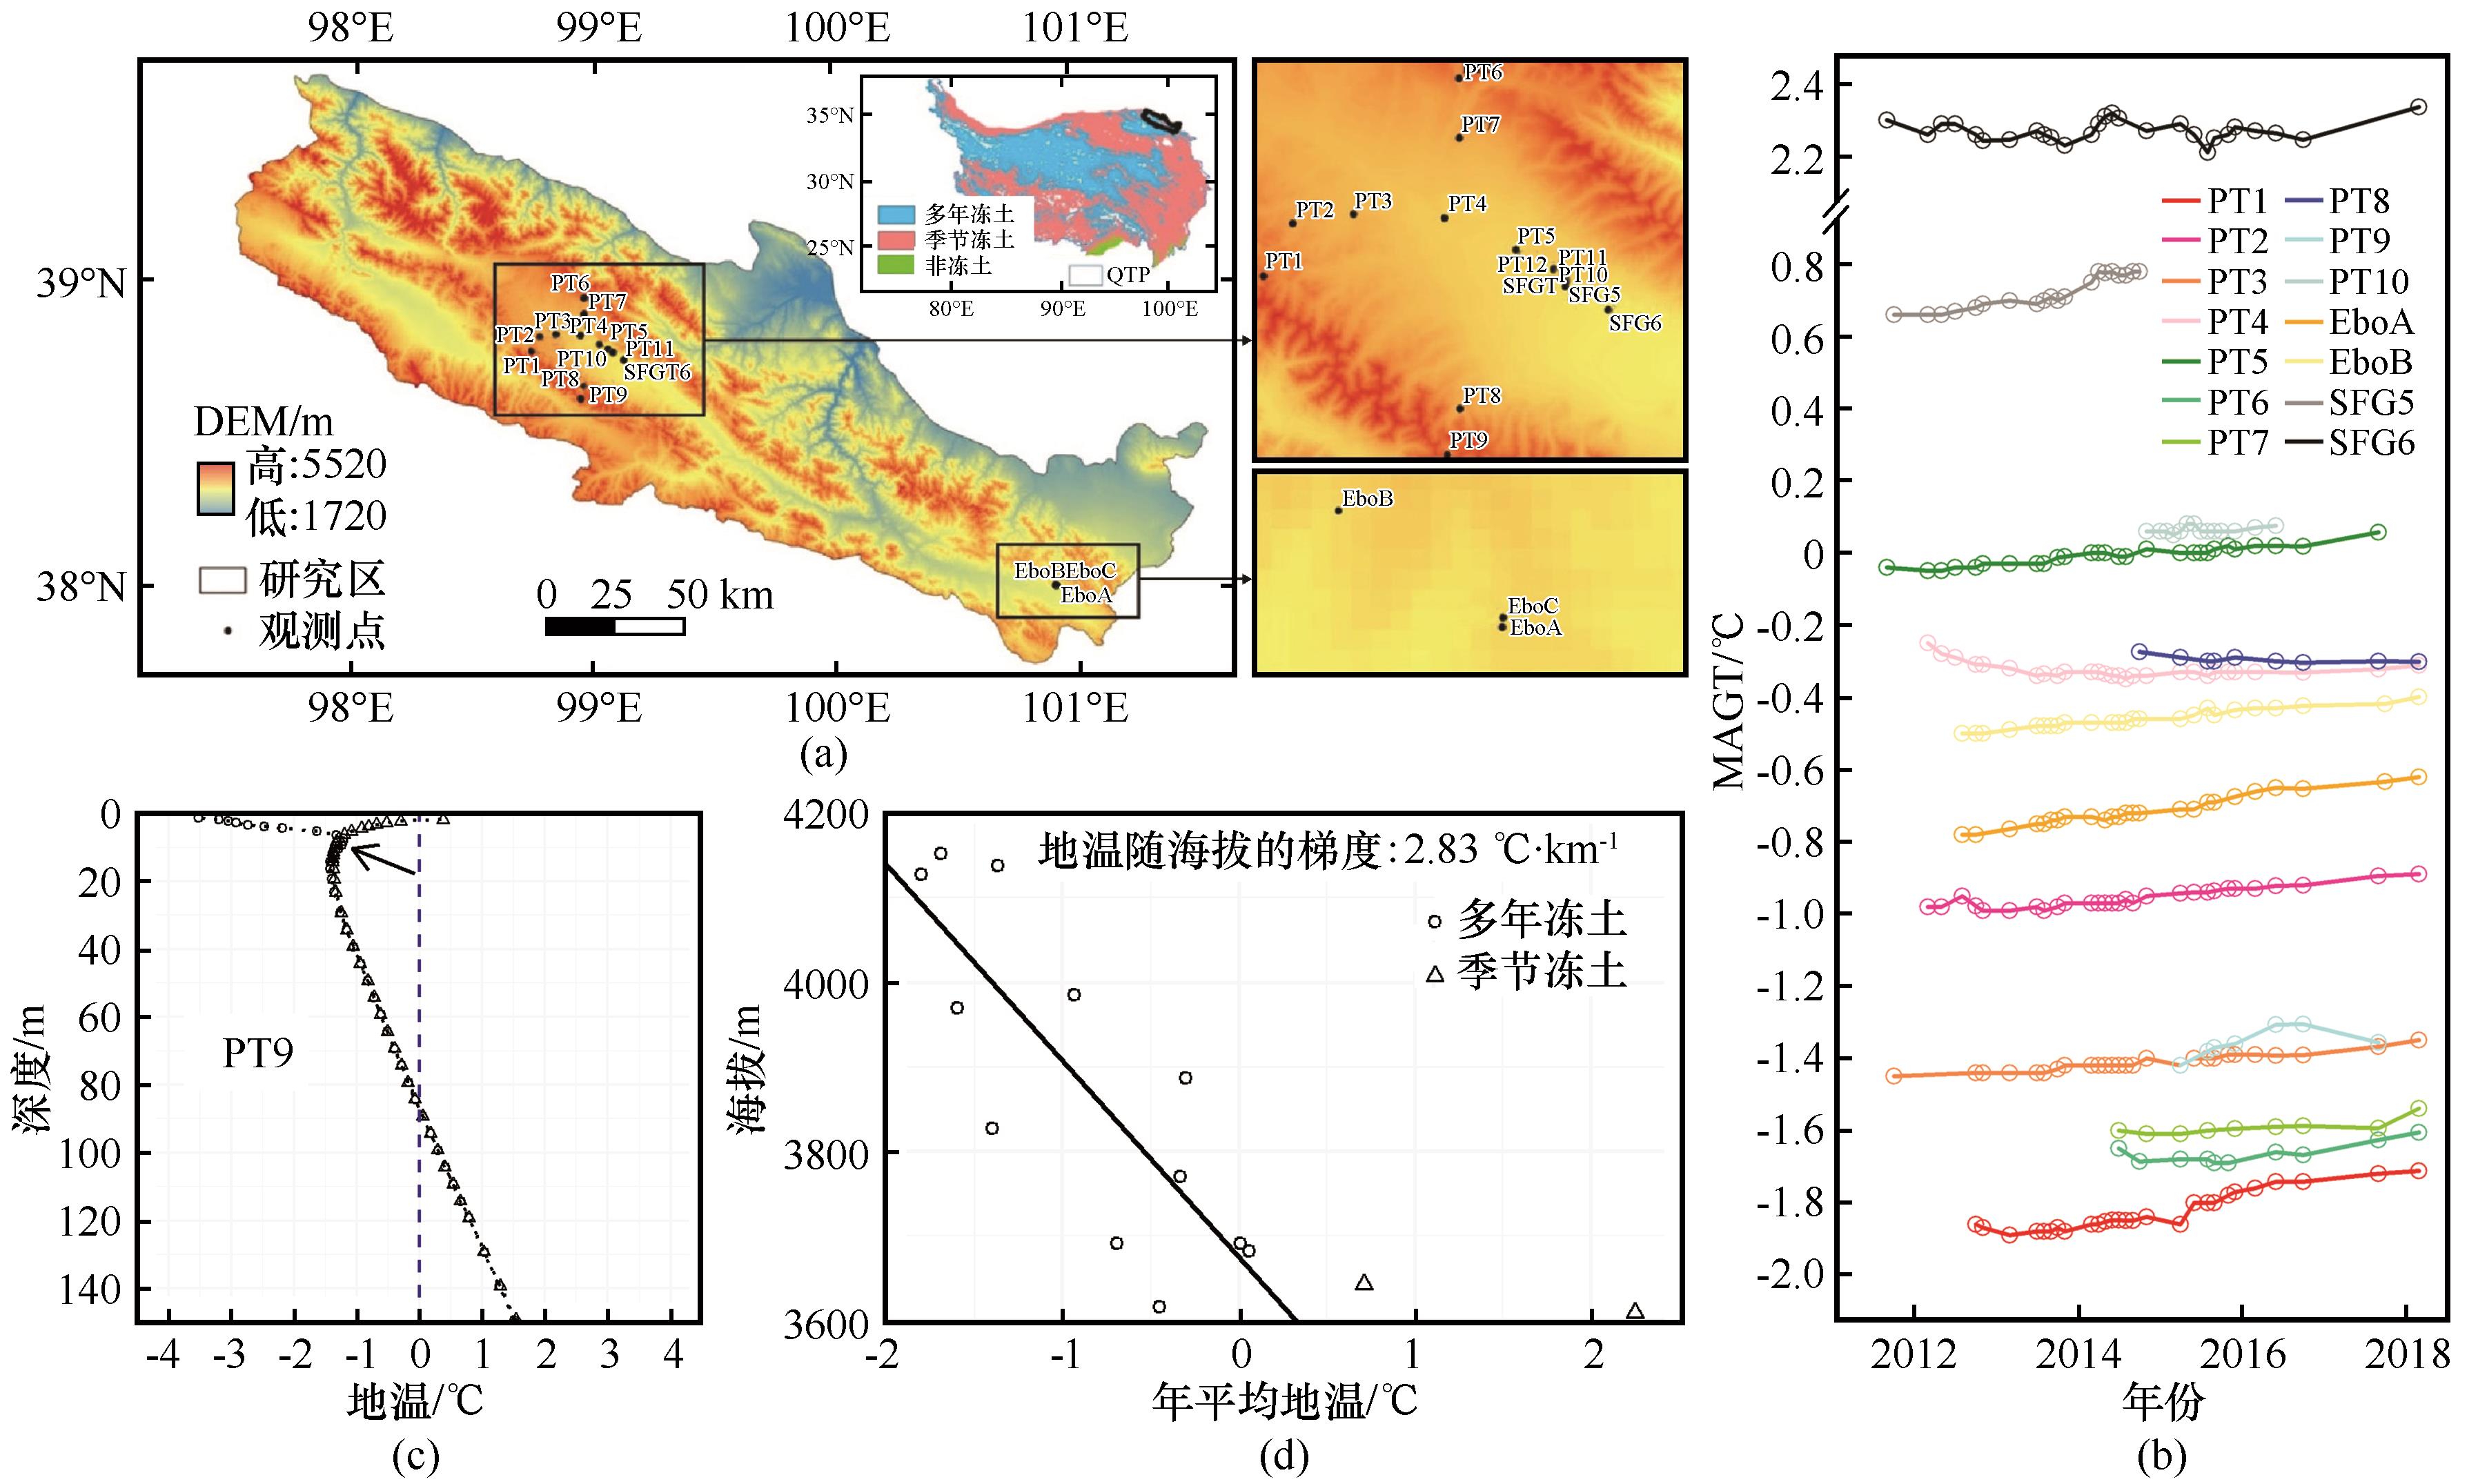
Other figure/table from this article