×
模态框(Modal)标题
在这里添加一些文本
Close
Close
Submit
Cancel
Confirm
×
模态框(Modal)标题
×
ISSN 1000-0240
CN 62-1072/P
RSS
|
Email Alert
Toggle navigation
Home
About Journal
Editorial Board
Authors
Publication Ethics
Journal Online
Current Issue
Online First
Archive
Most Read
Most Download
Most Cited
Subscription
Advertisement
Contact Us
中文
Figure/Table detail
The warming cold regions: Professor Zhang Tingjun’s significant contributions during his 40-year scientific career
Kang WANG, Cuicui MU, Xiaoqing PENG, Lei ZHENG, Bin CAO, Lang JIA, Hailong HE, Yang ZHU, Mingzhu WANG, Jinlong XU
Journal of Glaciology and Geocryology
, 2023, 45(
2
): 291-305. DOI:
10.7522/j.issn.1000-0240.2023.0022
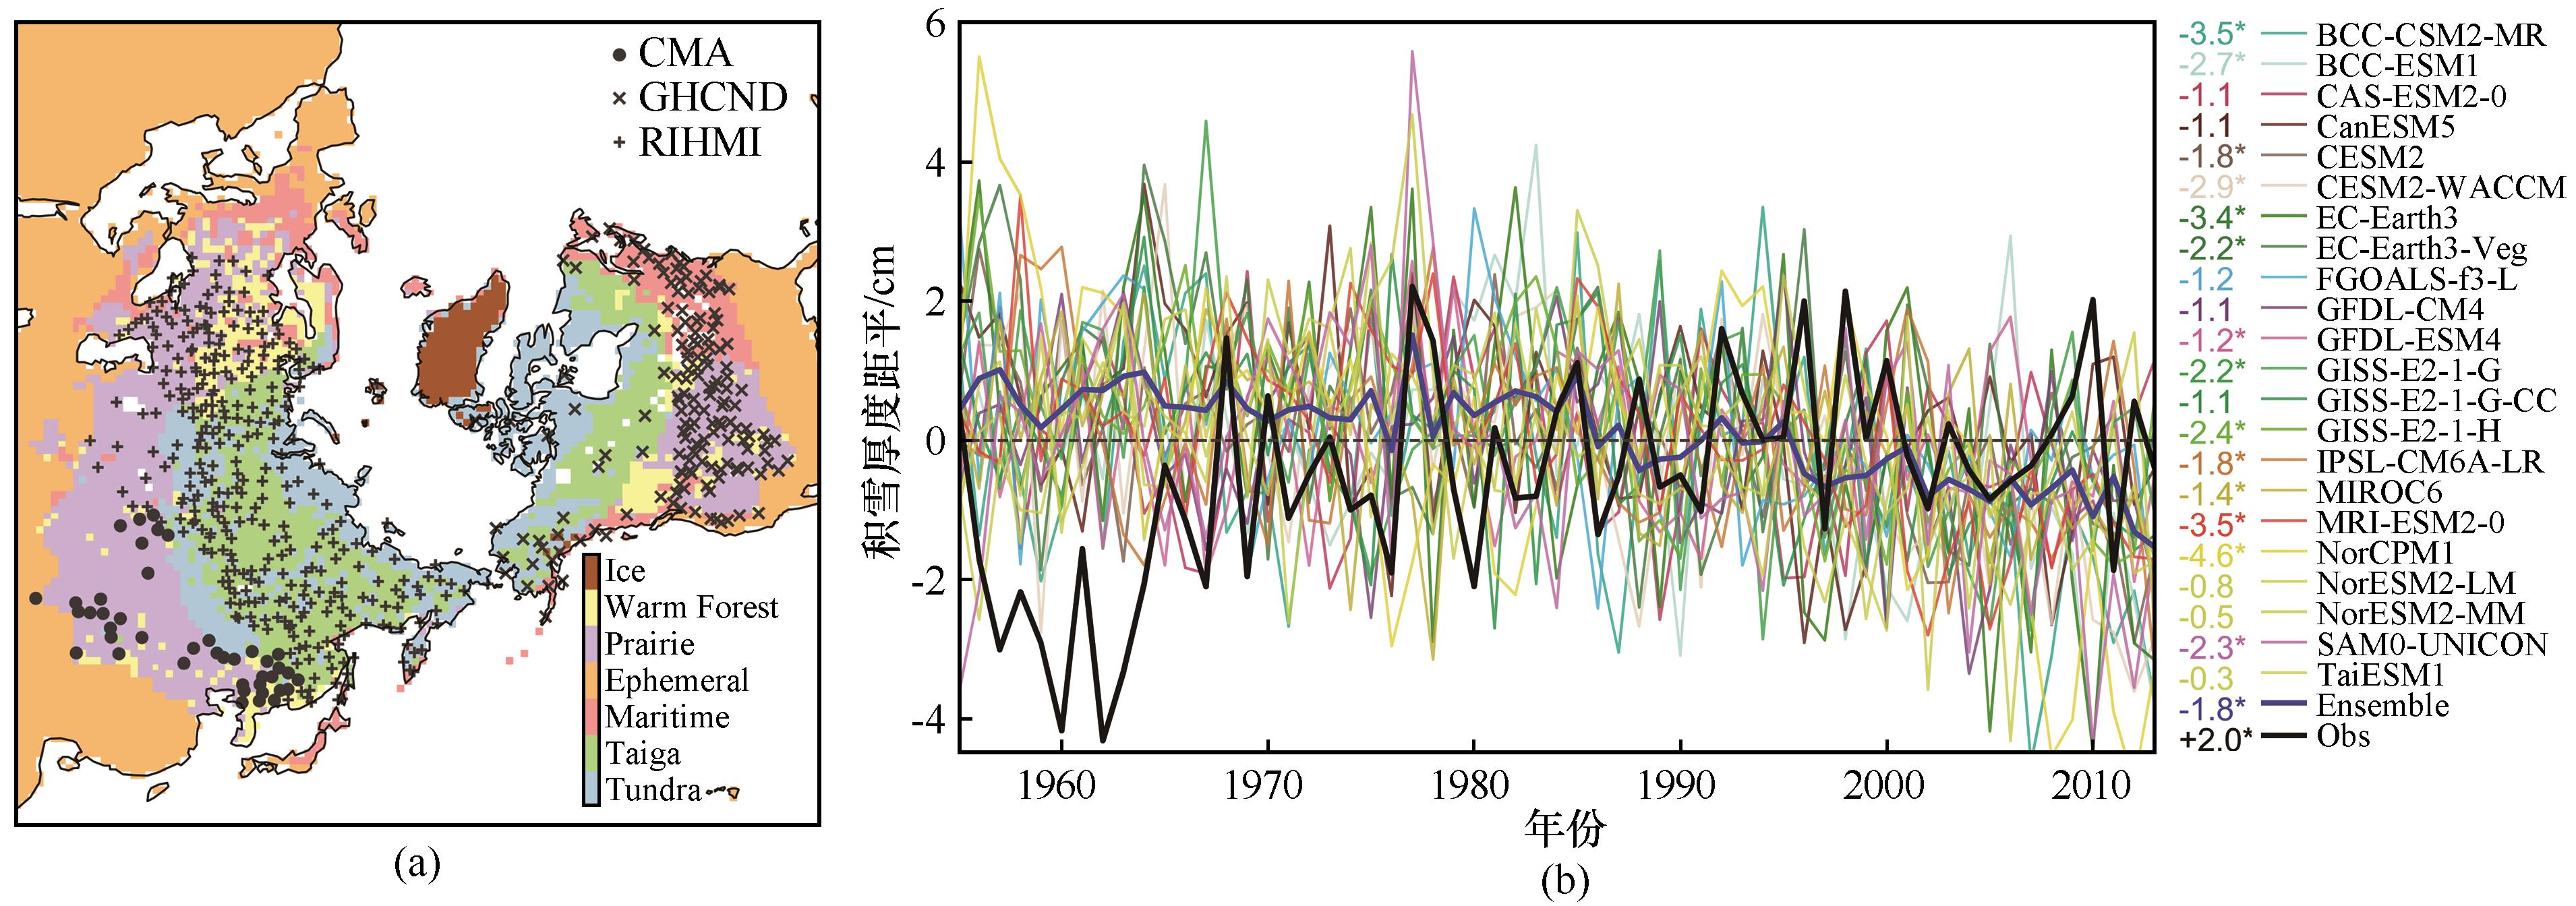
Fig. 7
Map of snow observation stations across the Northern Hemisphere
[
45
]
(a); observed and simulated changes in snow depth that were estimated by the EEMD method
[
45
]
(b)
Other figure/table from this article
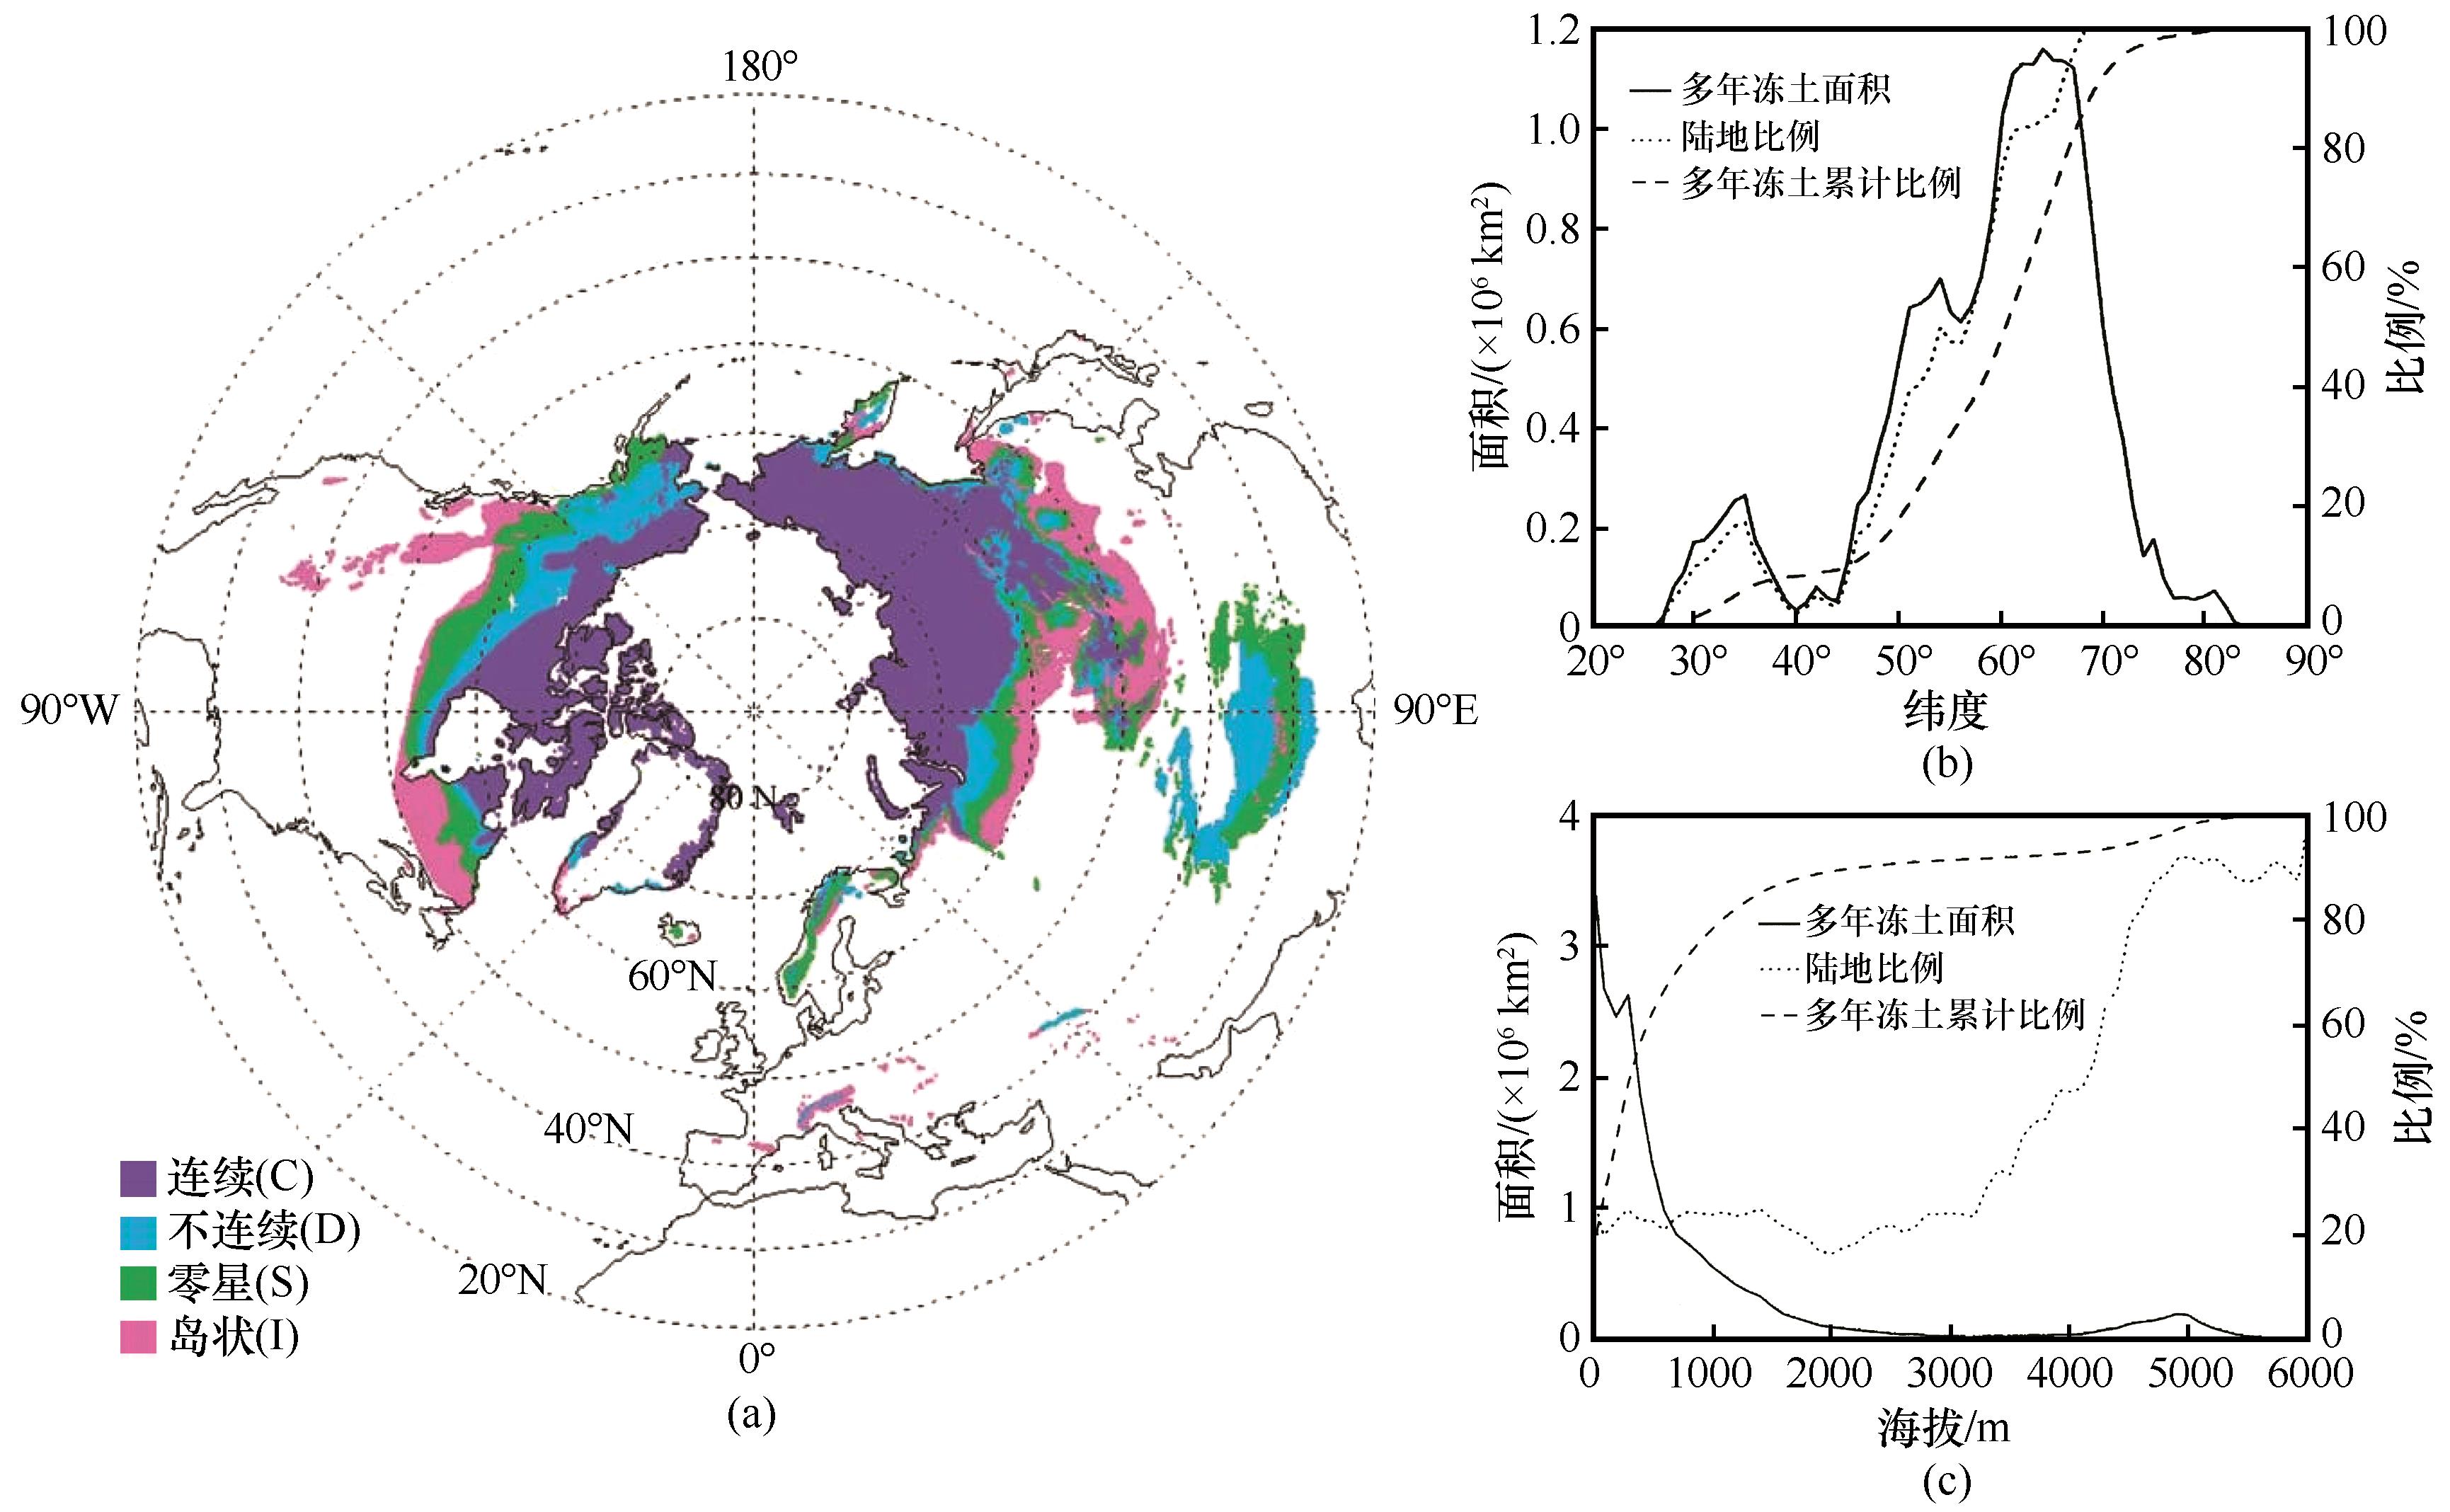
Fig. 1
Distribution of permafrost in the Northern Hemisphere (based on the EASE-grid)
[
2
]
(a); variations of the permafrost area (solid line) and its fraction (short dashed line) of the land surface at each latitude, and the accumulated fraction with latitudes (long dashed line) in the Northern Hemisphere
[
2
]
(b); (c) as (b) but for elevation bands
[
2
]
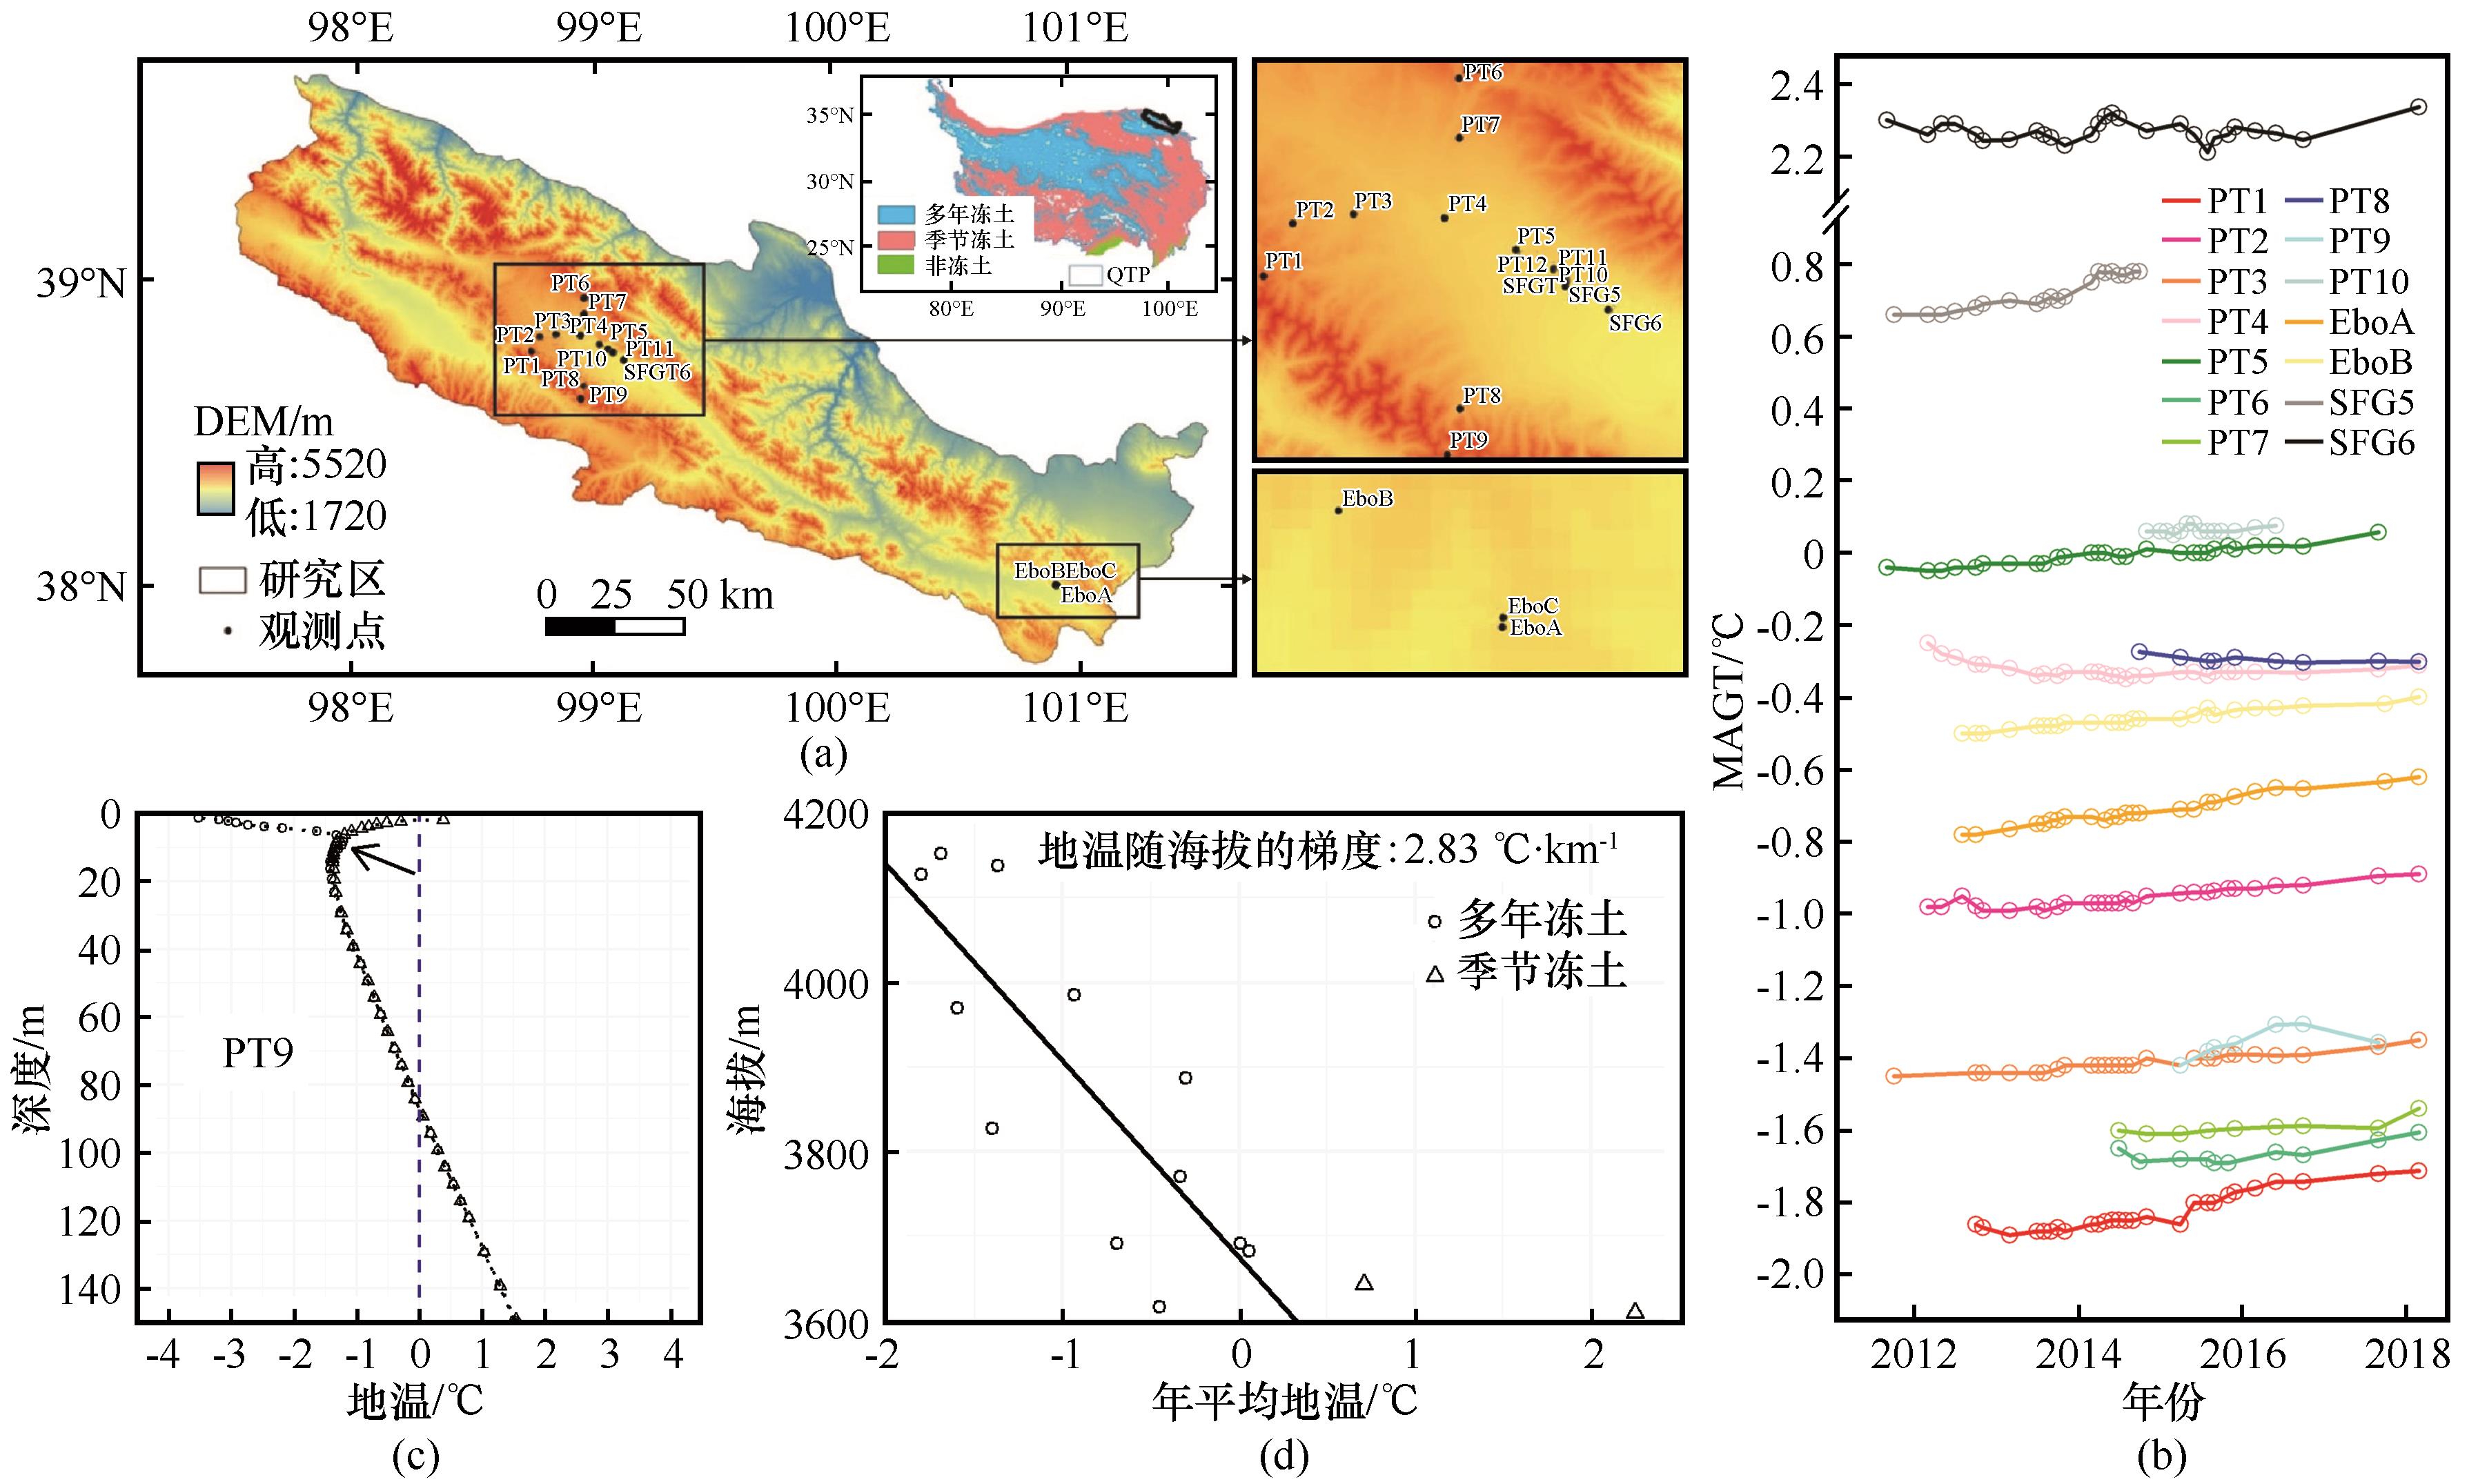
Fig. 2
Observational sits in the upper reaches of the Heihe River Basin
[
17
]
(a); observed changes in ground temperature at each borehole, including seasonally frozen ground sites
[
17
]
(b); selected temperature profile, observed at PT9 borehole
[
17
]
(c); observed variations of ground temperature with elevation
[
17
]
(d)
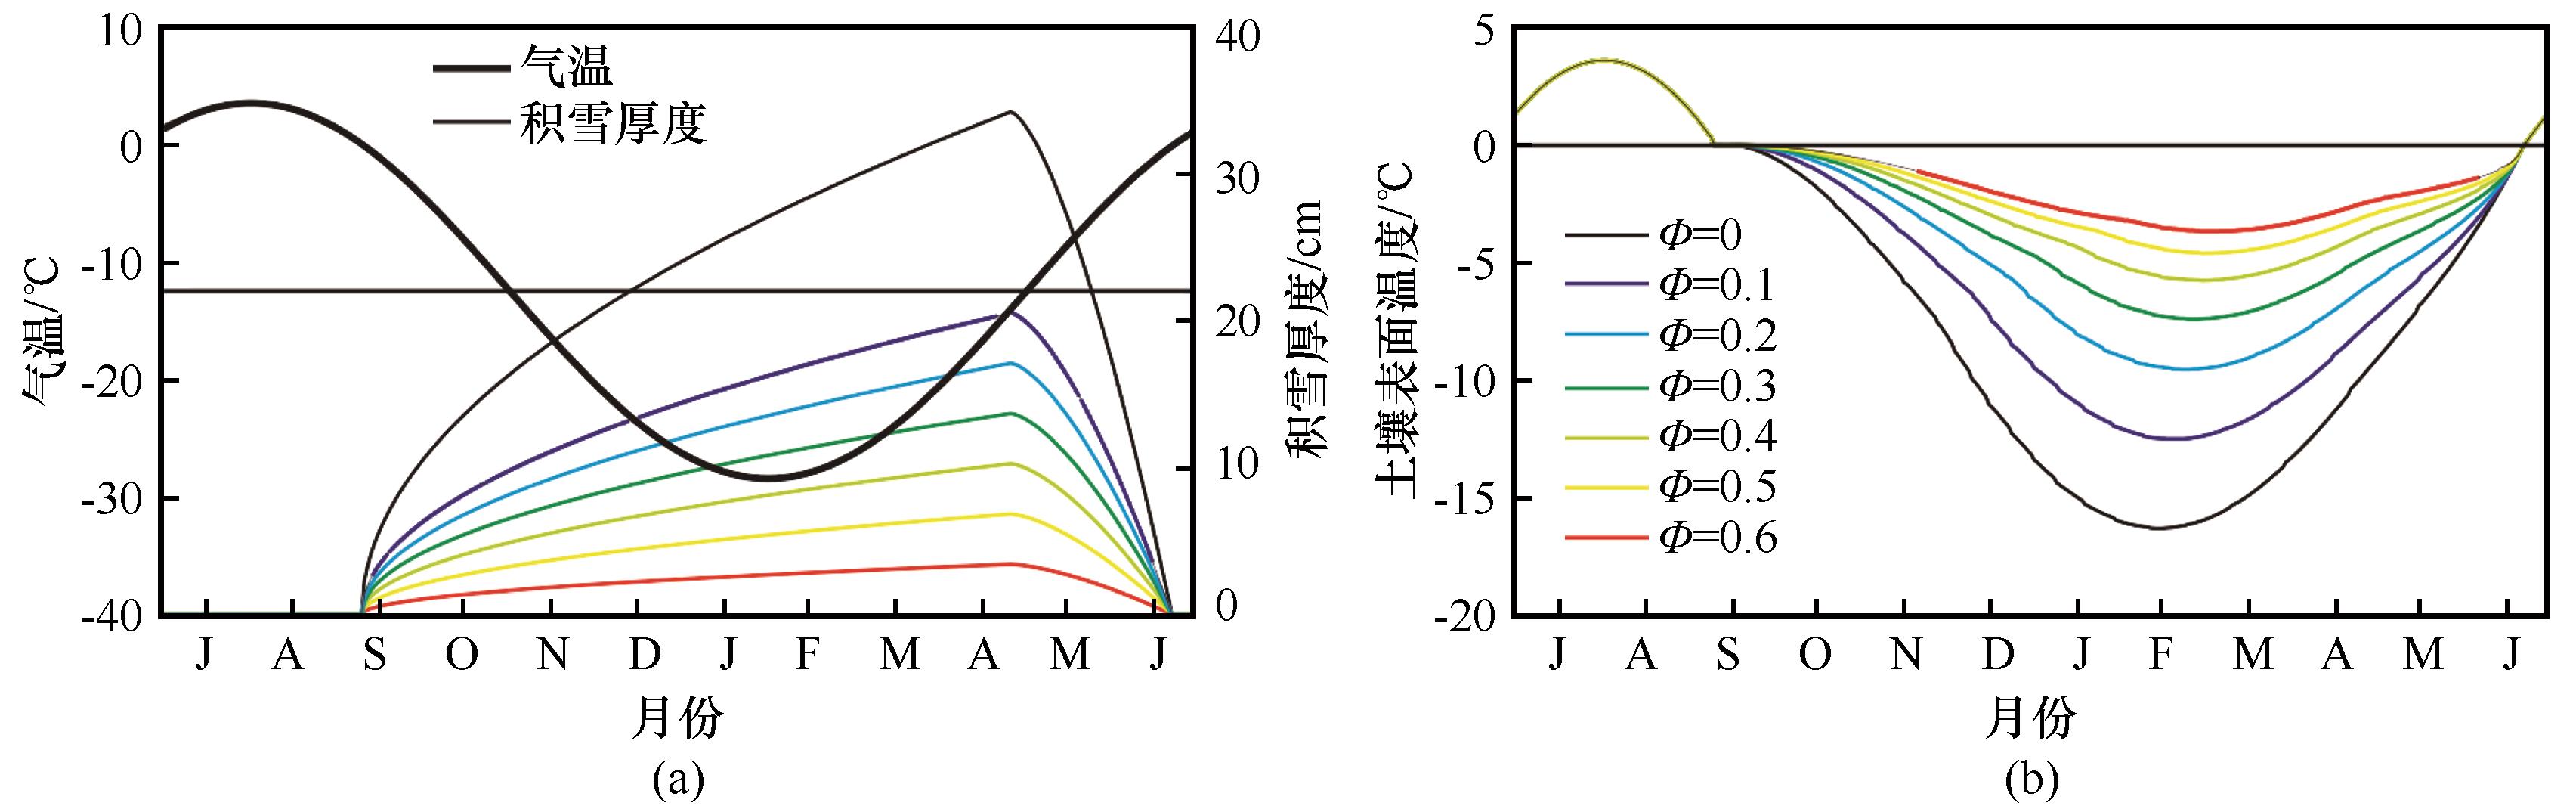
Fig. 3
Impact of changes in the depth hoar fraction of the seasonal snow cover on soil surface temperature
[
22
]
: air temperature, mean annual air temperature (solid horizontal line), and snow thickness in the Alaskan Arctic (a); simulated soil surface temperature with variations of the depth hoar fraction in the seasonal snow cover (b); line types and colors in (a) and (b) are consistent, the ? is depth hoar fraction
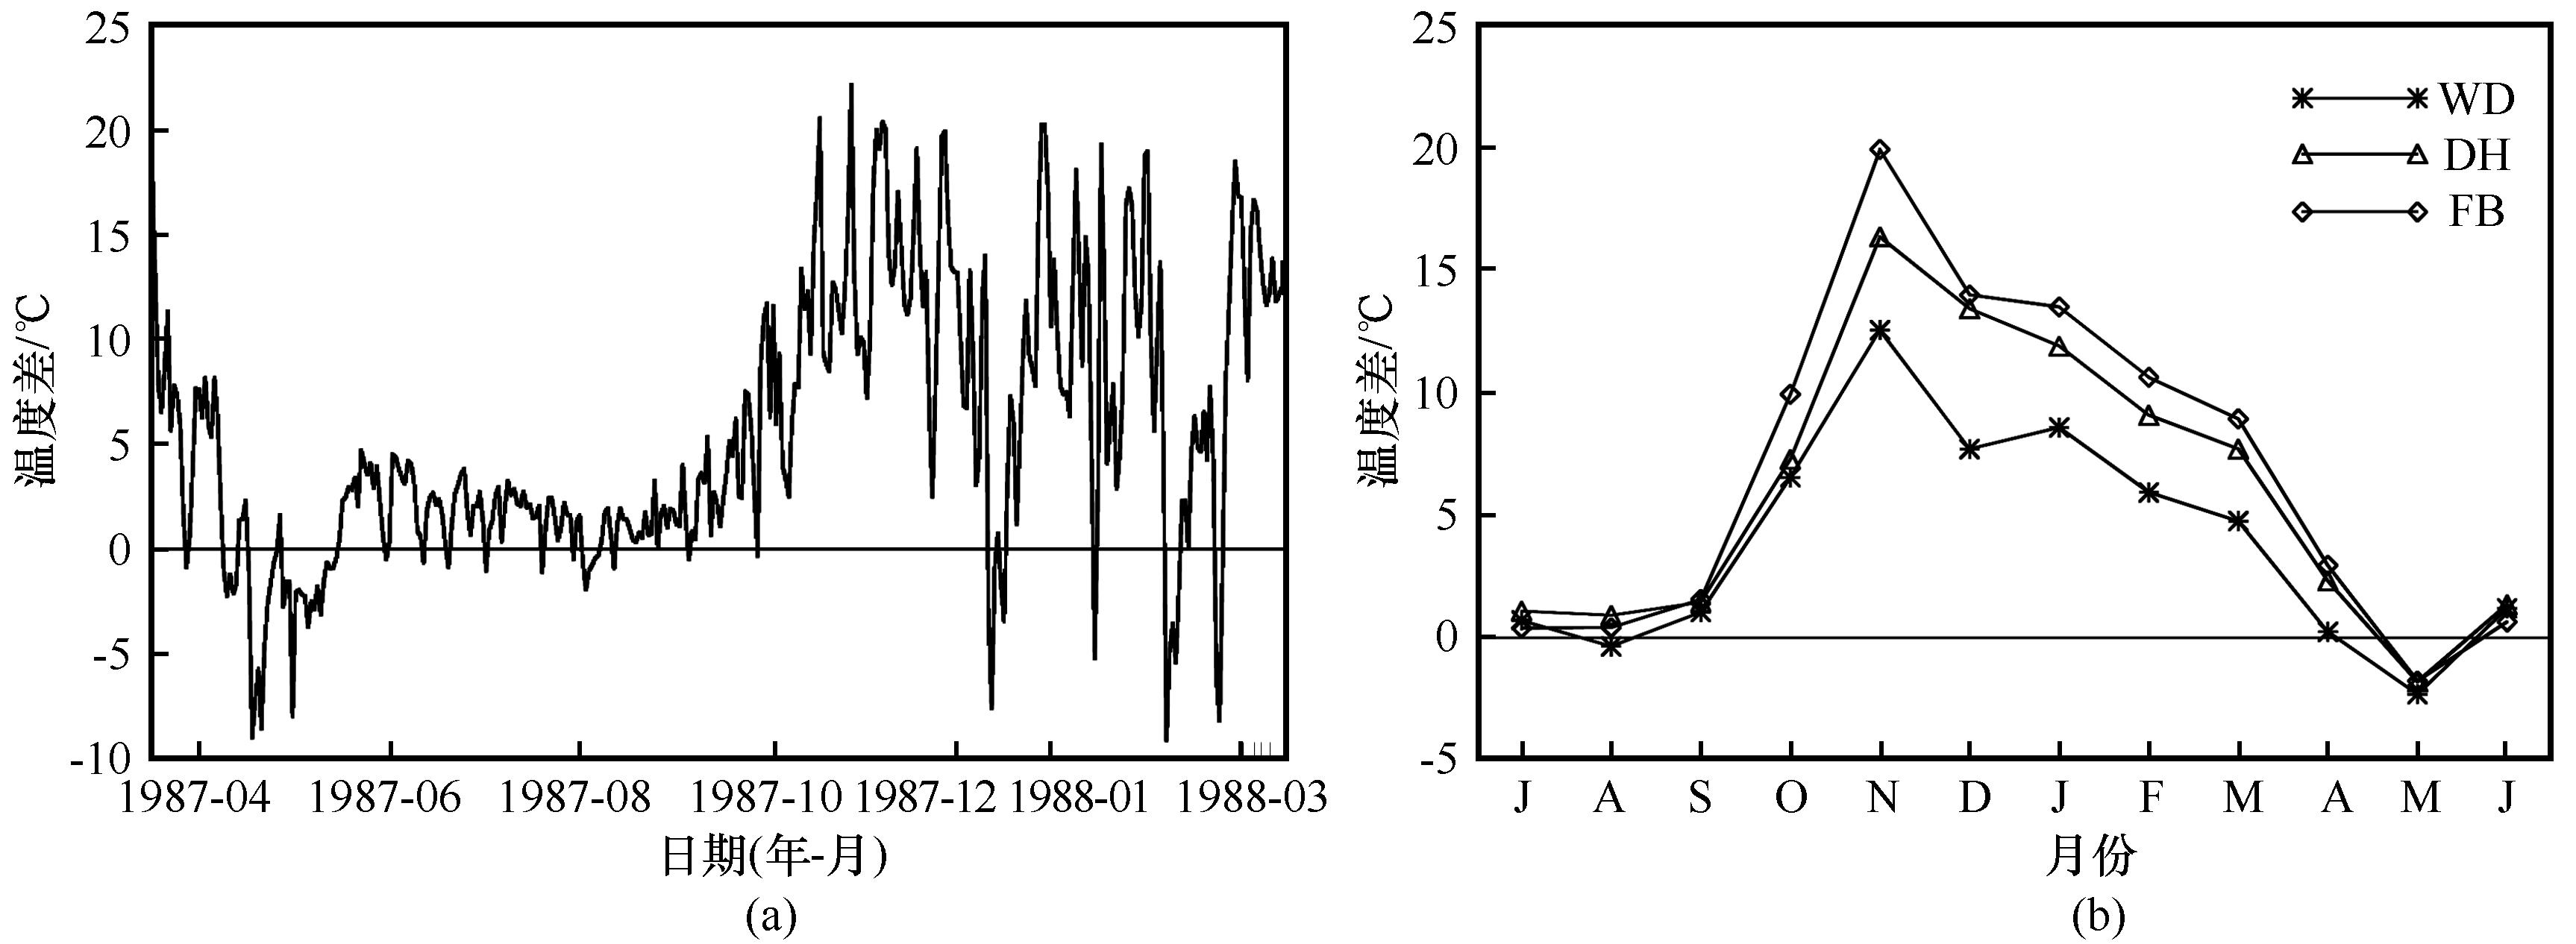
Fig. 4
Temperature difference between the mean daily ground surface and air temperatures
[
18
]
for the period from 1 April 1987 through 31 March 1988 at Franklin Bluffs on the north slope of Alaska (a); between mean monthly ground surface and air temperatures for the period from 1987 through 1992 at West Dock (WD), Deadhorse (DH) and Franklin Bluffs (FB) on the north slope of Alaska (b)
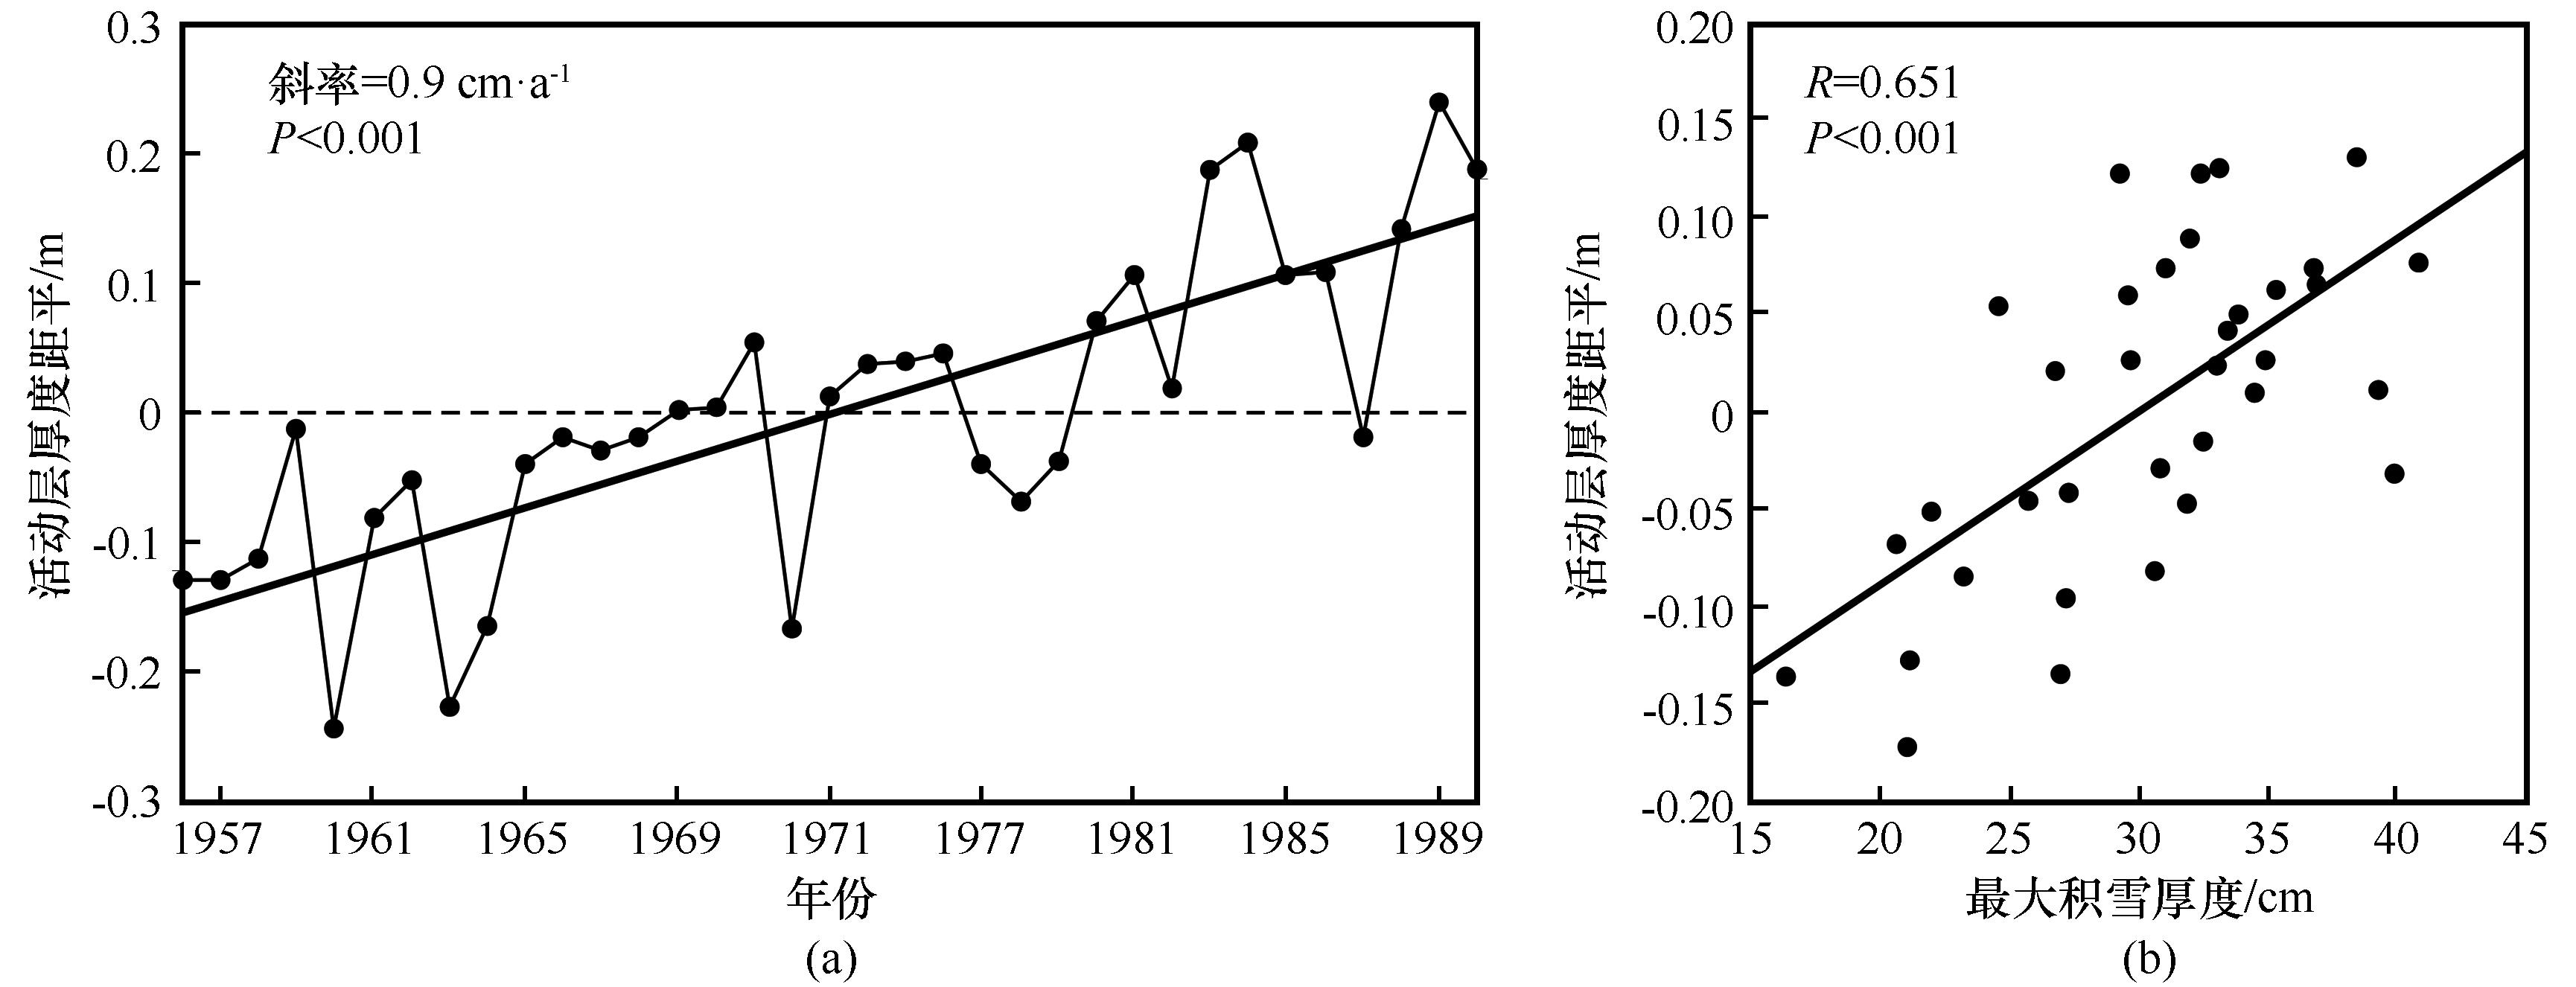
Fig. 5
Time series of active layer thickness departures from 17 stations in the Lena basin and linear trend during 1956—1990
[
39
]
(a), Correlation between active layer thickness departures and annual maximum snow depth in the Lena basin
[
39
]
(b)
Fig. 6
1930—2000 seasonal freeze depth changes (blue line, closed circles) across the Eurasian high latitudes, including ±1 standard deviation (between thin blue lines)
[
42
]
and the results of Frauenfeld et al
[
38
]
(gray line) (a); 1951—2012 seasonal freeze depth changes (red line), including ±1 standard deviation (gray shading), 7-year smoothing (green), and linear trend (1967—2012)
[
43
]
(b)
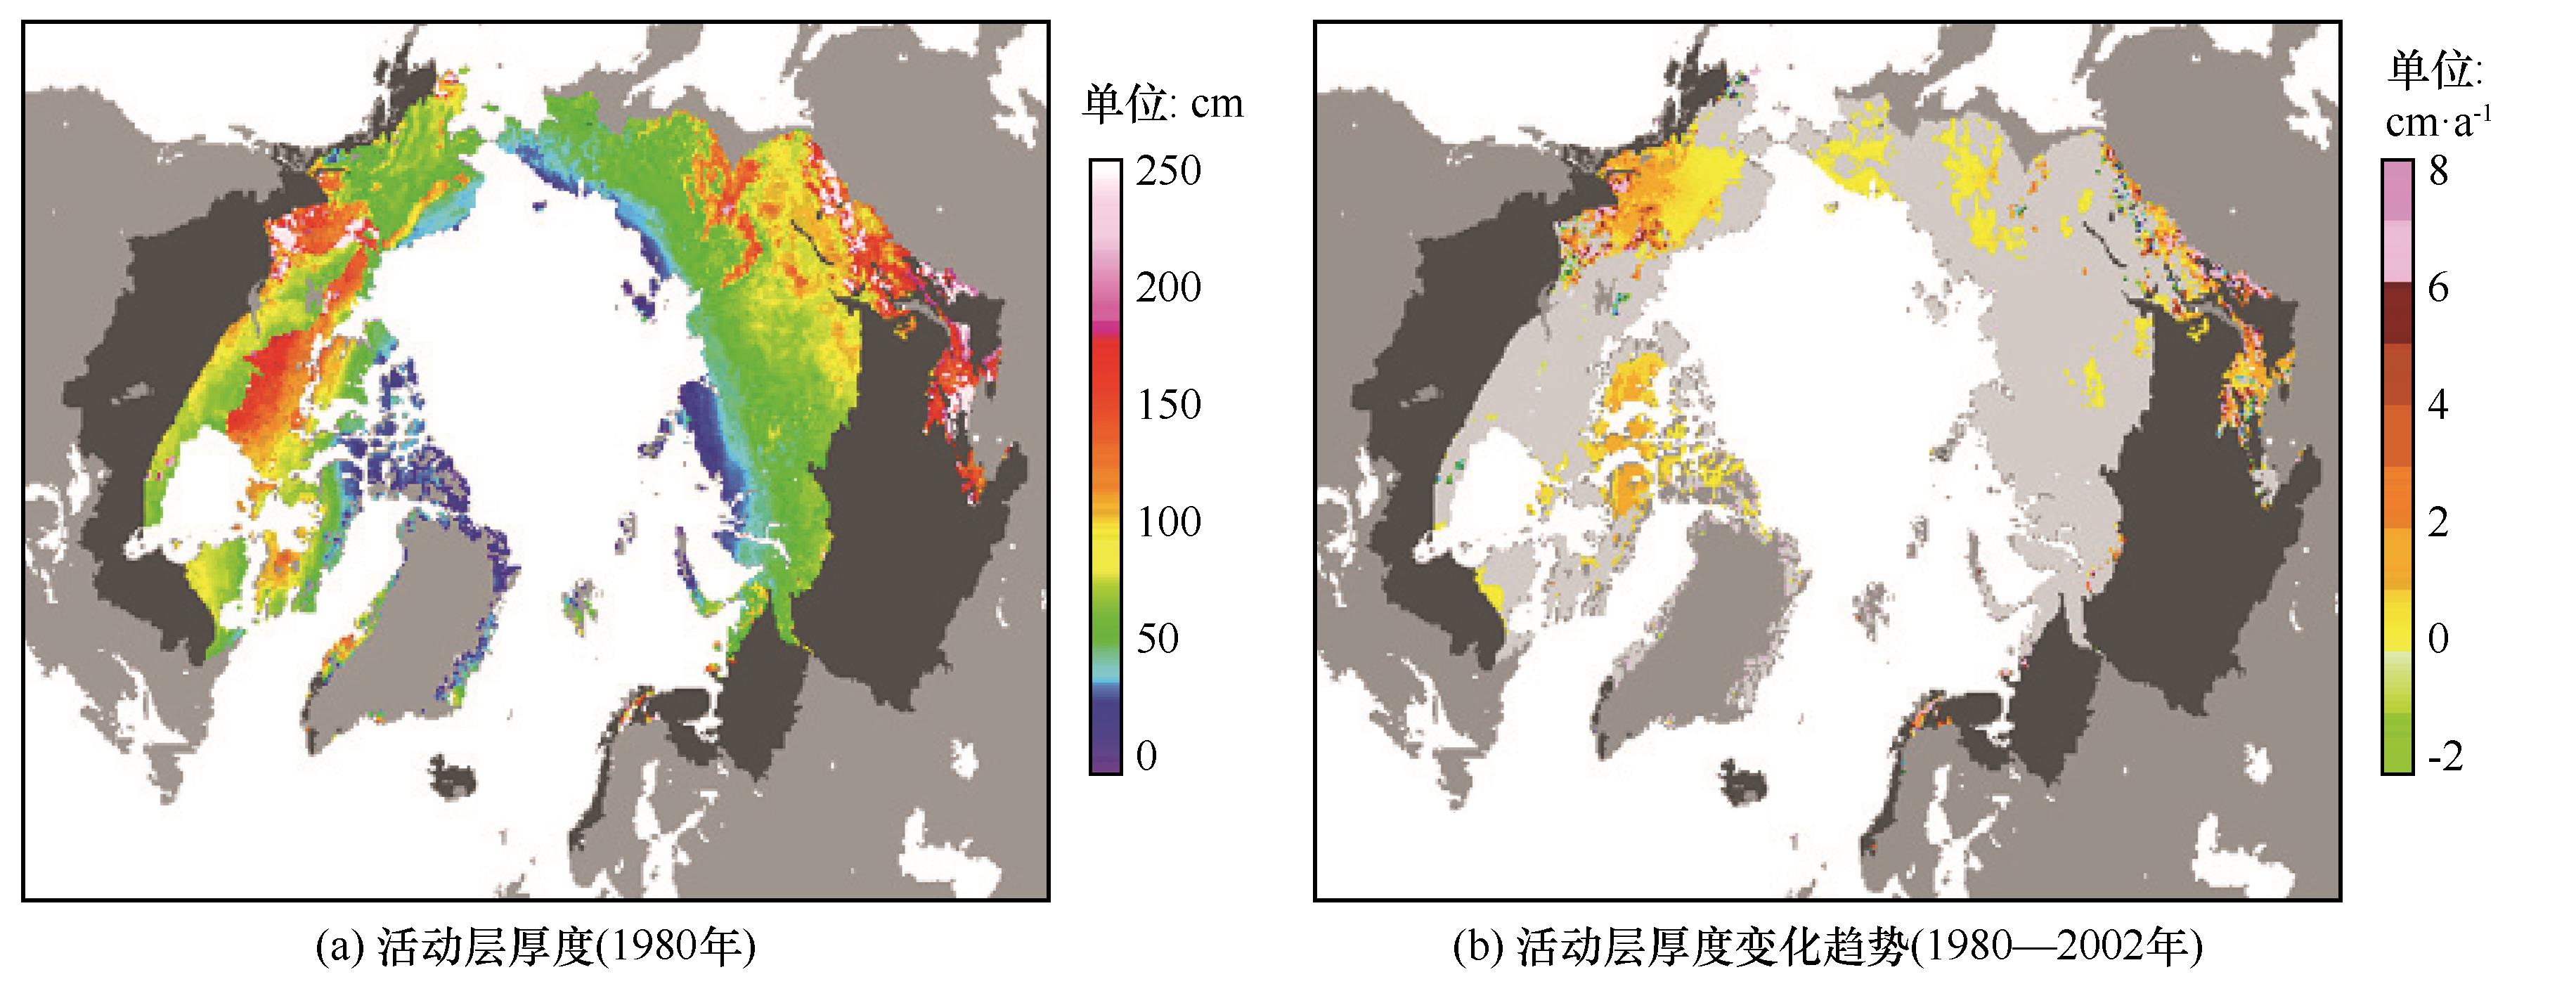
Fig. 8
Simulated active layer thickness (ALT, in cm) for 1980 (a); The 23-year linear trend for 1980—2002 in cm·a
-1
, significant at the 95% confidence level
[
59
]
(b); seasonally frozen ground and isolated permafrost zones are masked in black
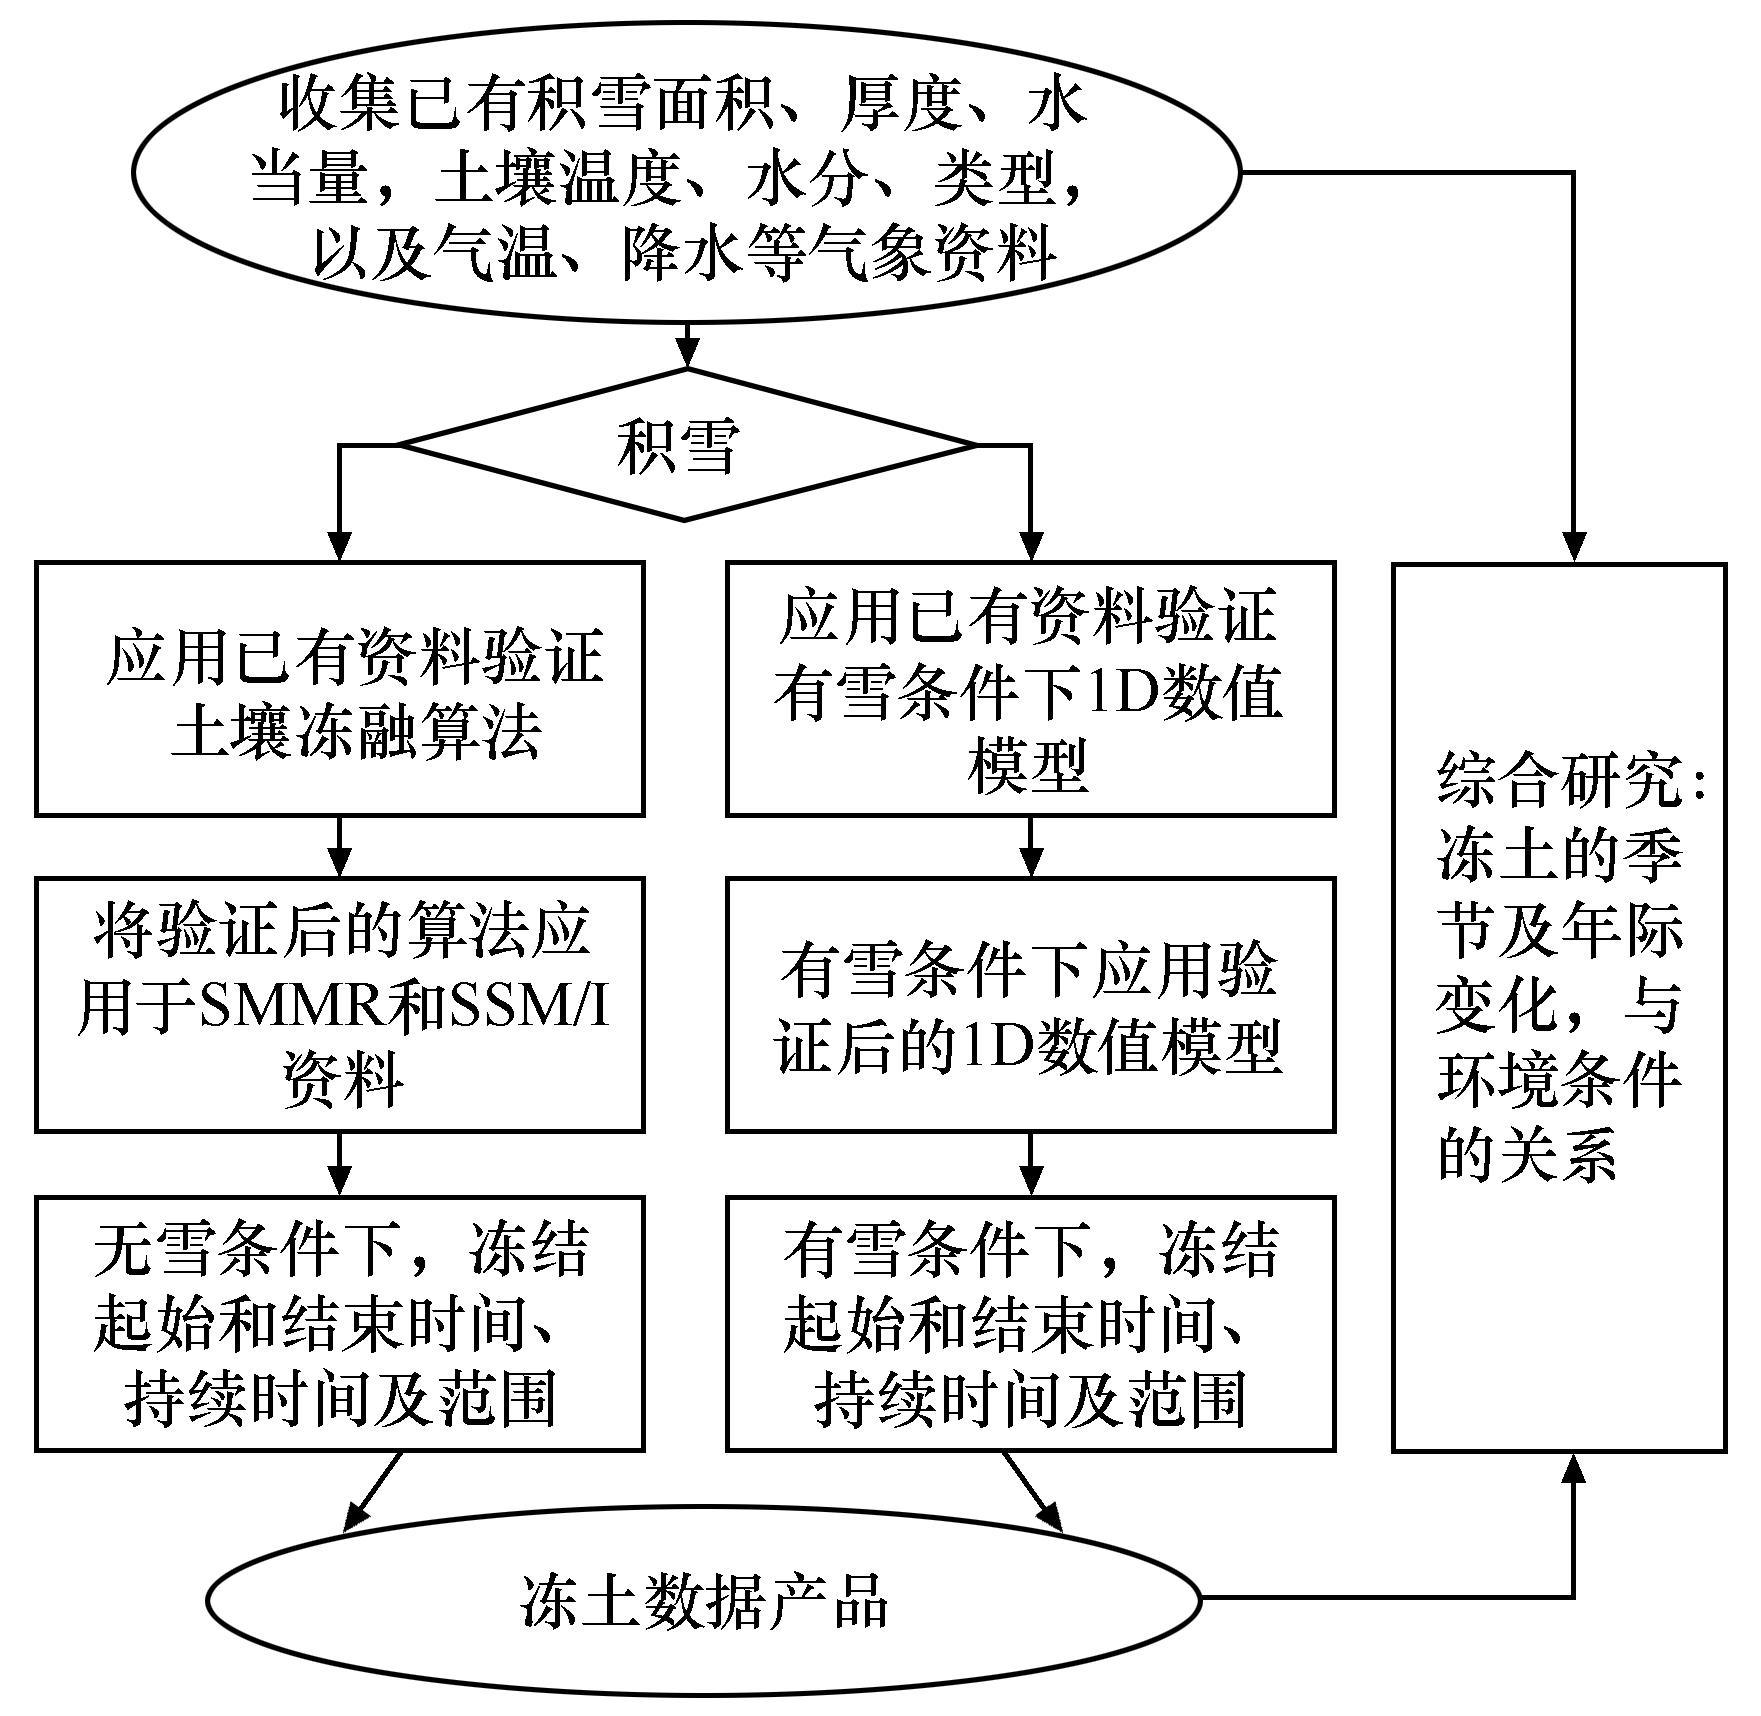
Fig. 9
Flowchart of the combined frozen soil algorithm
[
28
]
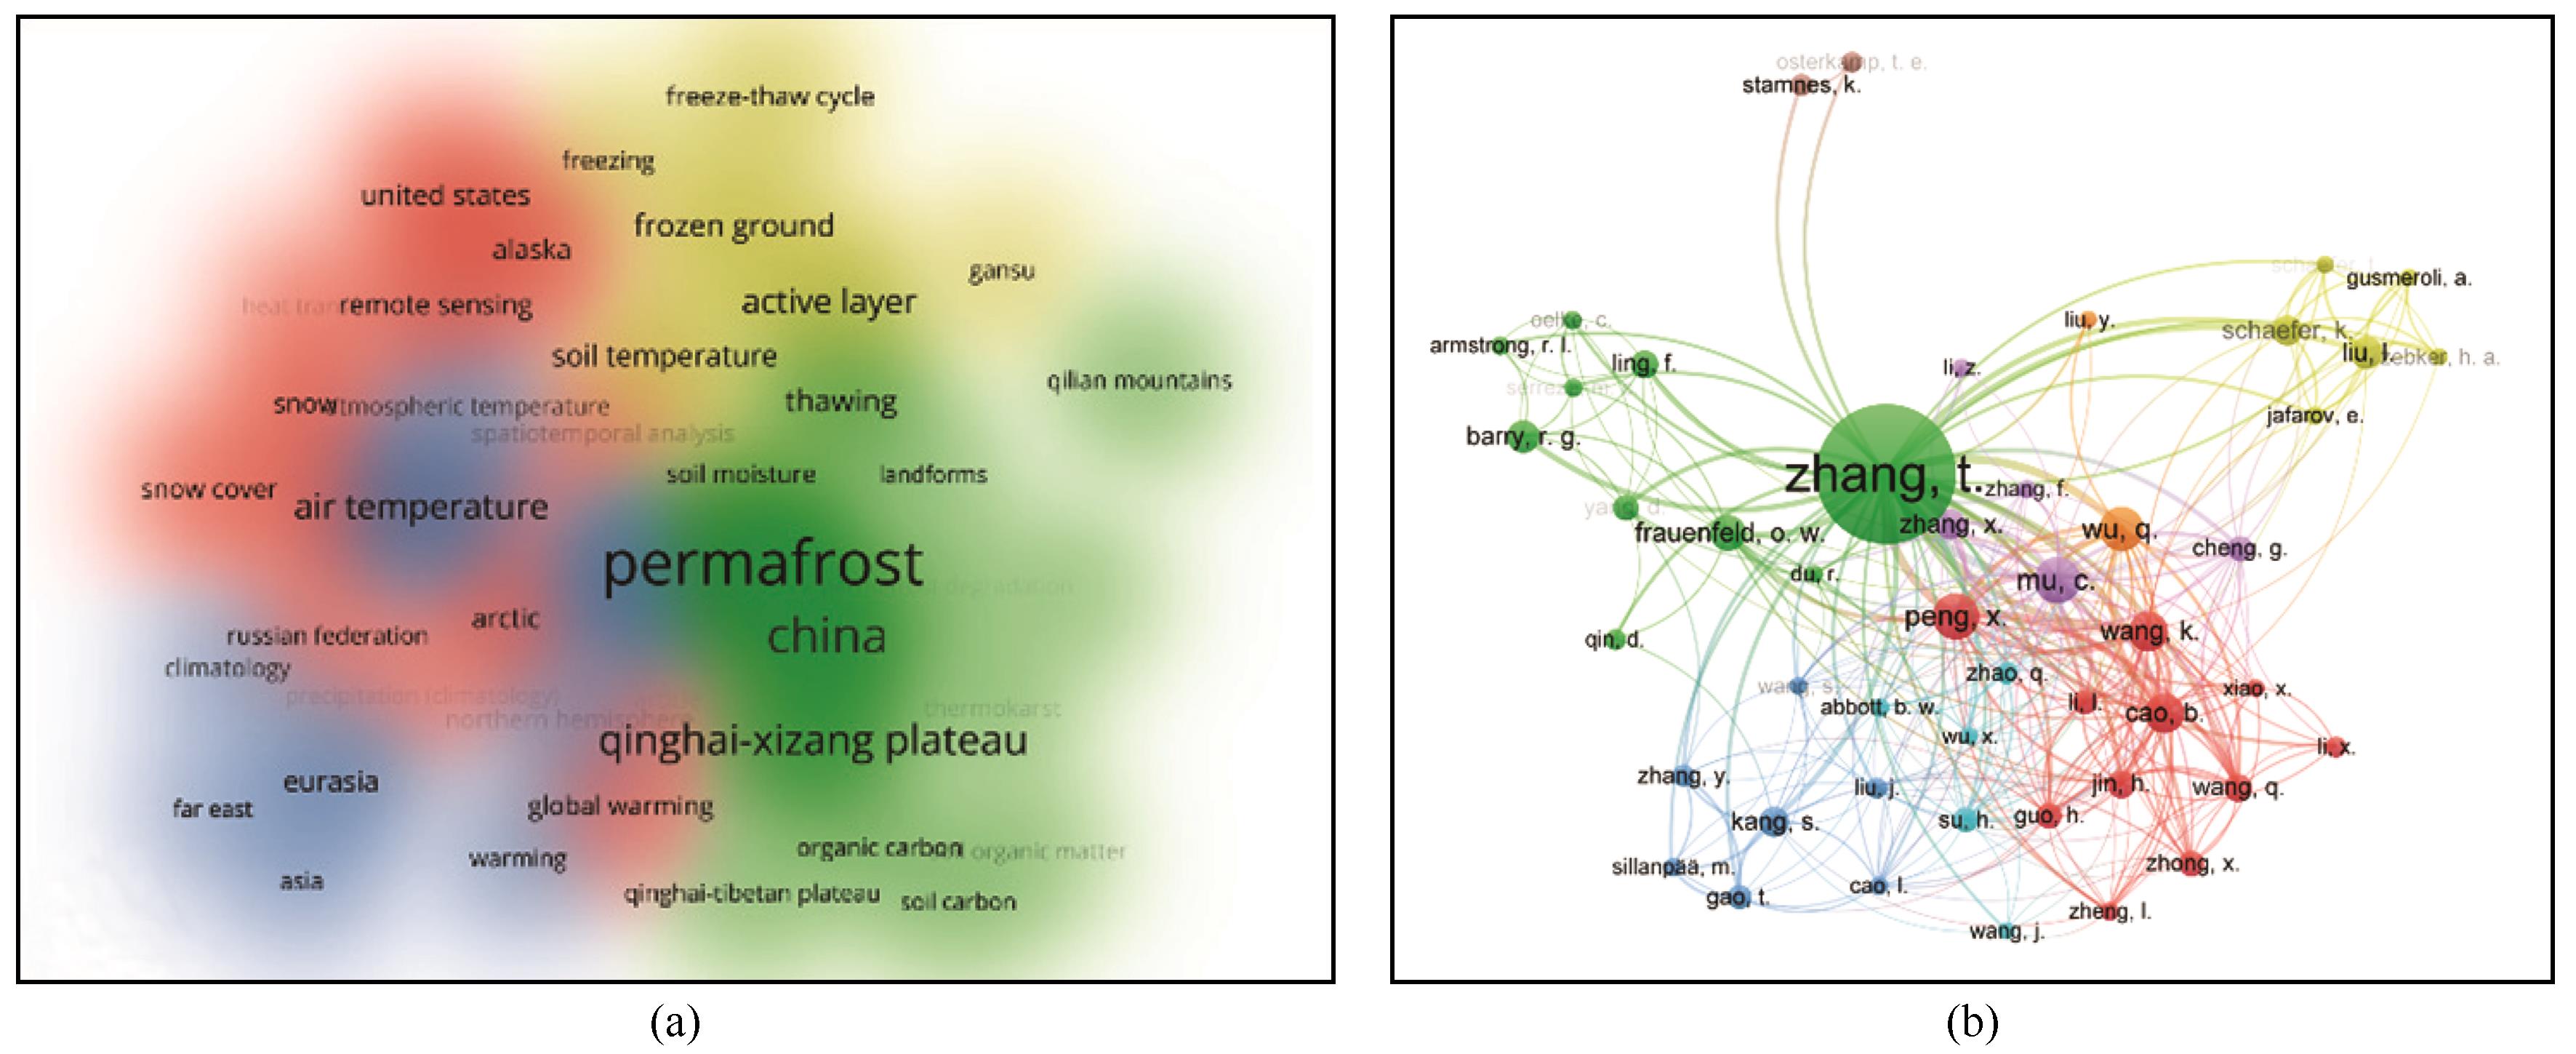
Fig. 10
Keyword co-occurrence network (lowest occurrence frequency was set to 10) (a), (b) as (a) but for co-authorship network