ISSN 1000-0240
CN 62-1072/P
RSS
|
Email Alert
Toggle navigation
Home
About Journal
Editorial Board
Authors
Publication Ethics
Journal Online
Current Issue
Online First
Archive
Most Read
Most Download
Most Cited
Subscription
Advertisement
Contact Us
中文
More options
Journal
DOI
ALL
Journal of Glaciology and Geocryology
Publication year from
To
All
1979
1980
1981
1982
1983
1984
1985
1986
1987
1988
1989
1990
1991
1992
1993
1994
1995
1996
1997
1998
1999
2000
2001
2002
2003
2004
2005
2006
2007
2008
2009
2010
2011
2012
2013
2014
2015
2016
2017
2018
2019
2020
2021
2022
2023
2024
2025
All
2025
2024
2023
2022
2021
2020
2019
2018
2017
2016
2015
2014
2013
2012
2011
2010
2009
2008
2007
2006
2005
2004
2003
2002
2001
2000
1999
1998
1997
1996
1995
1994
1993
1992
1991
1990
1989
1988
1987
1986
1985
1984
1983
1982
1981
1980
1979
Volume
Issue
Author
Affiliation
Search result
Journal
Loading ...
Publication year
Loading ...
Table 4 The five disaster grades and disaster degree
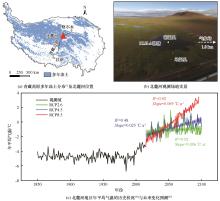
Fig. 1
Basic information of the study area: permafrost distribution on the Qinghai-Tibet Plateau (QTP)
[
1
]
and location of Beiluhe (a), picture of Beiluhe field observations (b) and annual mean air temperature in history period
[
26
]
and projections in the 21th century
[
27
]
of Beiluhe area (c)
Table 1 Environmental box technical specifications table
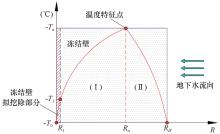
Fig. 1
Temperature distribution of the "dangerous section" of the frozen wall under the action
Table 1 Expressions of
η
and
ω
in different strength criteria
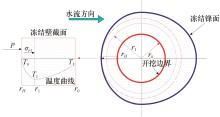
Fig.2
Mechanical model of "dangerous section" of frozen wall under groundwater
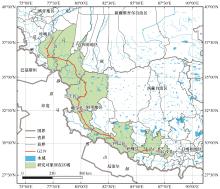
Fig. 1
Location of the Xingjiang-Tibet Highway
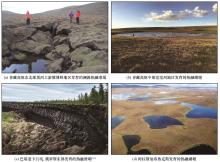
Fig.1
Typical thermokarst landforms
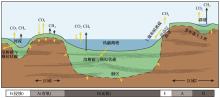
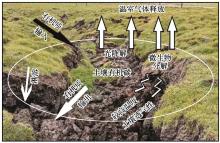
Fig.2
Mechanisms of soil carbon loss affected by thermokarst in the permafrost regions
[
30
]
The active layer thickness in Zone 1 increases uniformly in space,while Zone 2 belongs to the spatial heterogeneous permafrost degradation caused by the differences of ground ice content
Table 2 The dynamic change of types of thermokarst collapse on the Qinghai-Tibet Plateau
[
25
,
34
,
38
]
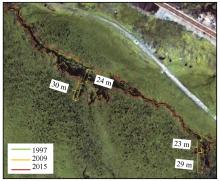
Fig.3
The development of thaw slump on the Eboling mountains of the Qilian Mountains on the northern Qinghai-Tibet Plateau from 1997 to 2015 (based on 2009 satellite imagery). The widest part of the slump widened by 24 m from 1997 to 2009, and widened by 30 m from 2009 to 2015; the source of the slump retreated 23 m from 1997 to 2009, and from 2009 to 2015 going back 29 m
Fig.4
A schematic of thaw slumps influencing the ecosystem carbon cycle
[
47
]
The black arrows represent the input of dissolved organic matter,and the white arrows represent the vertical carbon distribution process and the greenhouse gas emissions
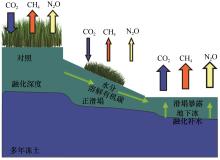
Fig.5
Impacts of permafrost degradation on soil moisture, dissolved organic carbon and the release of greenhouse gases (CO
2
, CH
4
and N
2
O), and the arrows indicate the direction and potential of ecosystem greenhouse gas exchange during the growing seasons
[
45
]
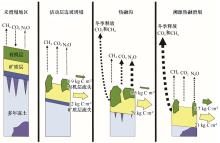
Fig.6
Conceptual model of the effects of the three types of most common hillslope thermokarst landscapes on carbon and nitrogen cycling and flux
[
16
]
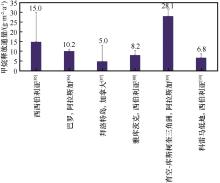
Fig.7
Comparisons of methane release fluxes from thermokarst lakes in the Arctic regions
[
85
-
90
]
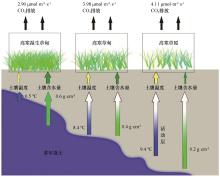
Fig.1
A schematic diagram of effects of permafrost on ecosystem respirations on the Third Pole regions
[
17
]
The blue and green arrows showed the effects of permafrost on soil temperature and moisture, and the faded arrows showed the effects of permafrost decreased along with deepening of active layer. The yellow and dark green arrows showed the positive effects of soil temperature and negative effects of moisture on ecosystem respirations, and the larger arrows indicated stronger effects
Fig.1
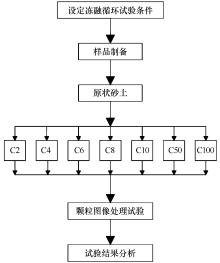
The test plan flow chart
Fig.9
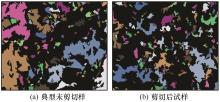
Vectorized SEM images
Fig. 1
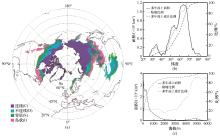
Distribution of permafrost in the Northern Hemisphere (based on the EASE-grid)
[
2
]
(a); variations of the permafrost area (solid line) and its fraction (short dashed line) of the land surface at each latitude, and the accumulated fraction with latitudes (long dashed line) in the Northern Hemisphere
[
2
]
(b); (c) as (b) but for elevation bands
[
2
]
Table 4 RMSE (px) before and after correction for Kangerlussuaq Glacier
page
Page 1 of 466
Total 9310 records
First page
Prev page
Next page
Last page