×
模态框(Modal)标题
在这里添加一些文本
Close
Close
Submit
Cancel
Confirm
×
模态框(Modal)标题
×
ISSN 1000-0240
CN 62-1072/P
RSS
|
Email Alert
Toggle navigation
Home
About Journal
Editorial Board
Authors
Publication Ethics
Journal Online
Current Issue
Online First
Archive
Most Read
Most Download
Most Cited
Subscription
Advertisement
Contact Us
中文
Figure/Table detail
Variations in Arctic vortex and their impact on snowfall in Songhua River Basin
FAN Rong, GAO Ling, ZHANG Lijuan, ZHAO Yufeng, WANG Jiaxin, HUANG Yutao, DONG Siyan
Journal of Glaciology and Geocryology
, 2025, 47(
4
): 927-939. DOI:
10.7522/j.issn.1000-0240.2025.0074
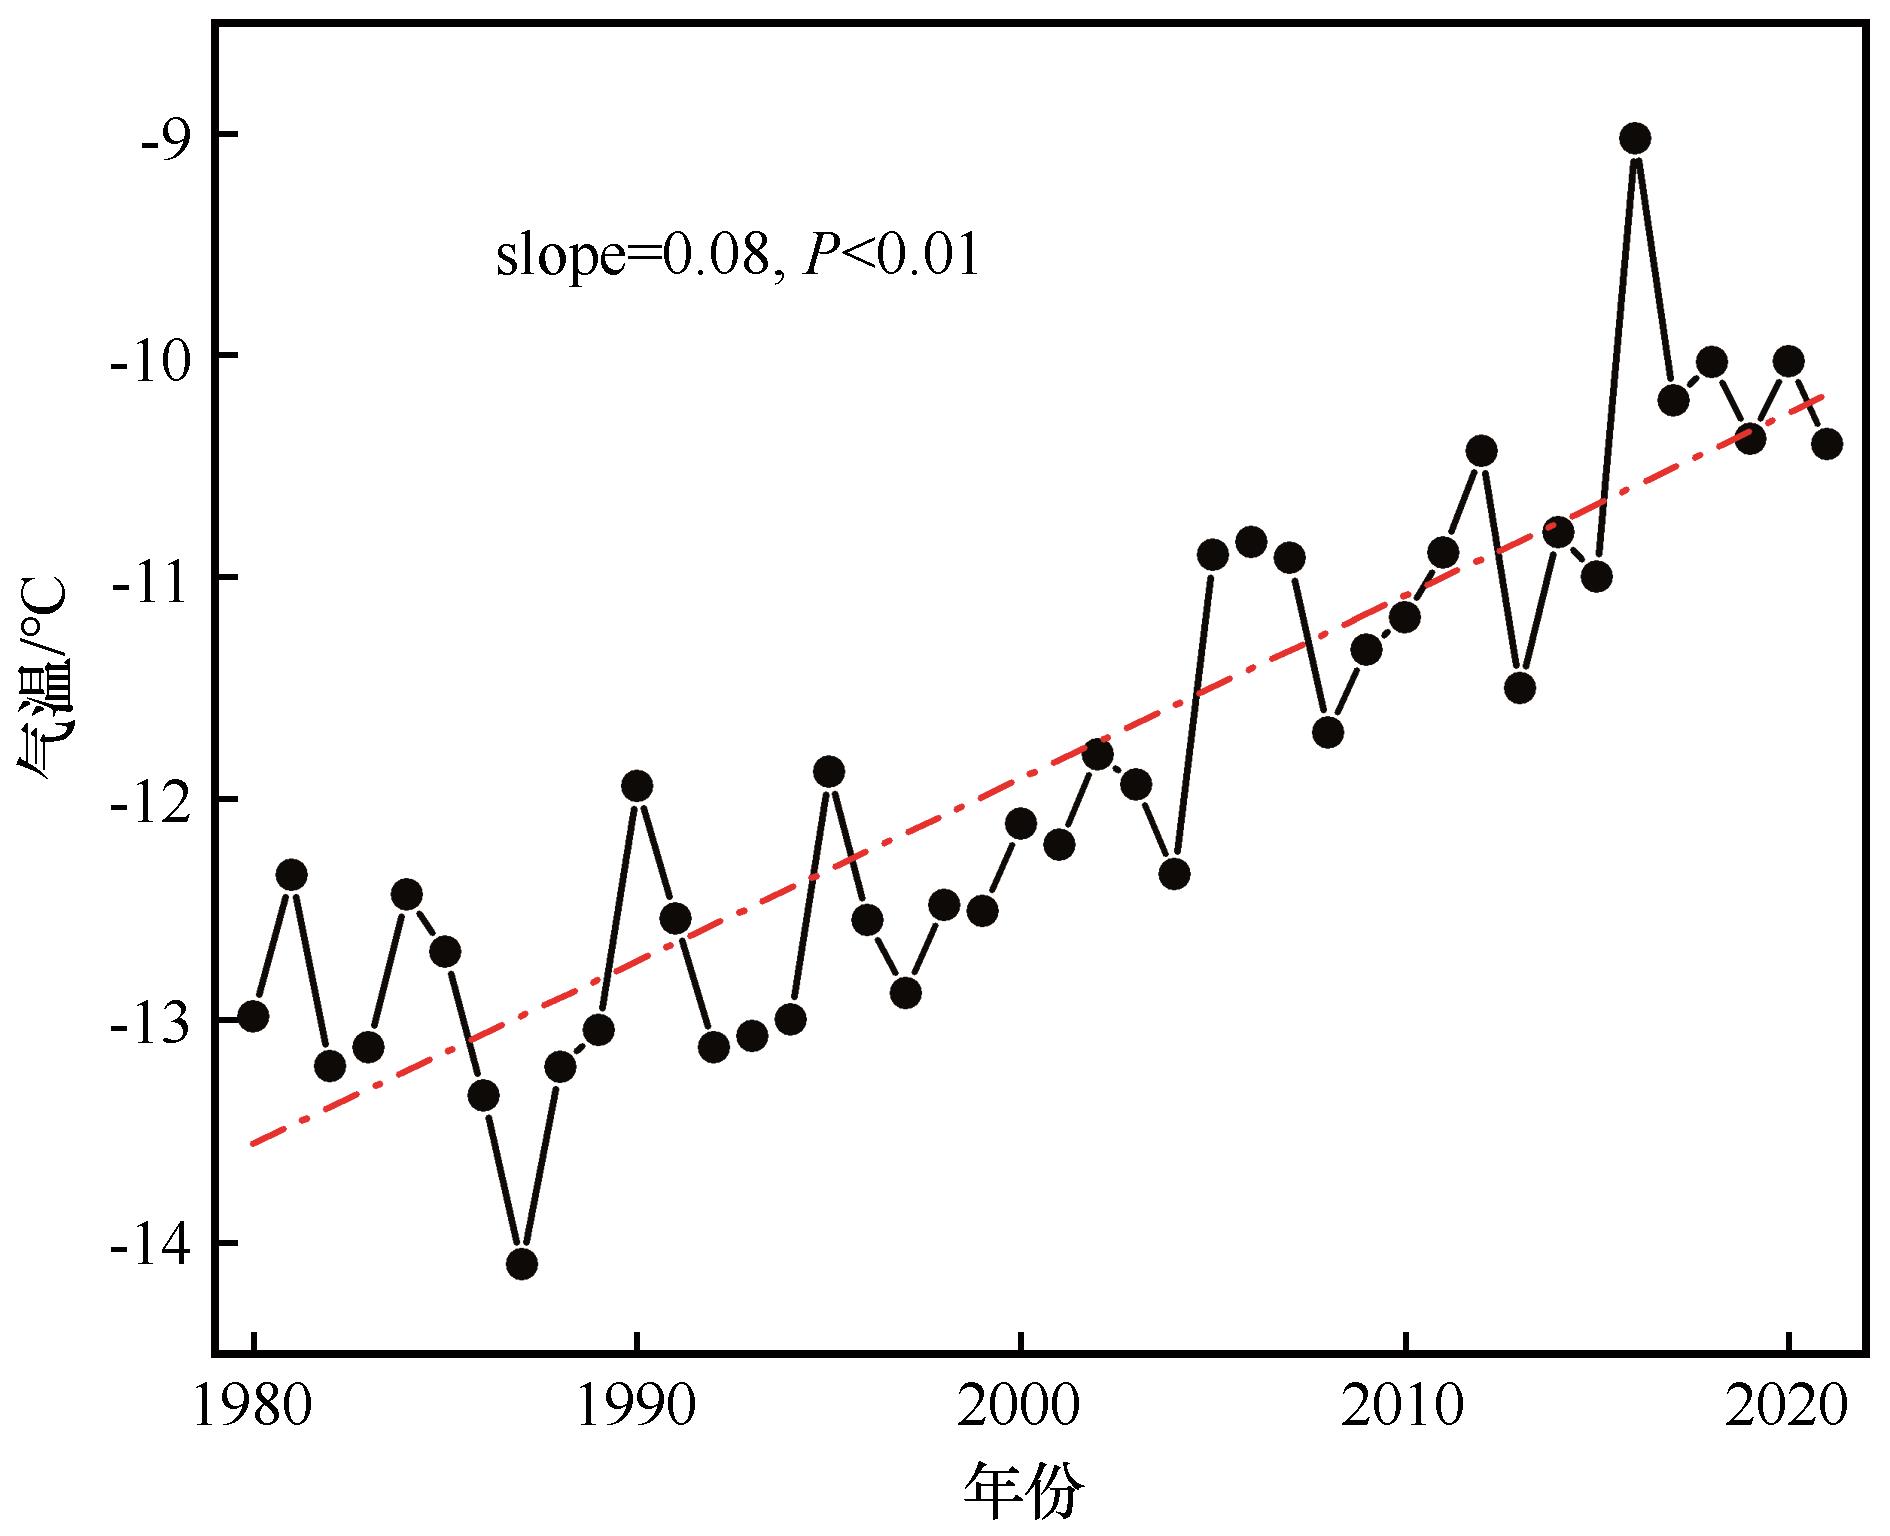
Fig. 16
Variations in surface air temperature in Arctic (1980—2021)
Other figure/table from this article
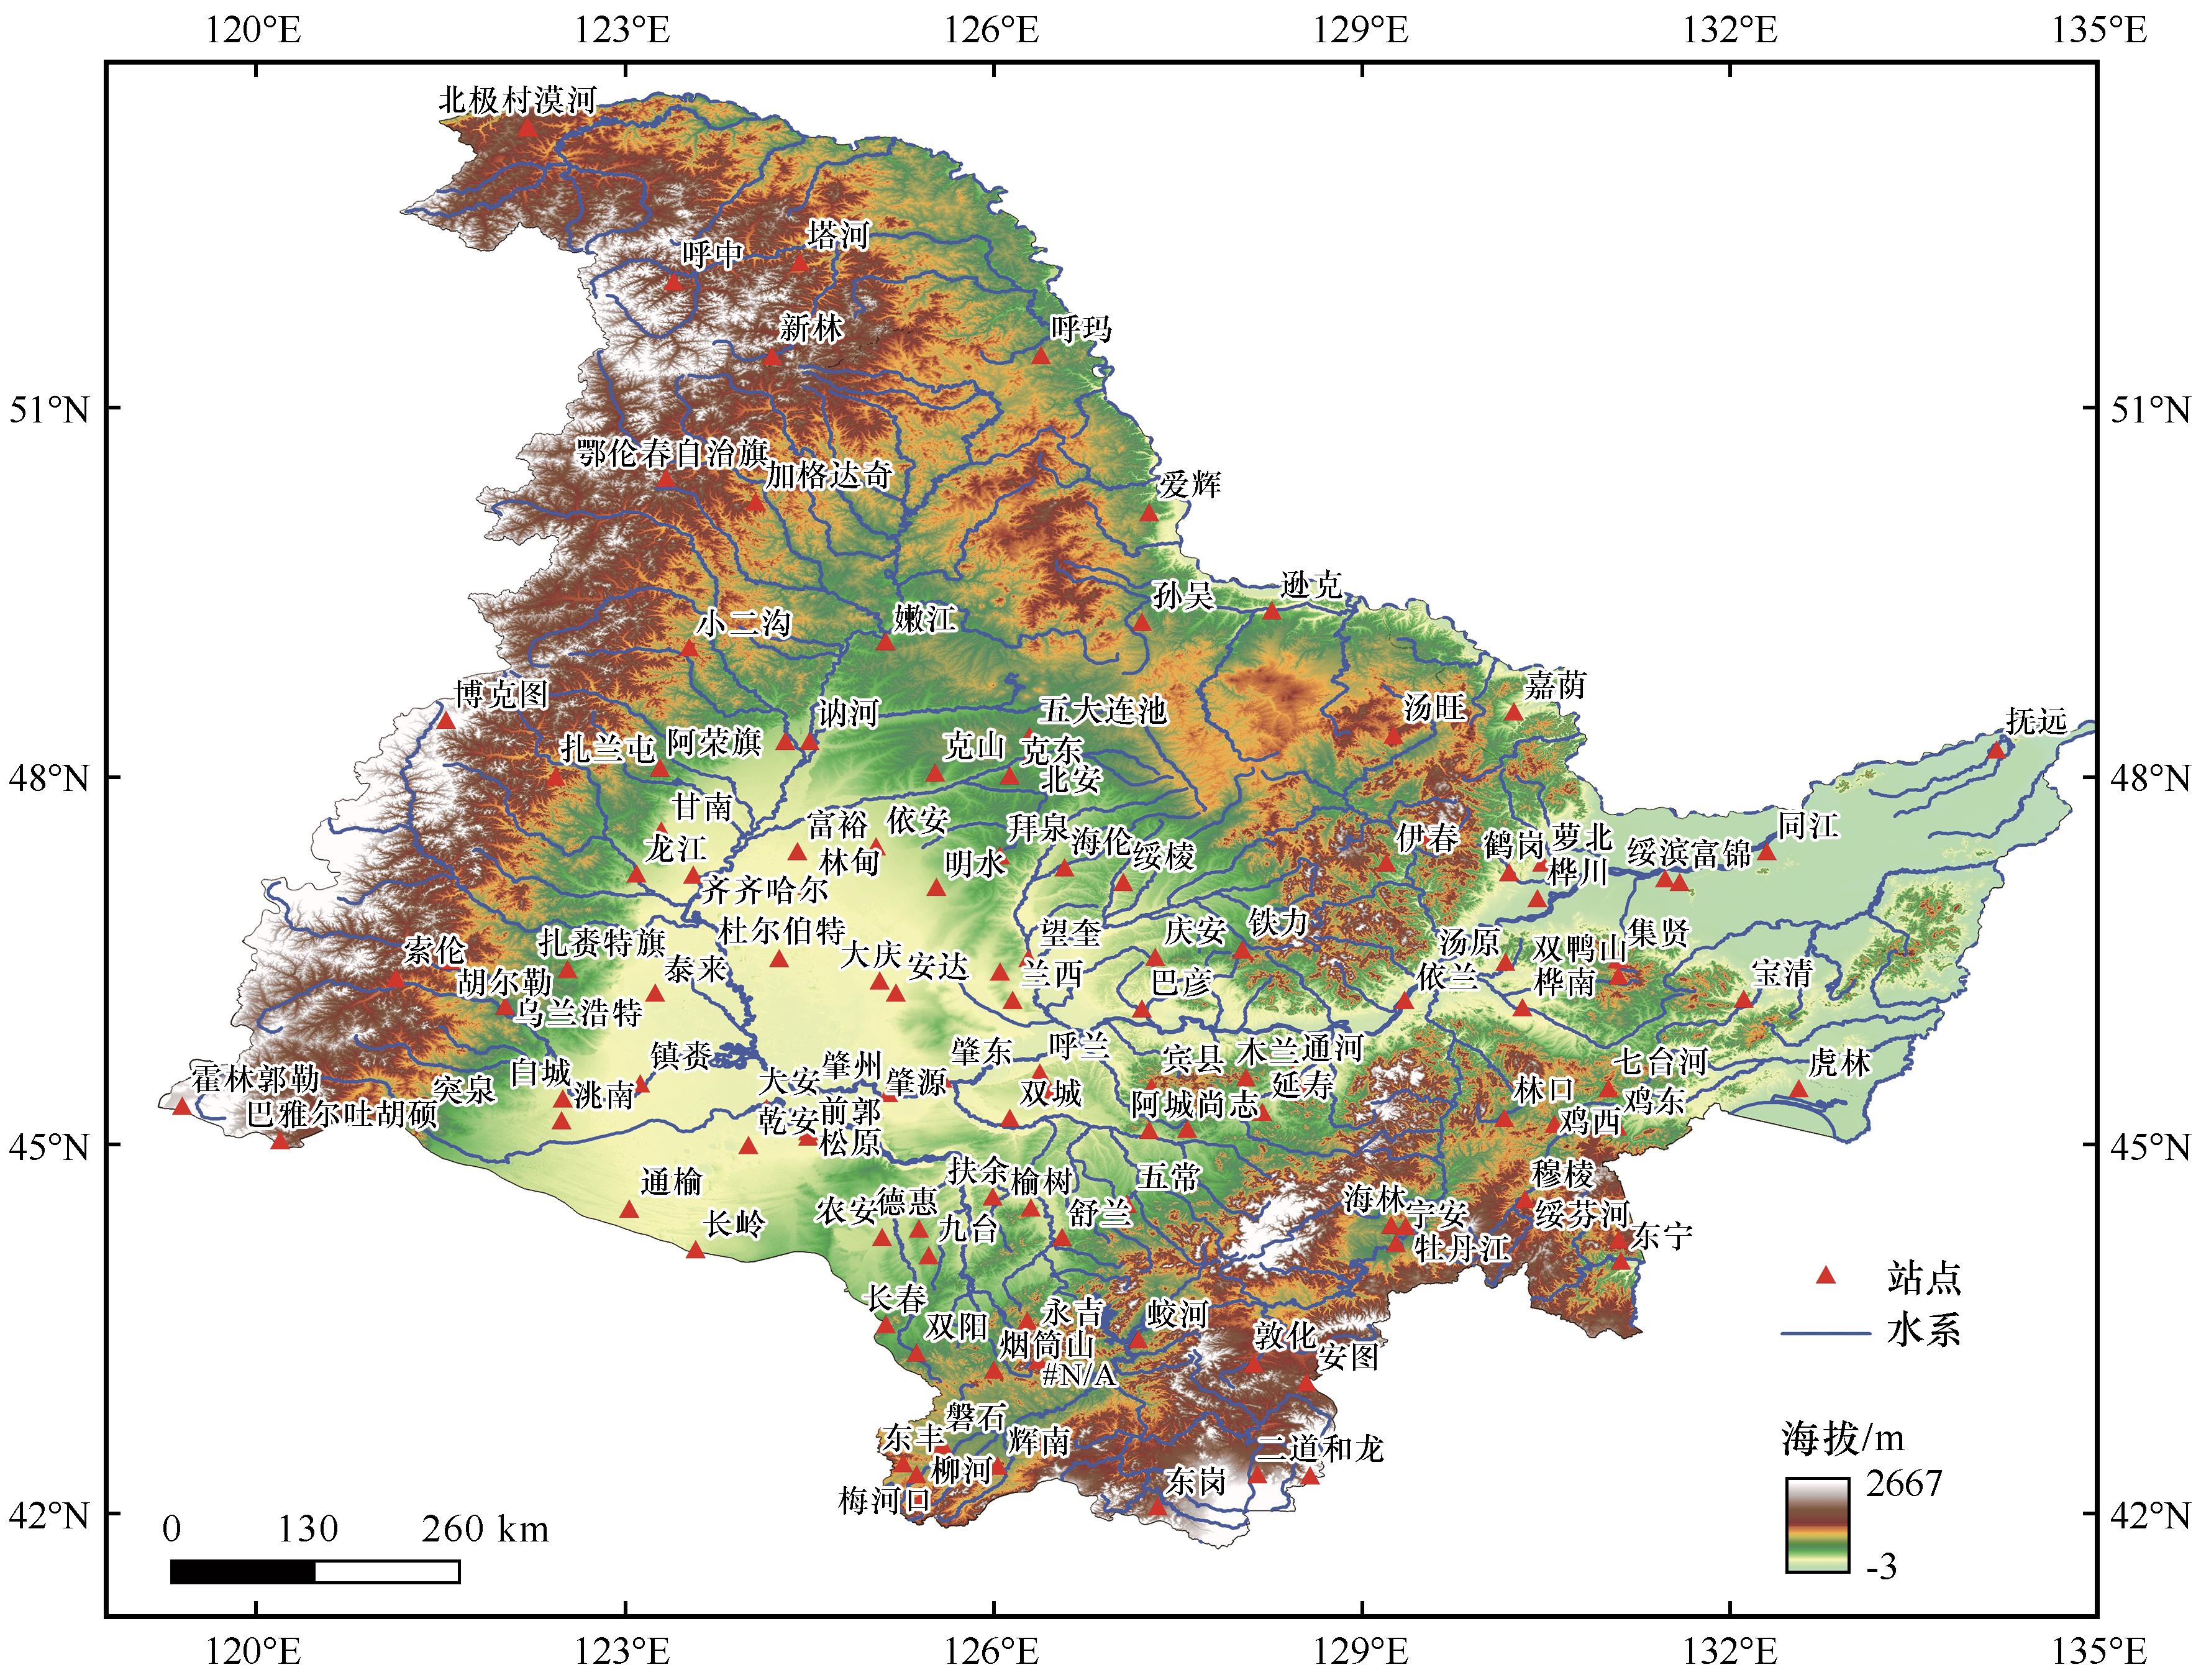
Fig. 1
Location of Songhua River Basin and distribution of meteorological stations
Table 1
Monthly contours of southern boundary of Northern Hemisphere polar vortex in 500 hPa layer
Table 2
Classification criteria for snowfall amounts
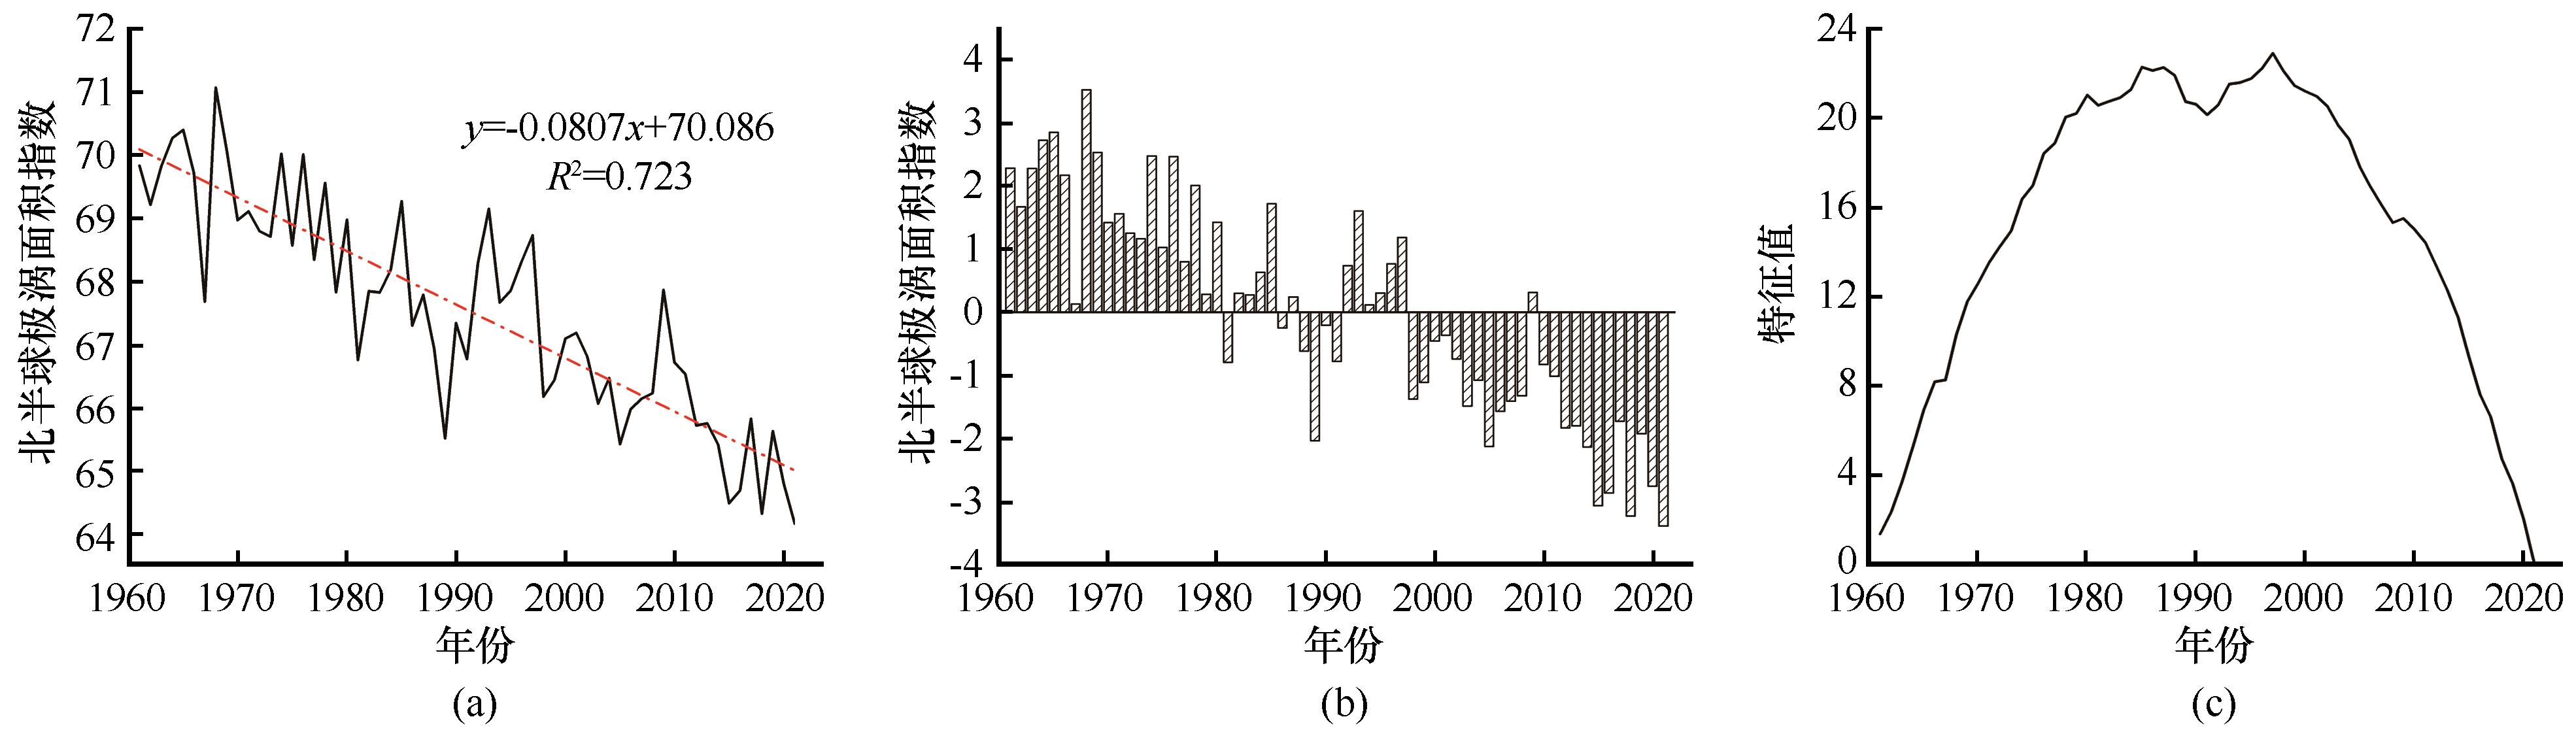
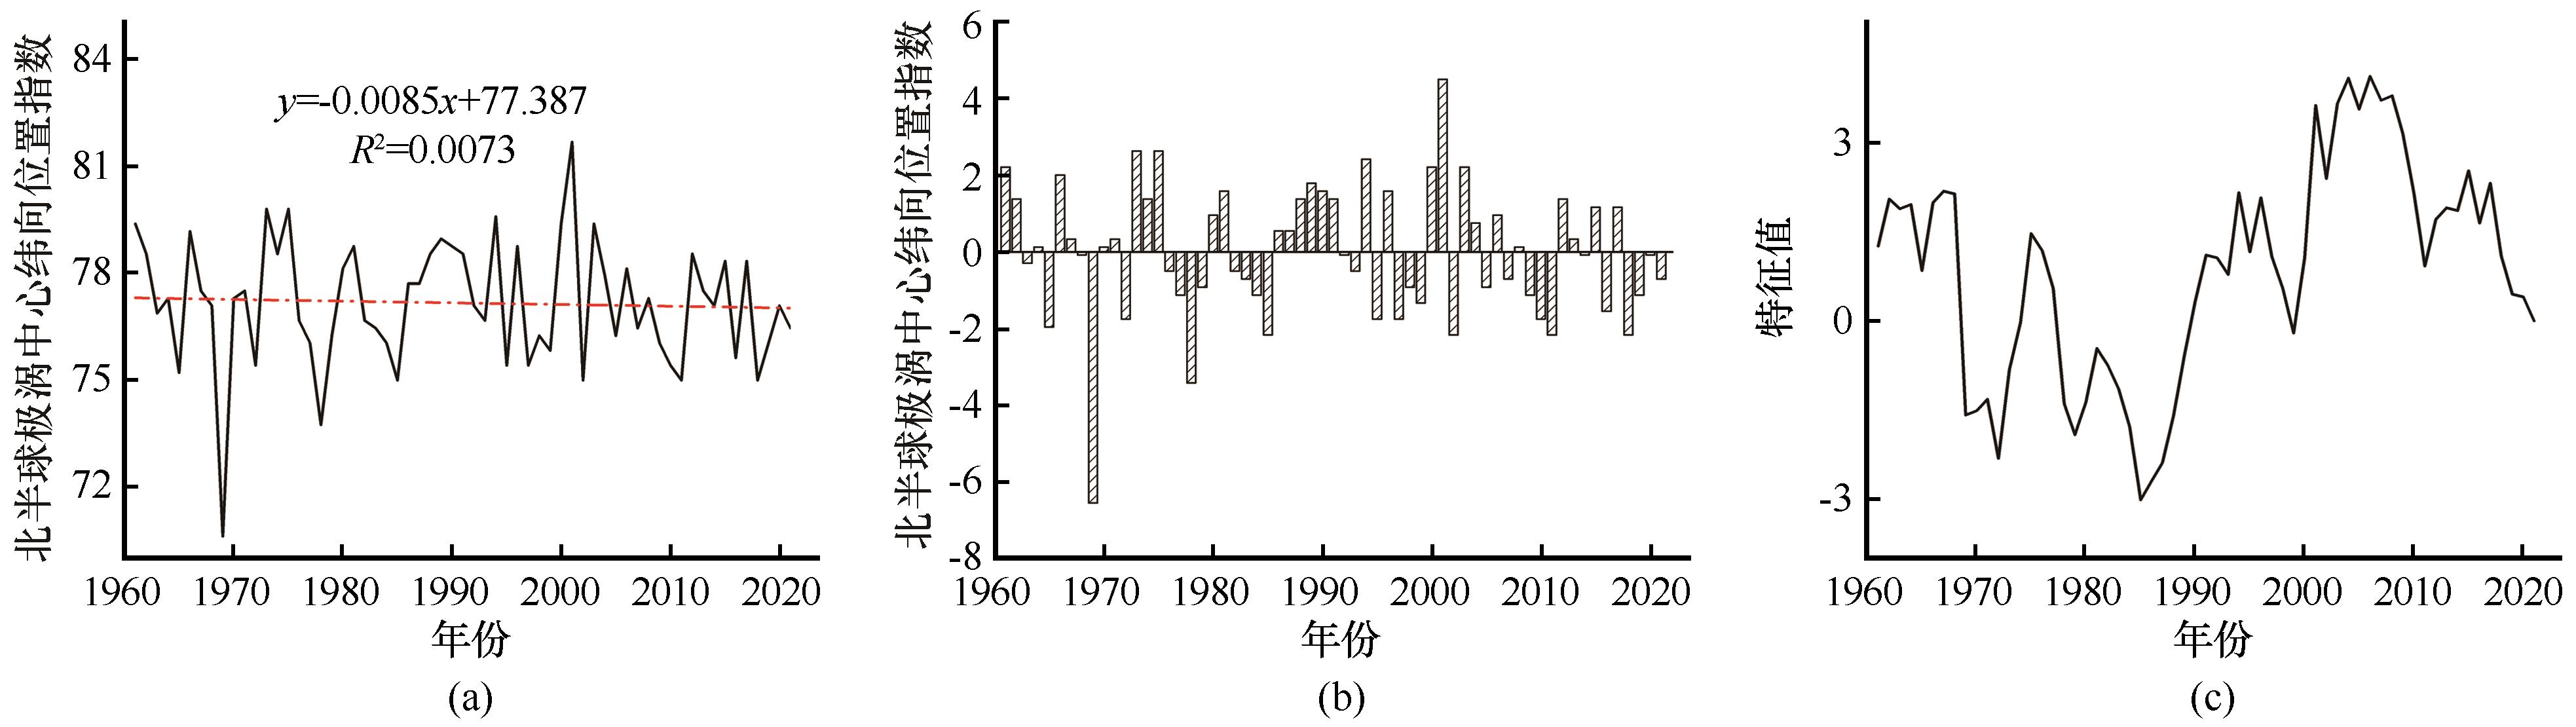
Fig. 2
Distribution of polar vortex area index (a), anomaly map (b), and RAPS abrupt change test diagram (c) from 1961 to 2021
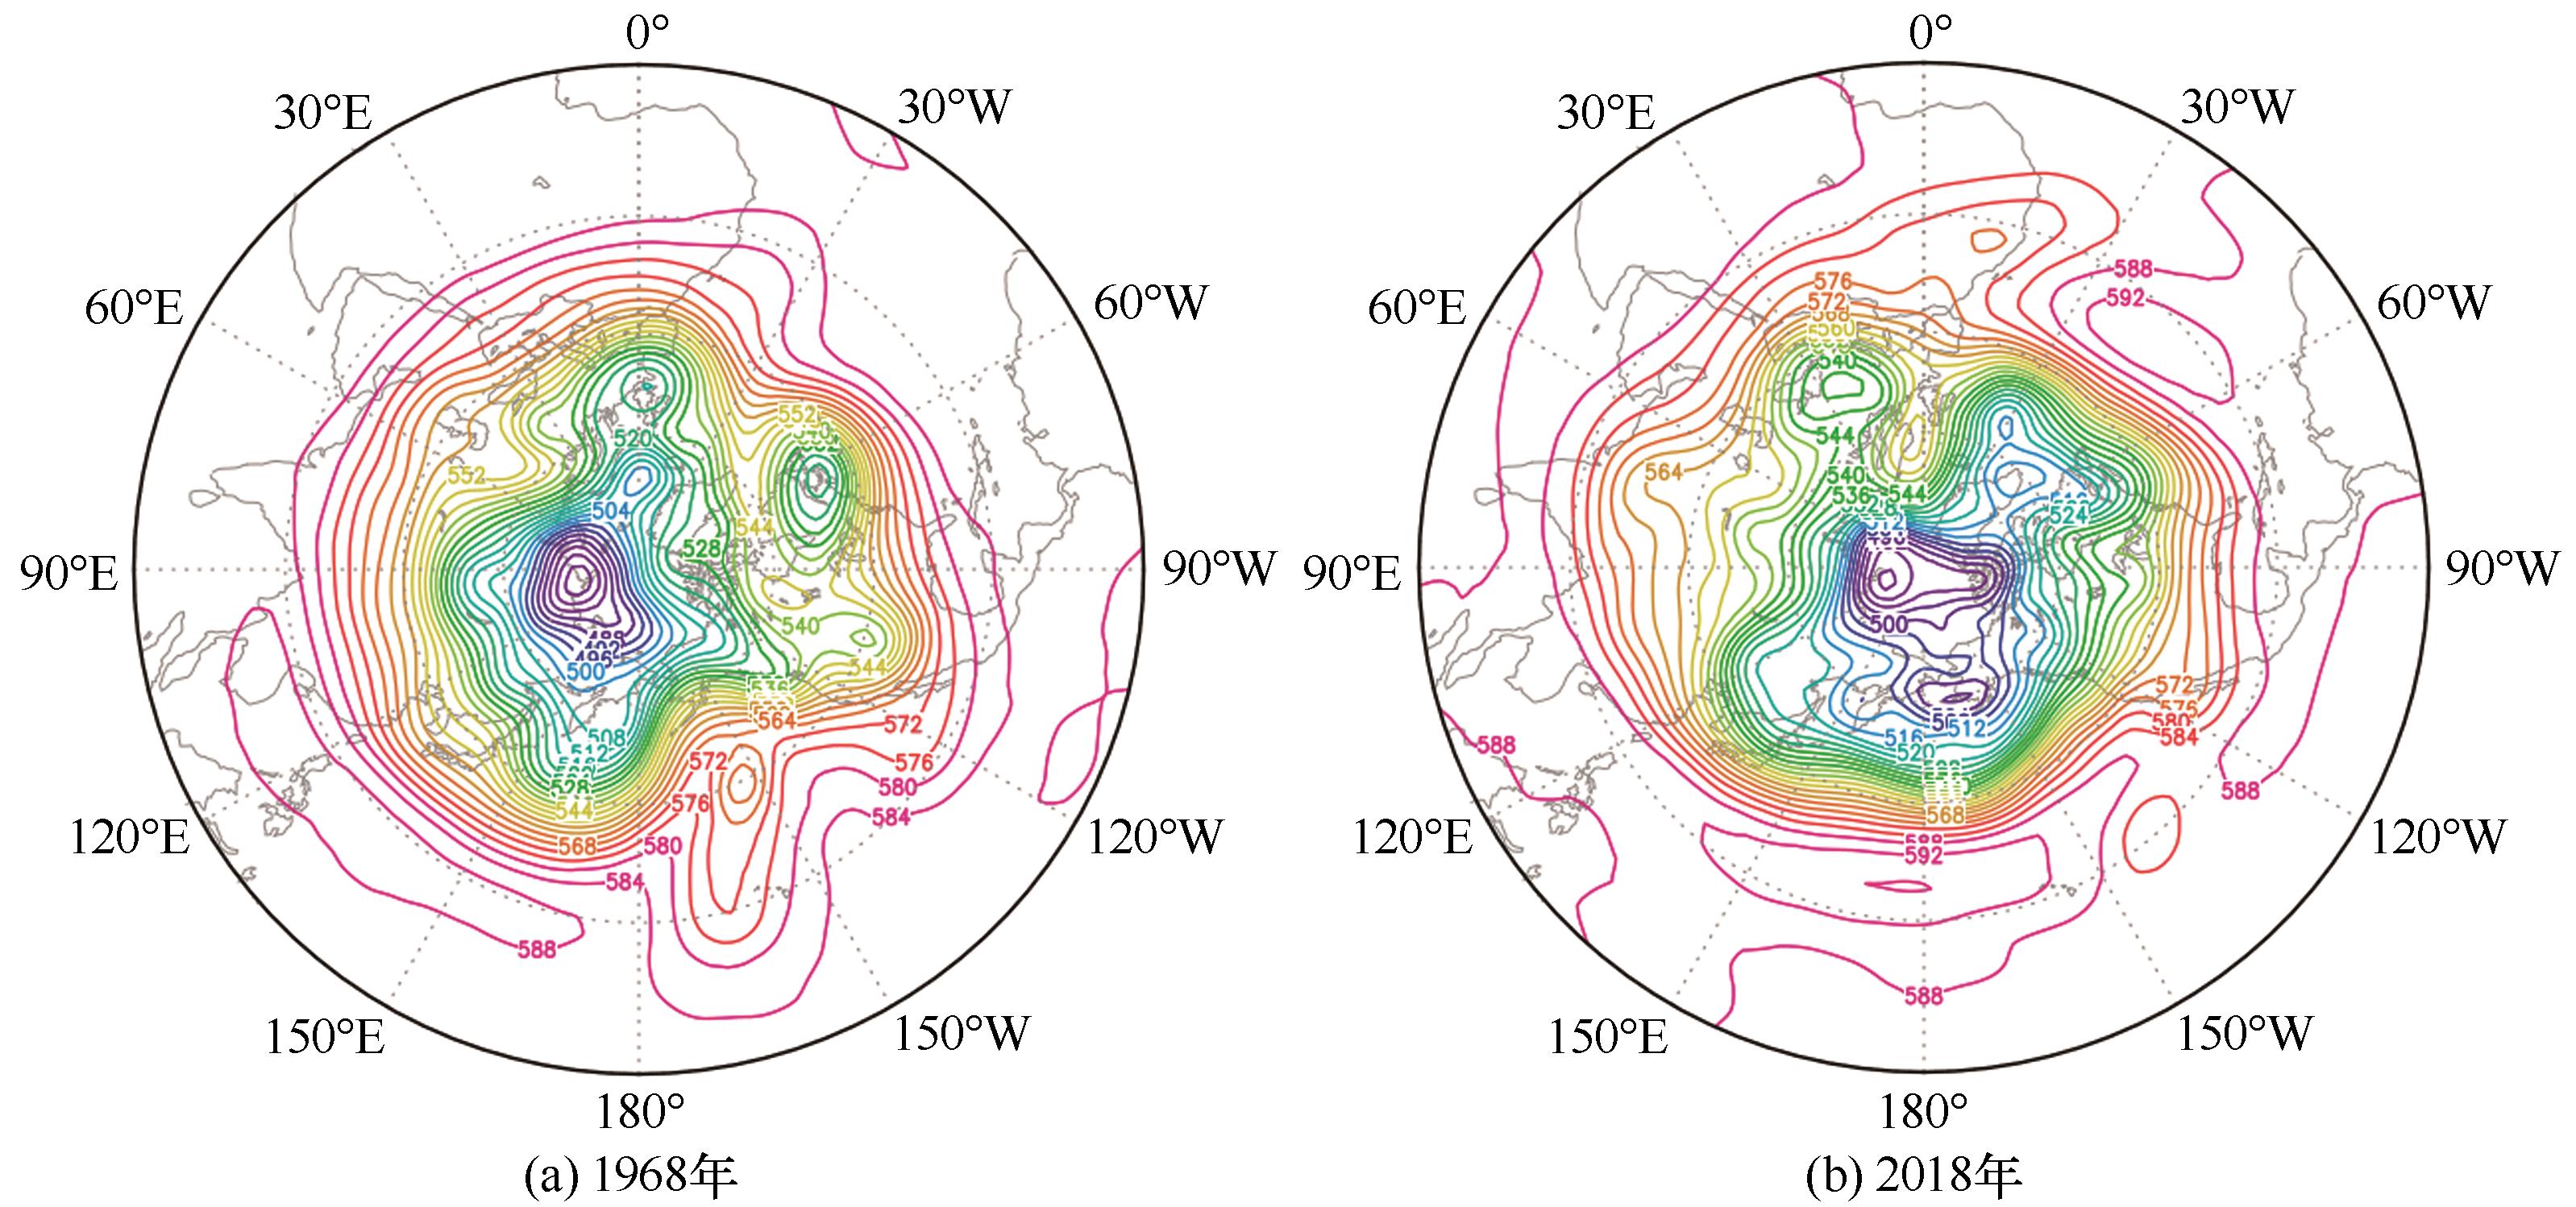
Fig. 3
Spatial comparison of polar vortex area between December 1968 (a) and December 2018 (b)
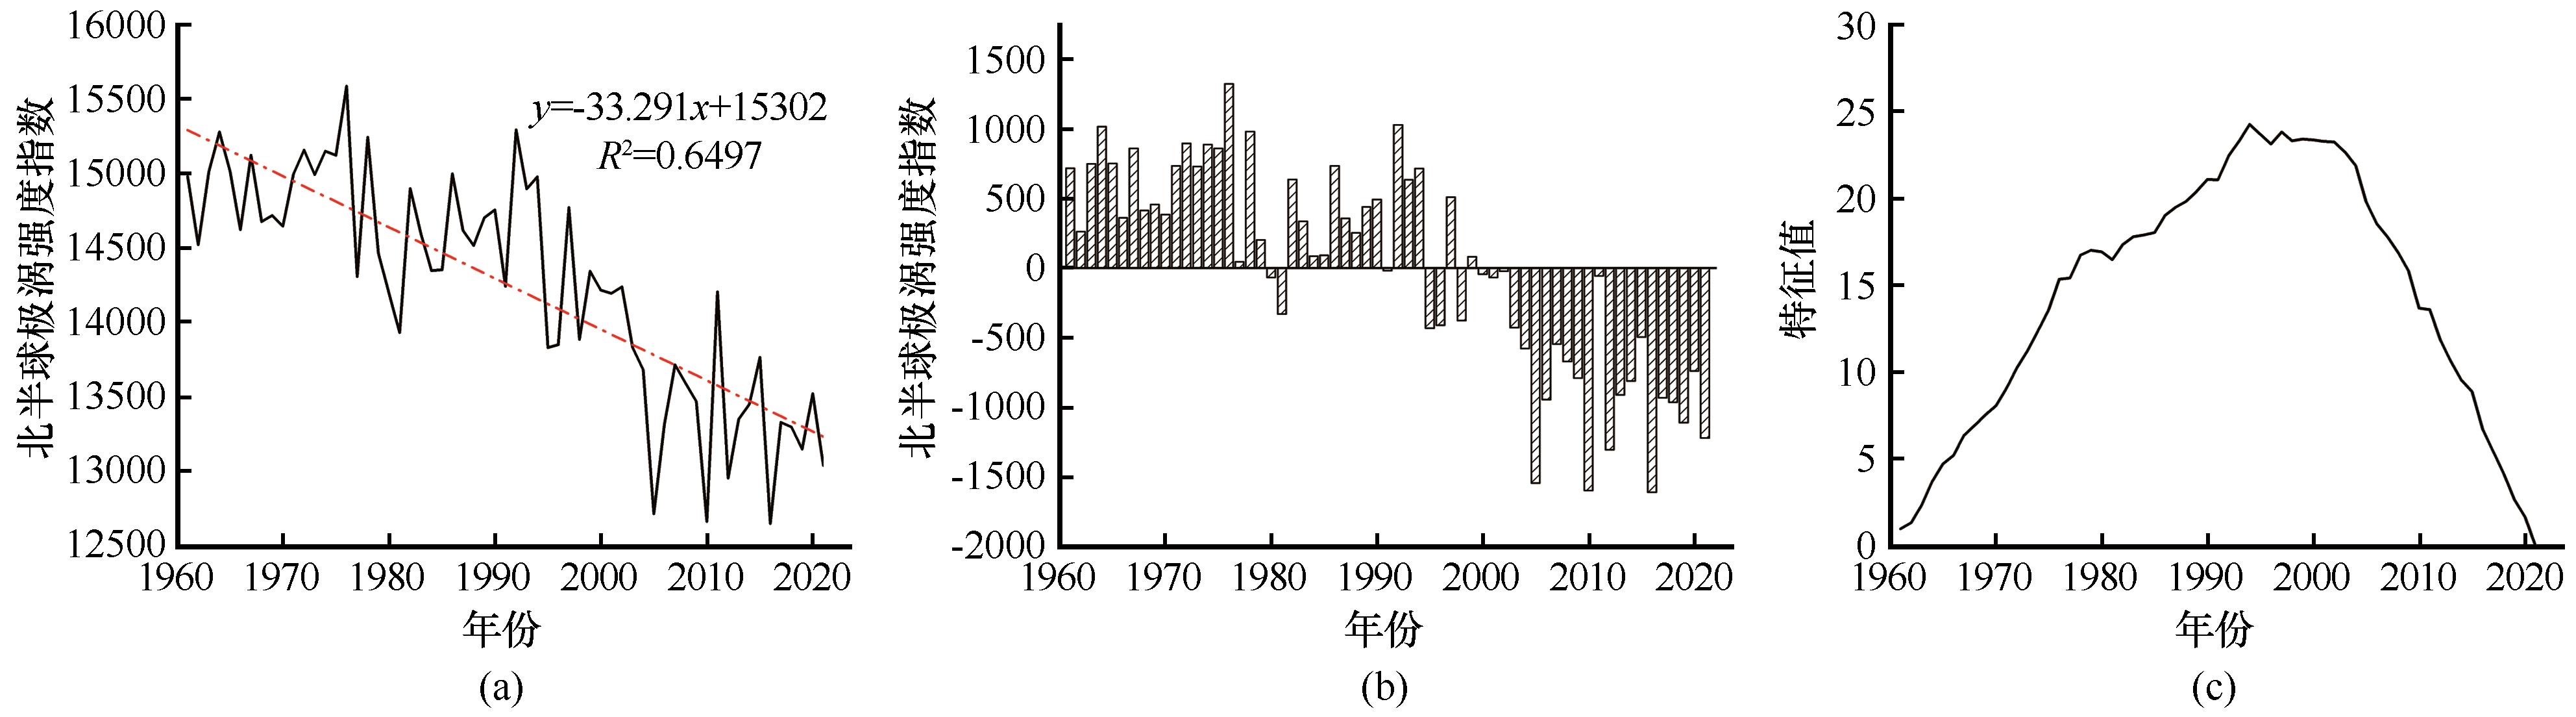
Fig. 4
Distribution of polar vortex intensity index (a), anomaly map (b), and RAPS abrupt change test diagram (c) from 1961 to 2021
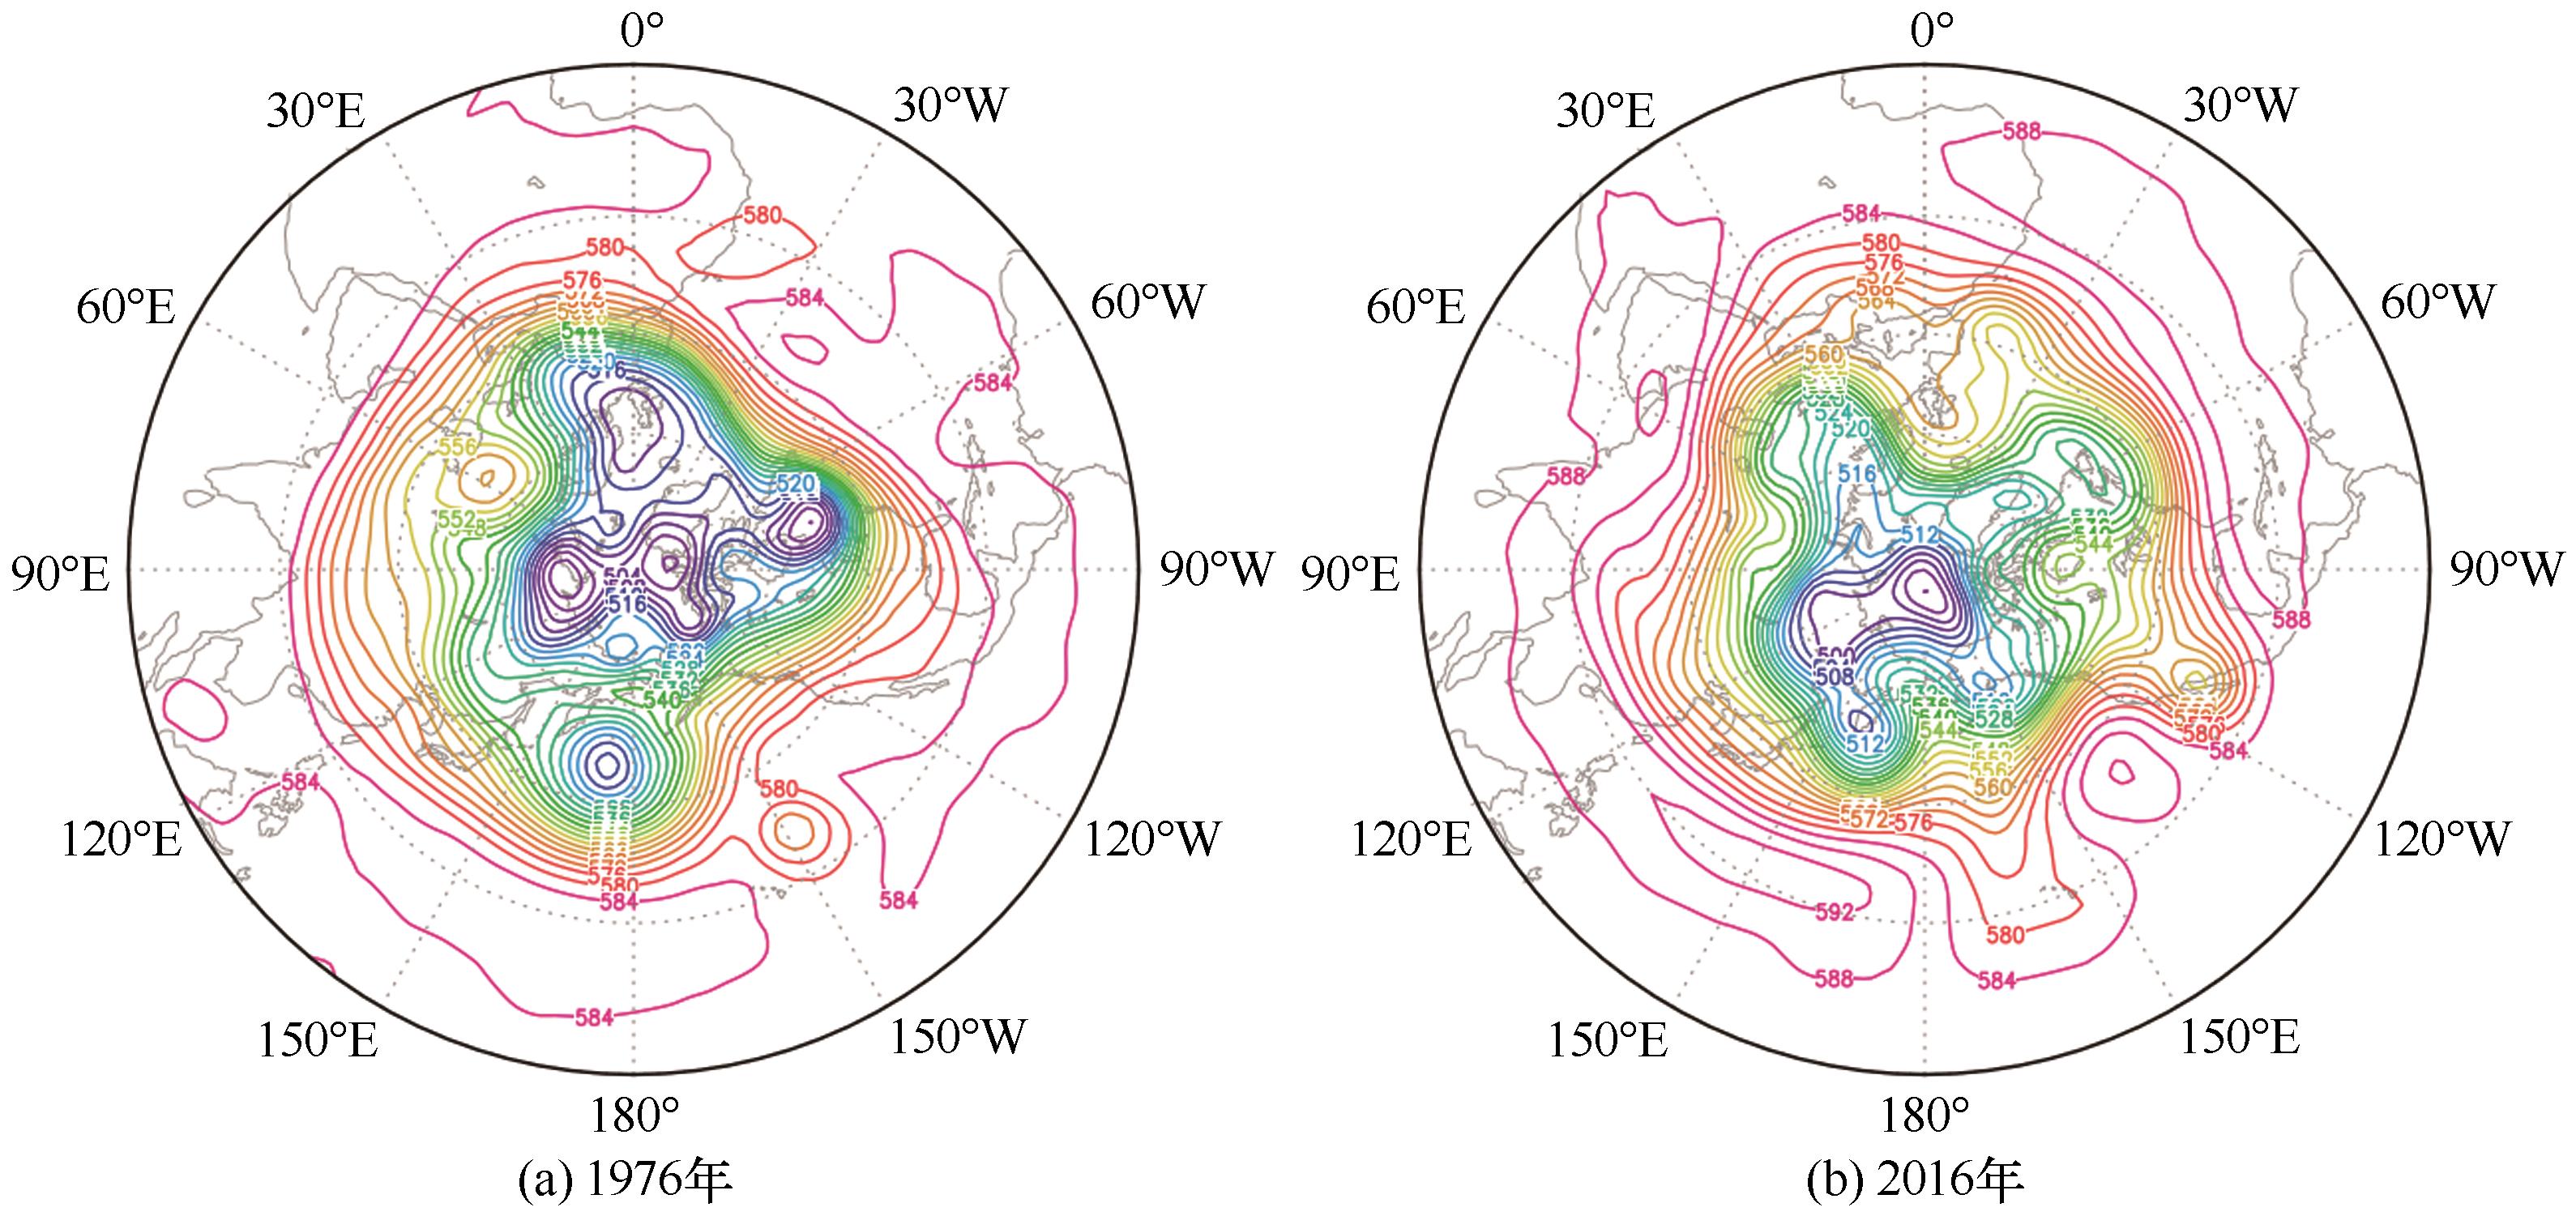
Fig. 5
Spatial distribution of polar vortex in December 1976 (a) and December 2016 (b)
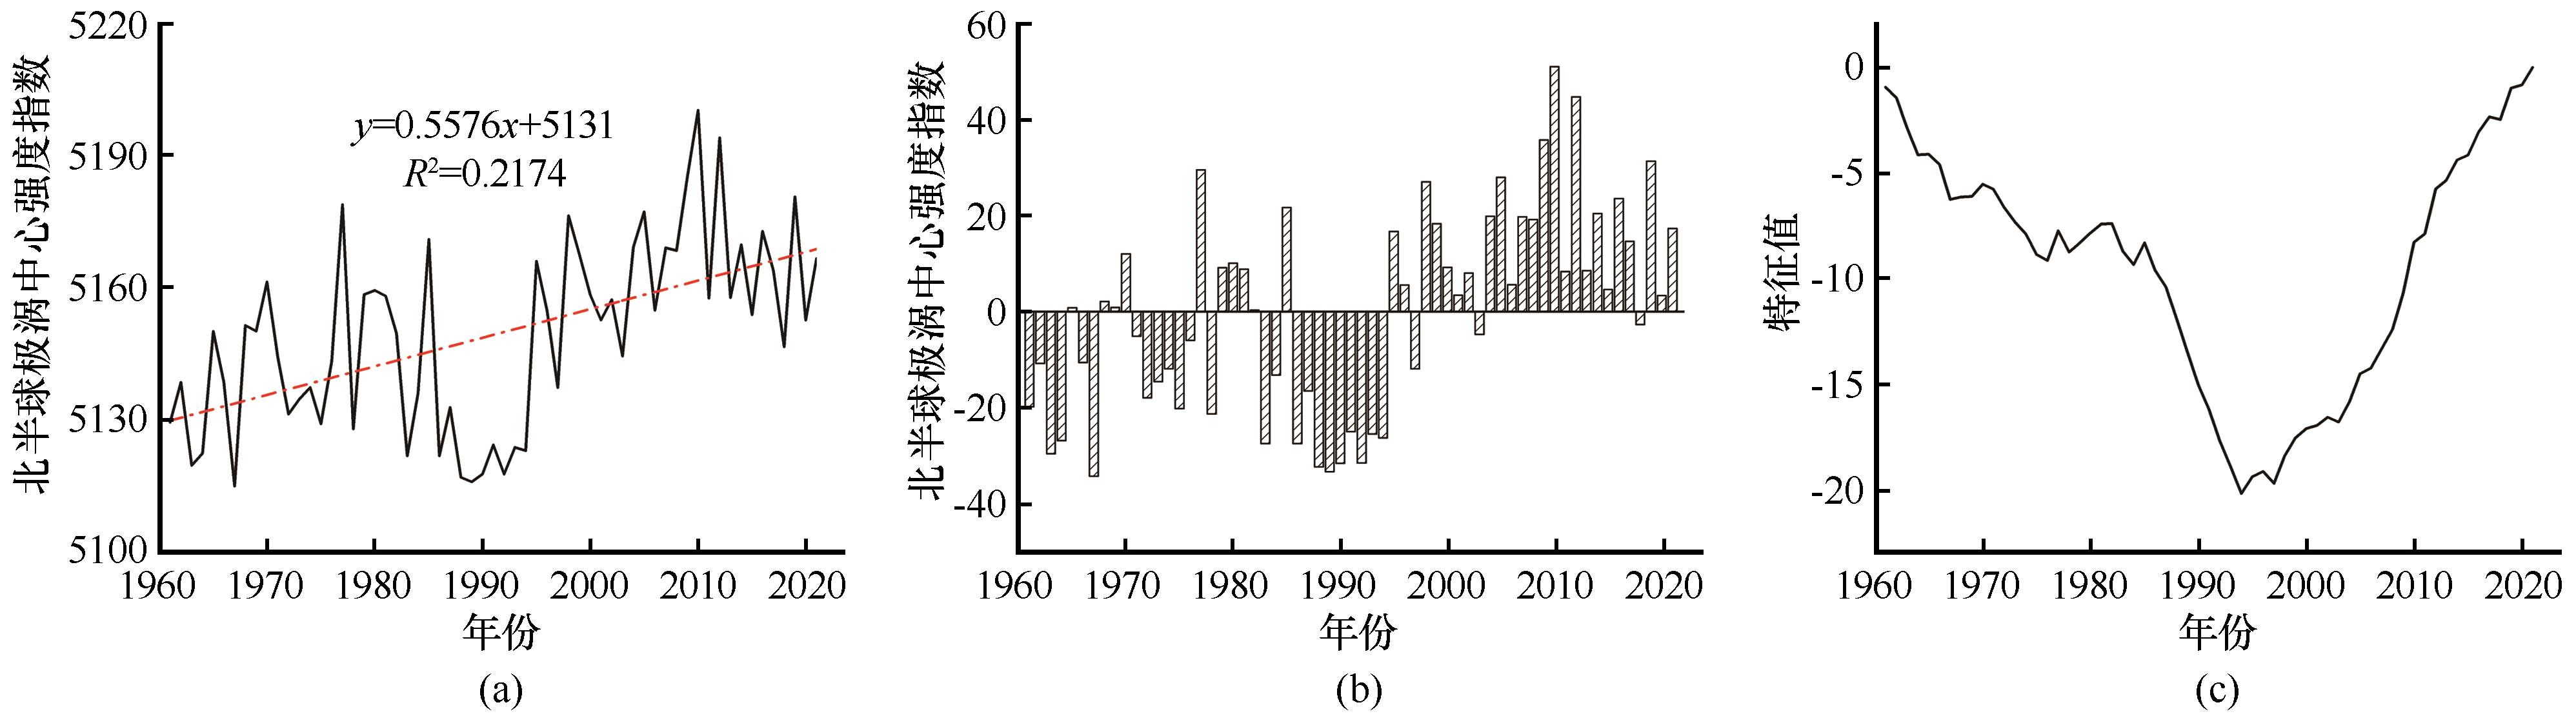
Fig. 6
Distribution of polar vortex central intensity index (a), anomaly map (b), and RAPS abrupt change test diagram (c) from 1961 to 2021
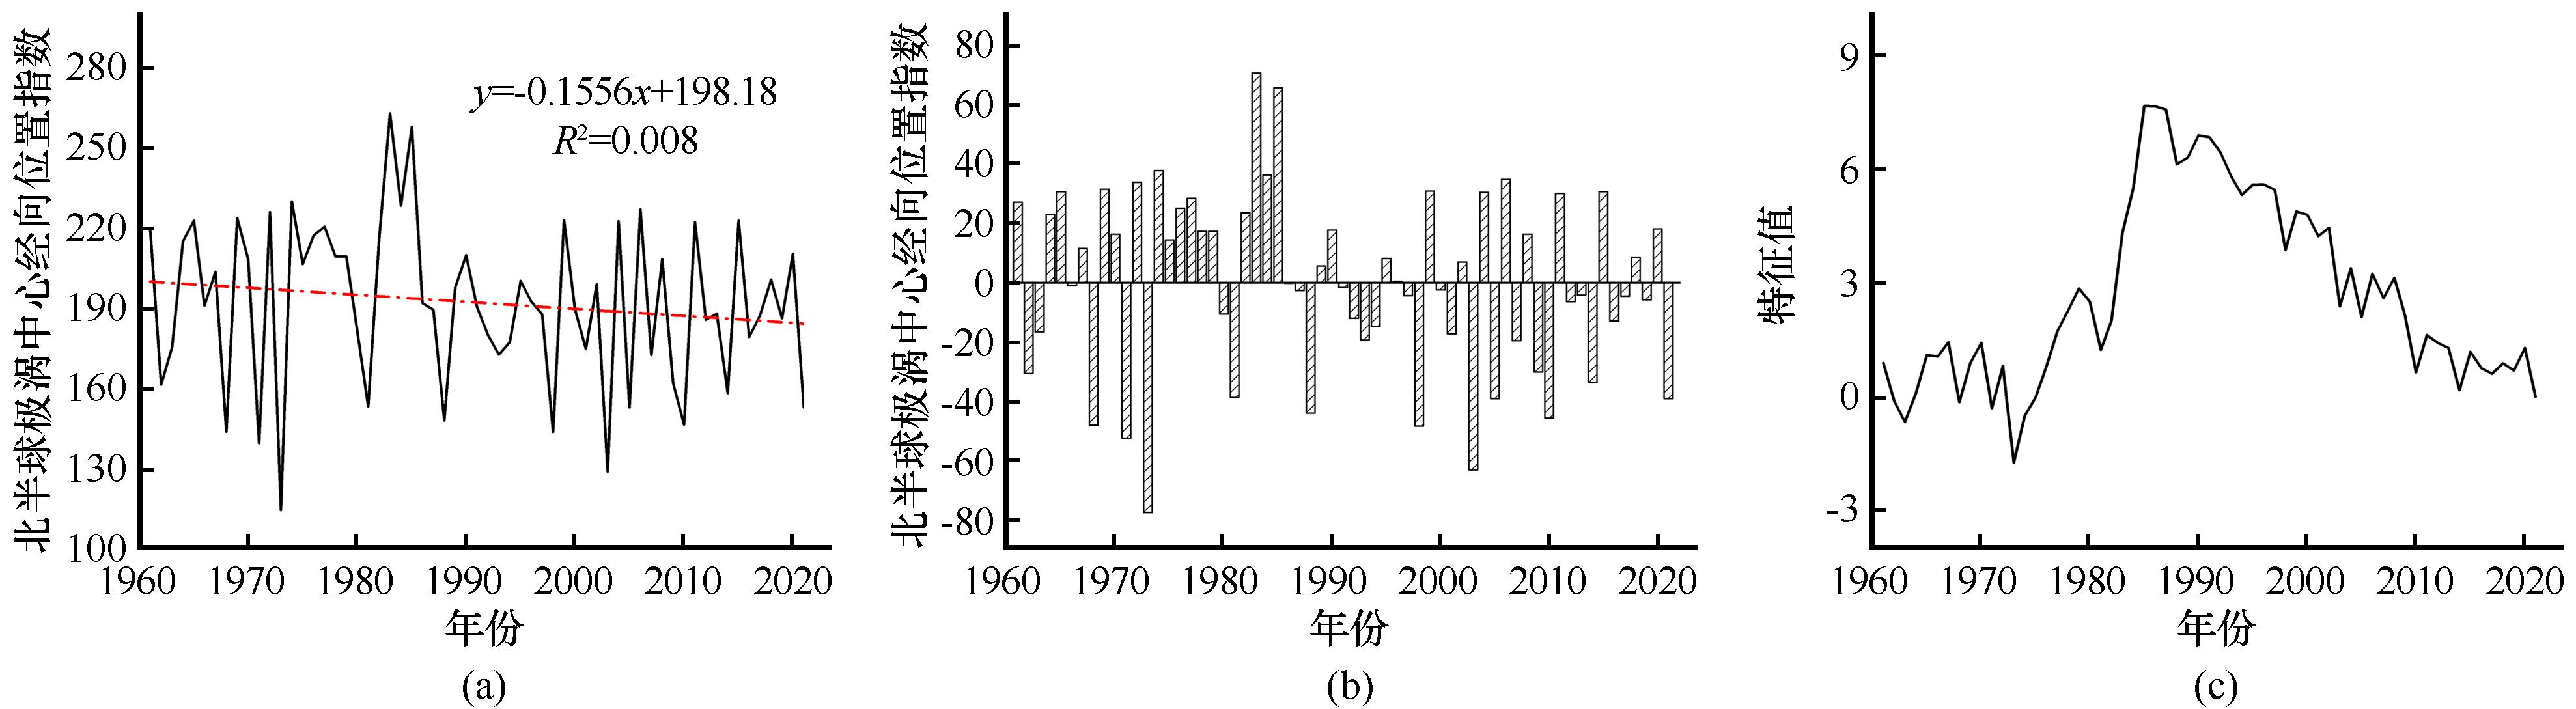
Fig. 7
Distribution of polar vortex central longitude index (a), anomaly map (b), and RAPS abrupt change test diagram (c) from 1961 to 2021
Fig. 8
Distribution of polar vortex central latitude index (a), anomaly map (b), and RAPS abrupt change test diagram (c) from 1961 to 2021
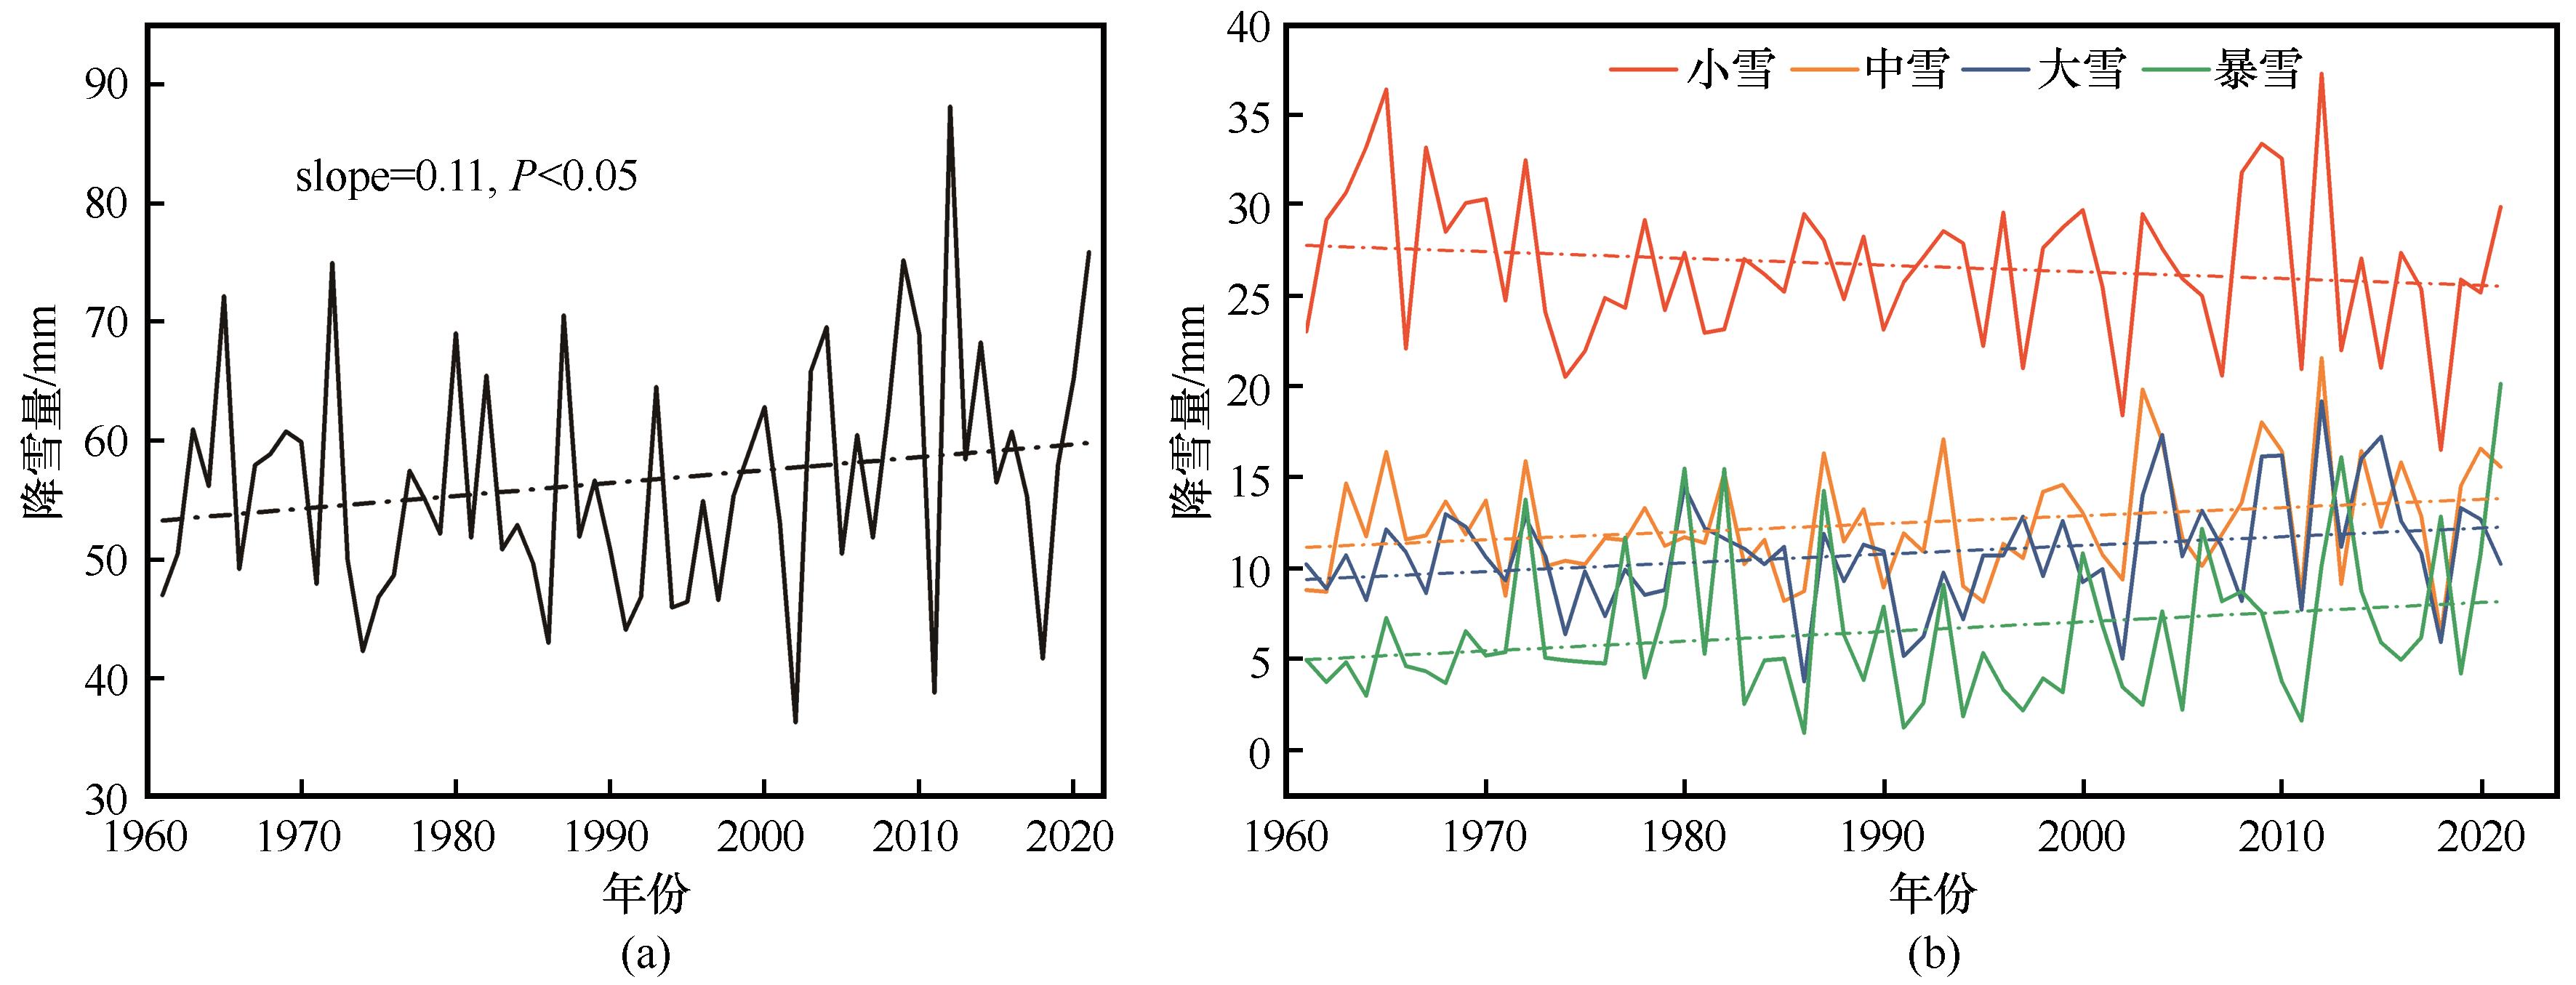
Fig. 9
Annual snowfall amounts (a) and temporal distribution of snowfall amounts of different intensity levels (b) in Songhua River Basin from 1961 to 2021
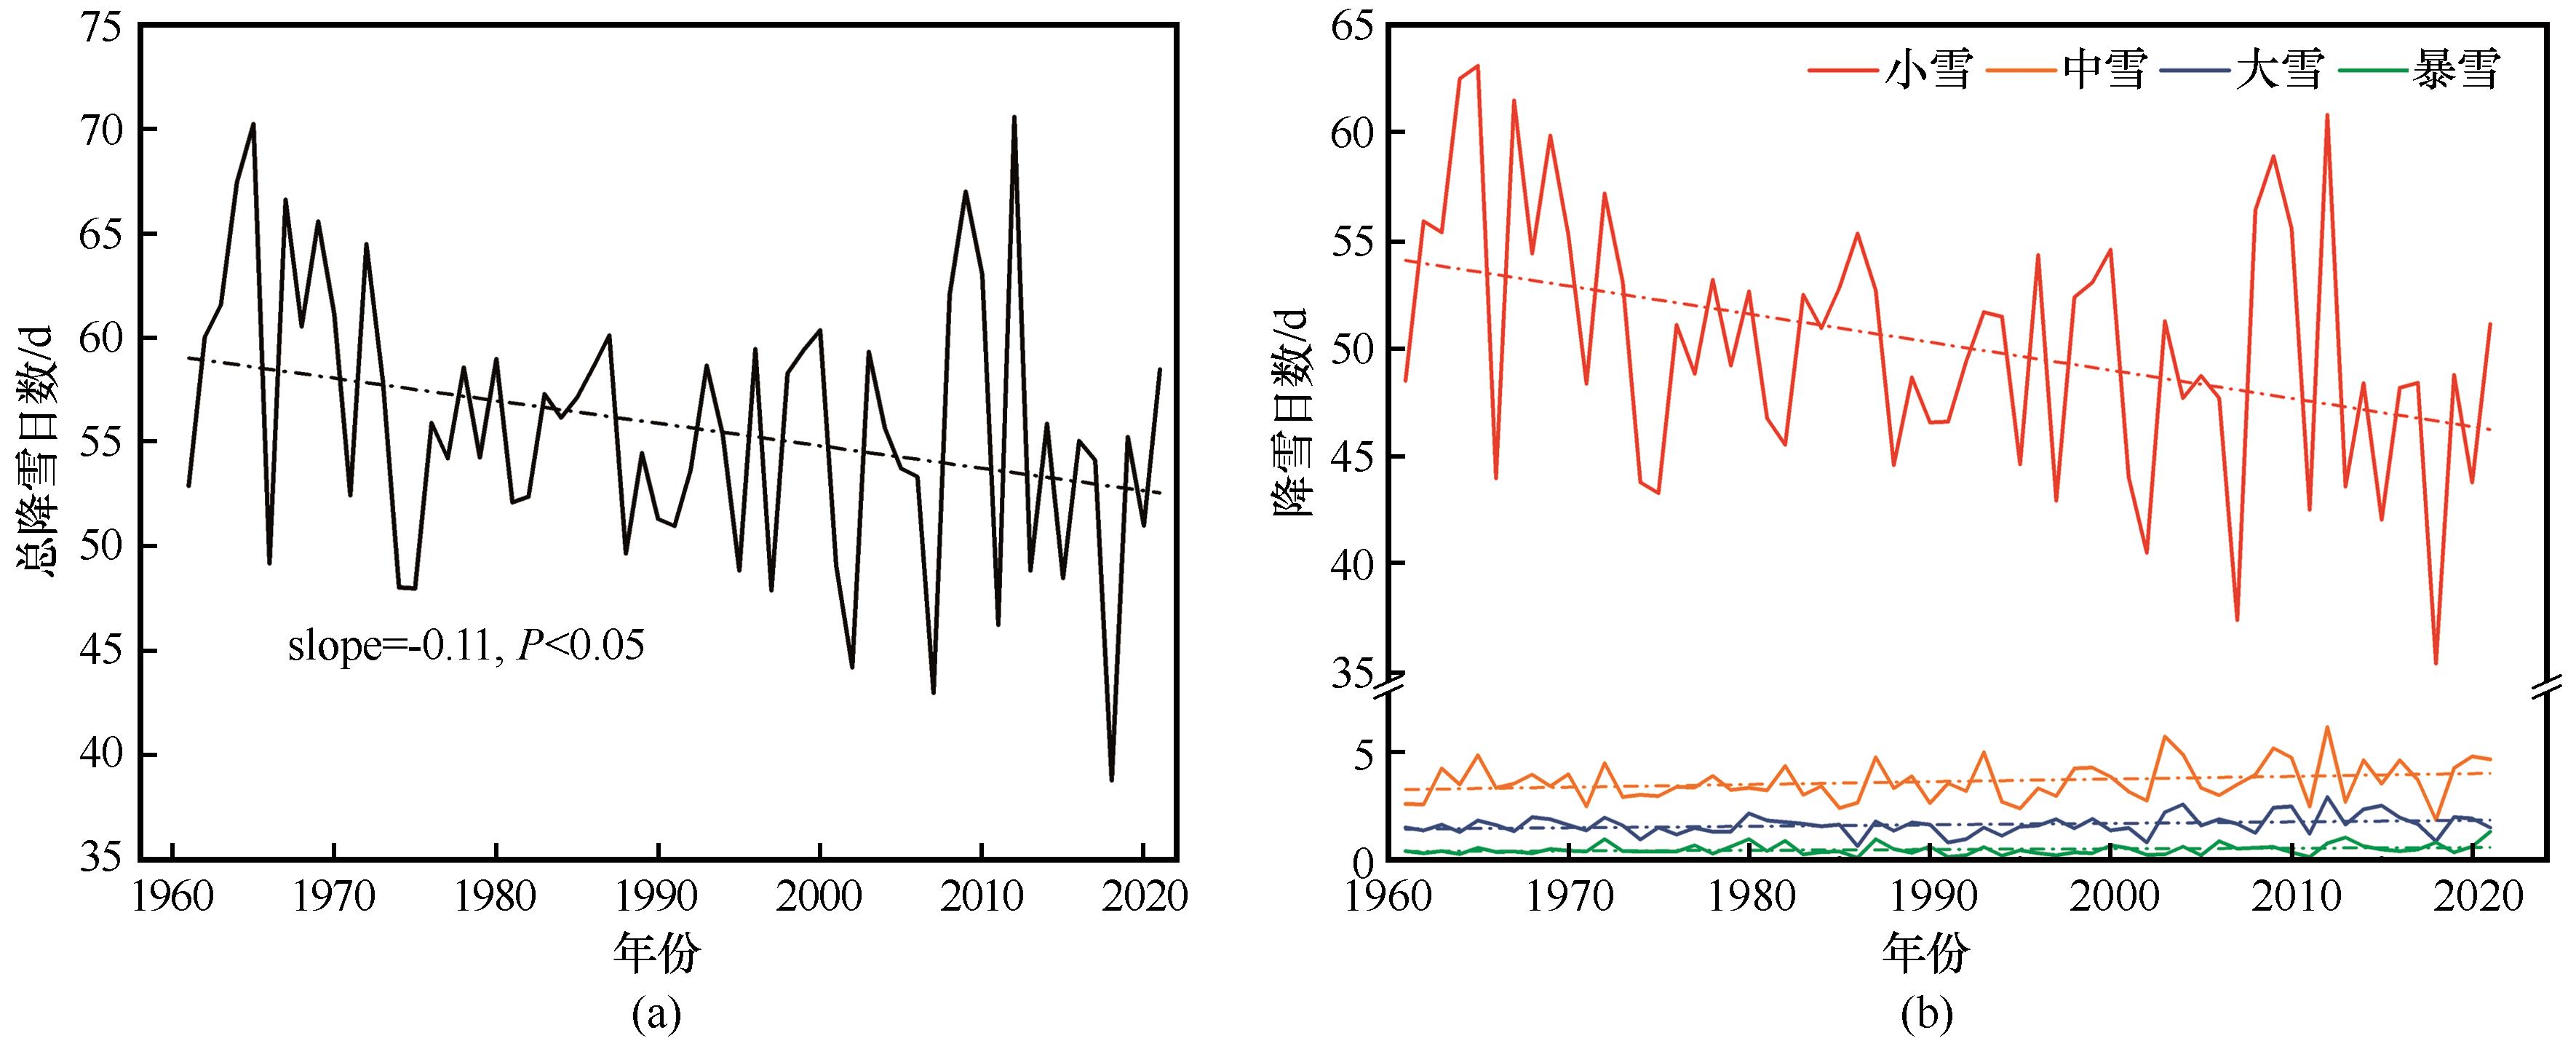
Fig. 10
Annual number of snowfall days (a) and temporal distribution of number of snowfall days of different intensity levels (b) in Songhua River Basin from 1961 to 2021
Table 3
Significant correlations between snowfall in Songhua River and polar vortex (1961—2021)
Fig. 11
Annual snowfall and polar vortex intensity (a) and annual snowfall amounts and polar vortex central intensity index (b) in Songhua River Basin (1961—2021)
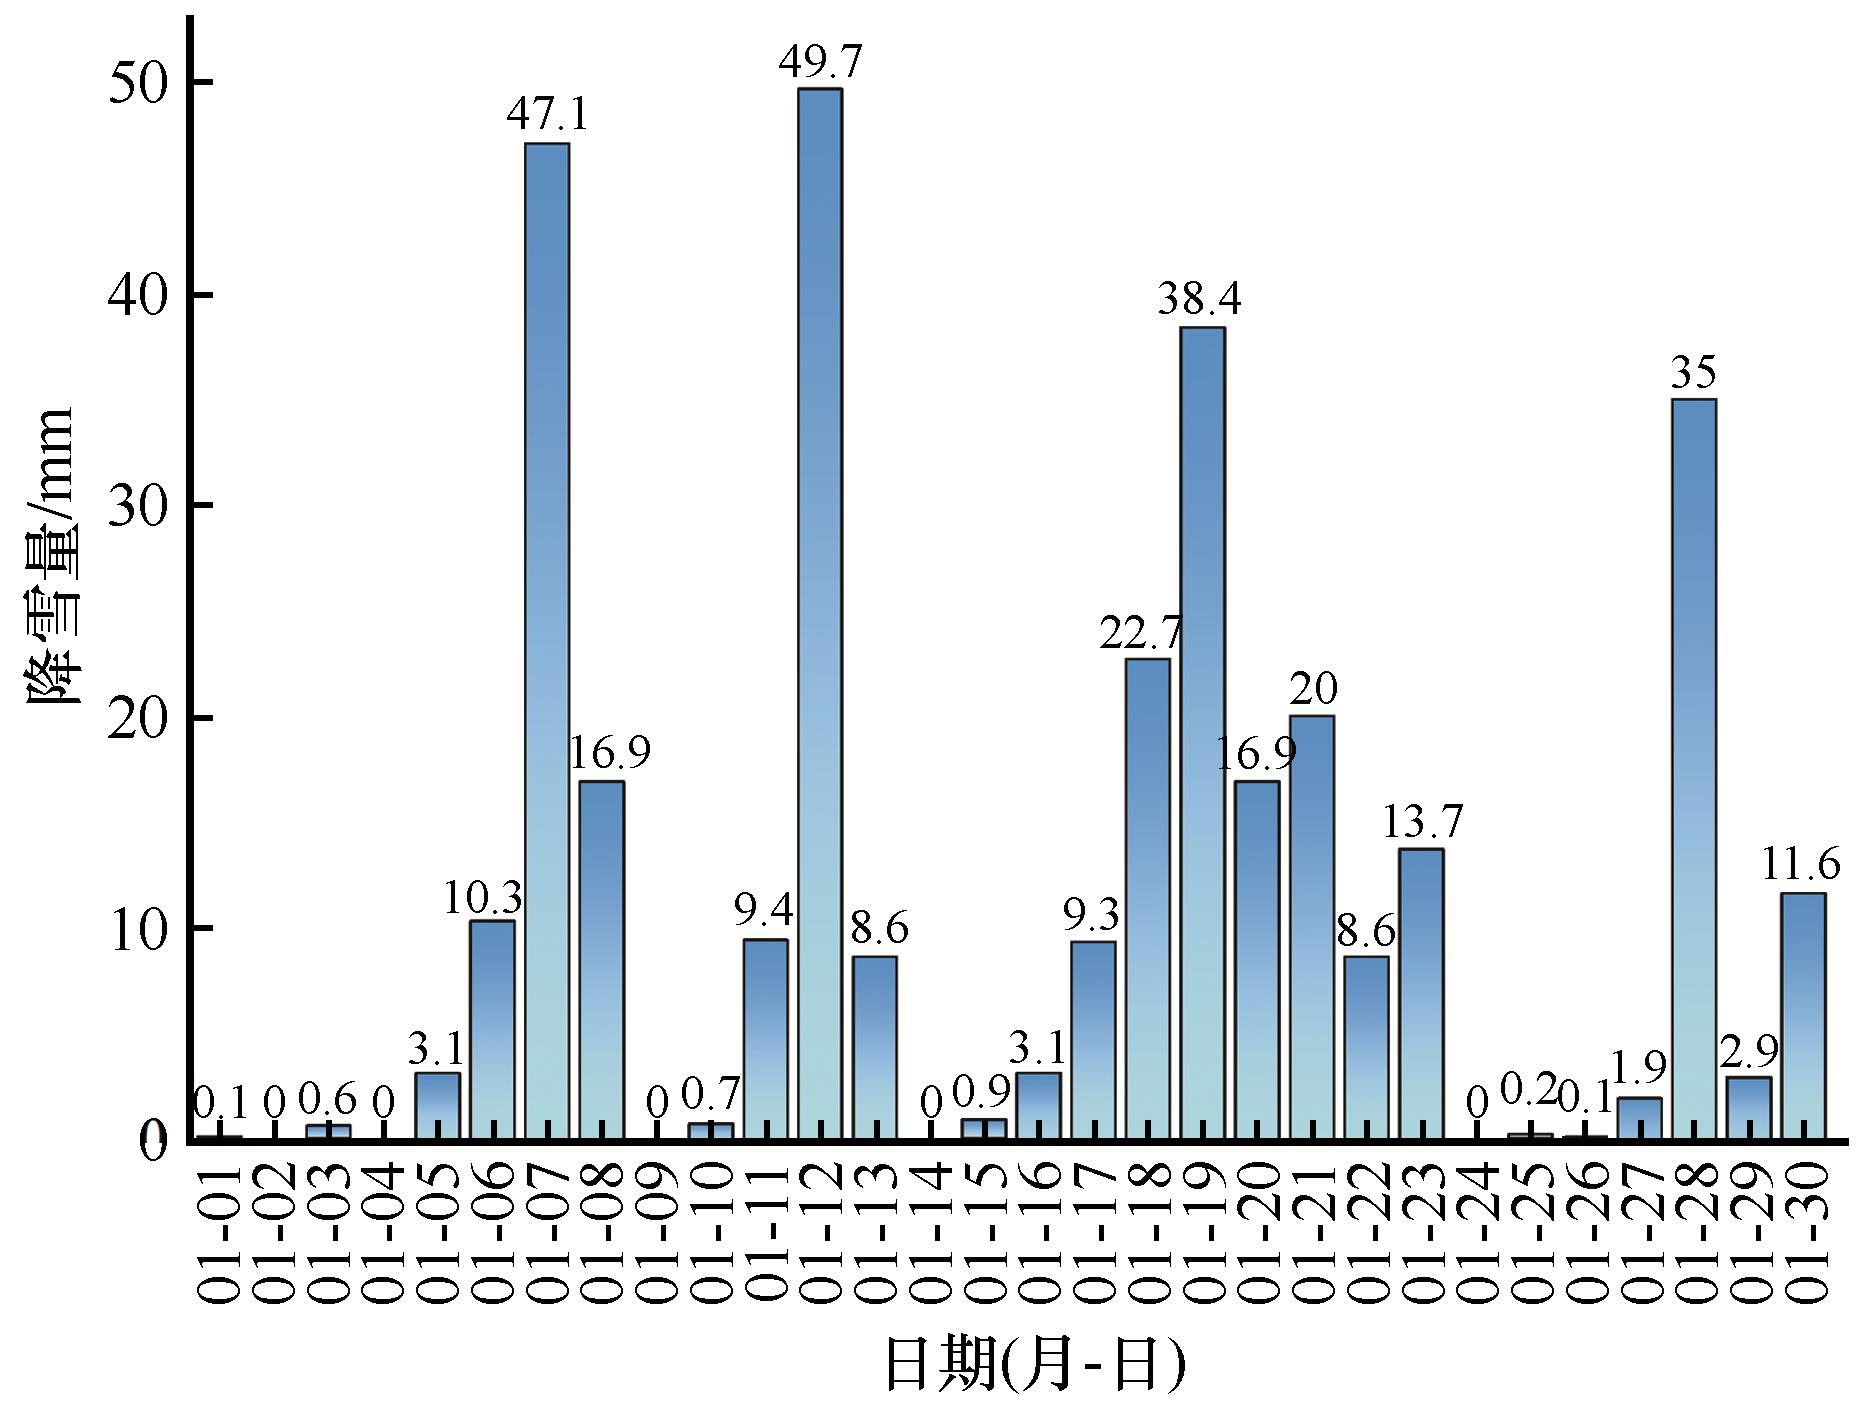
Fig. 12
Temporal distribution of snowfall amounts in Songhua River Basin in January 2022
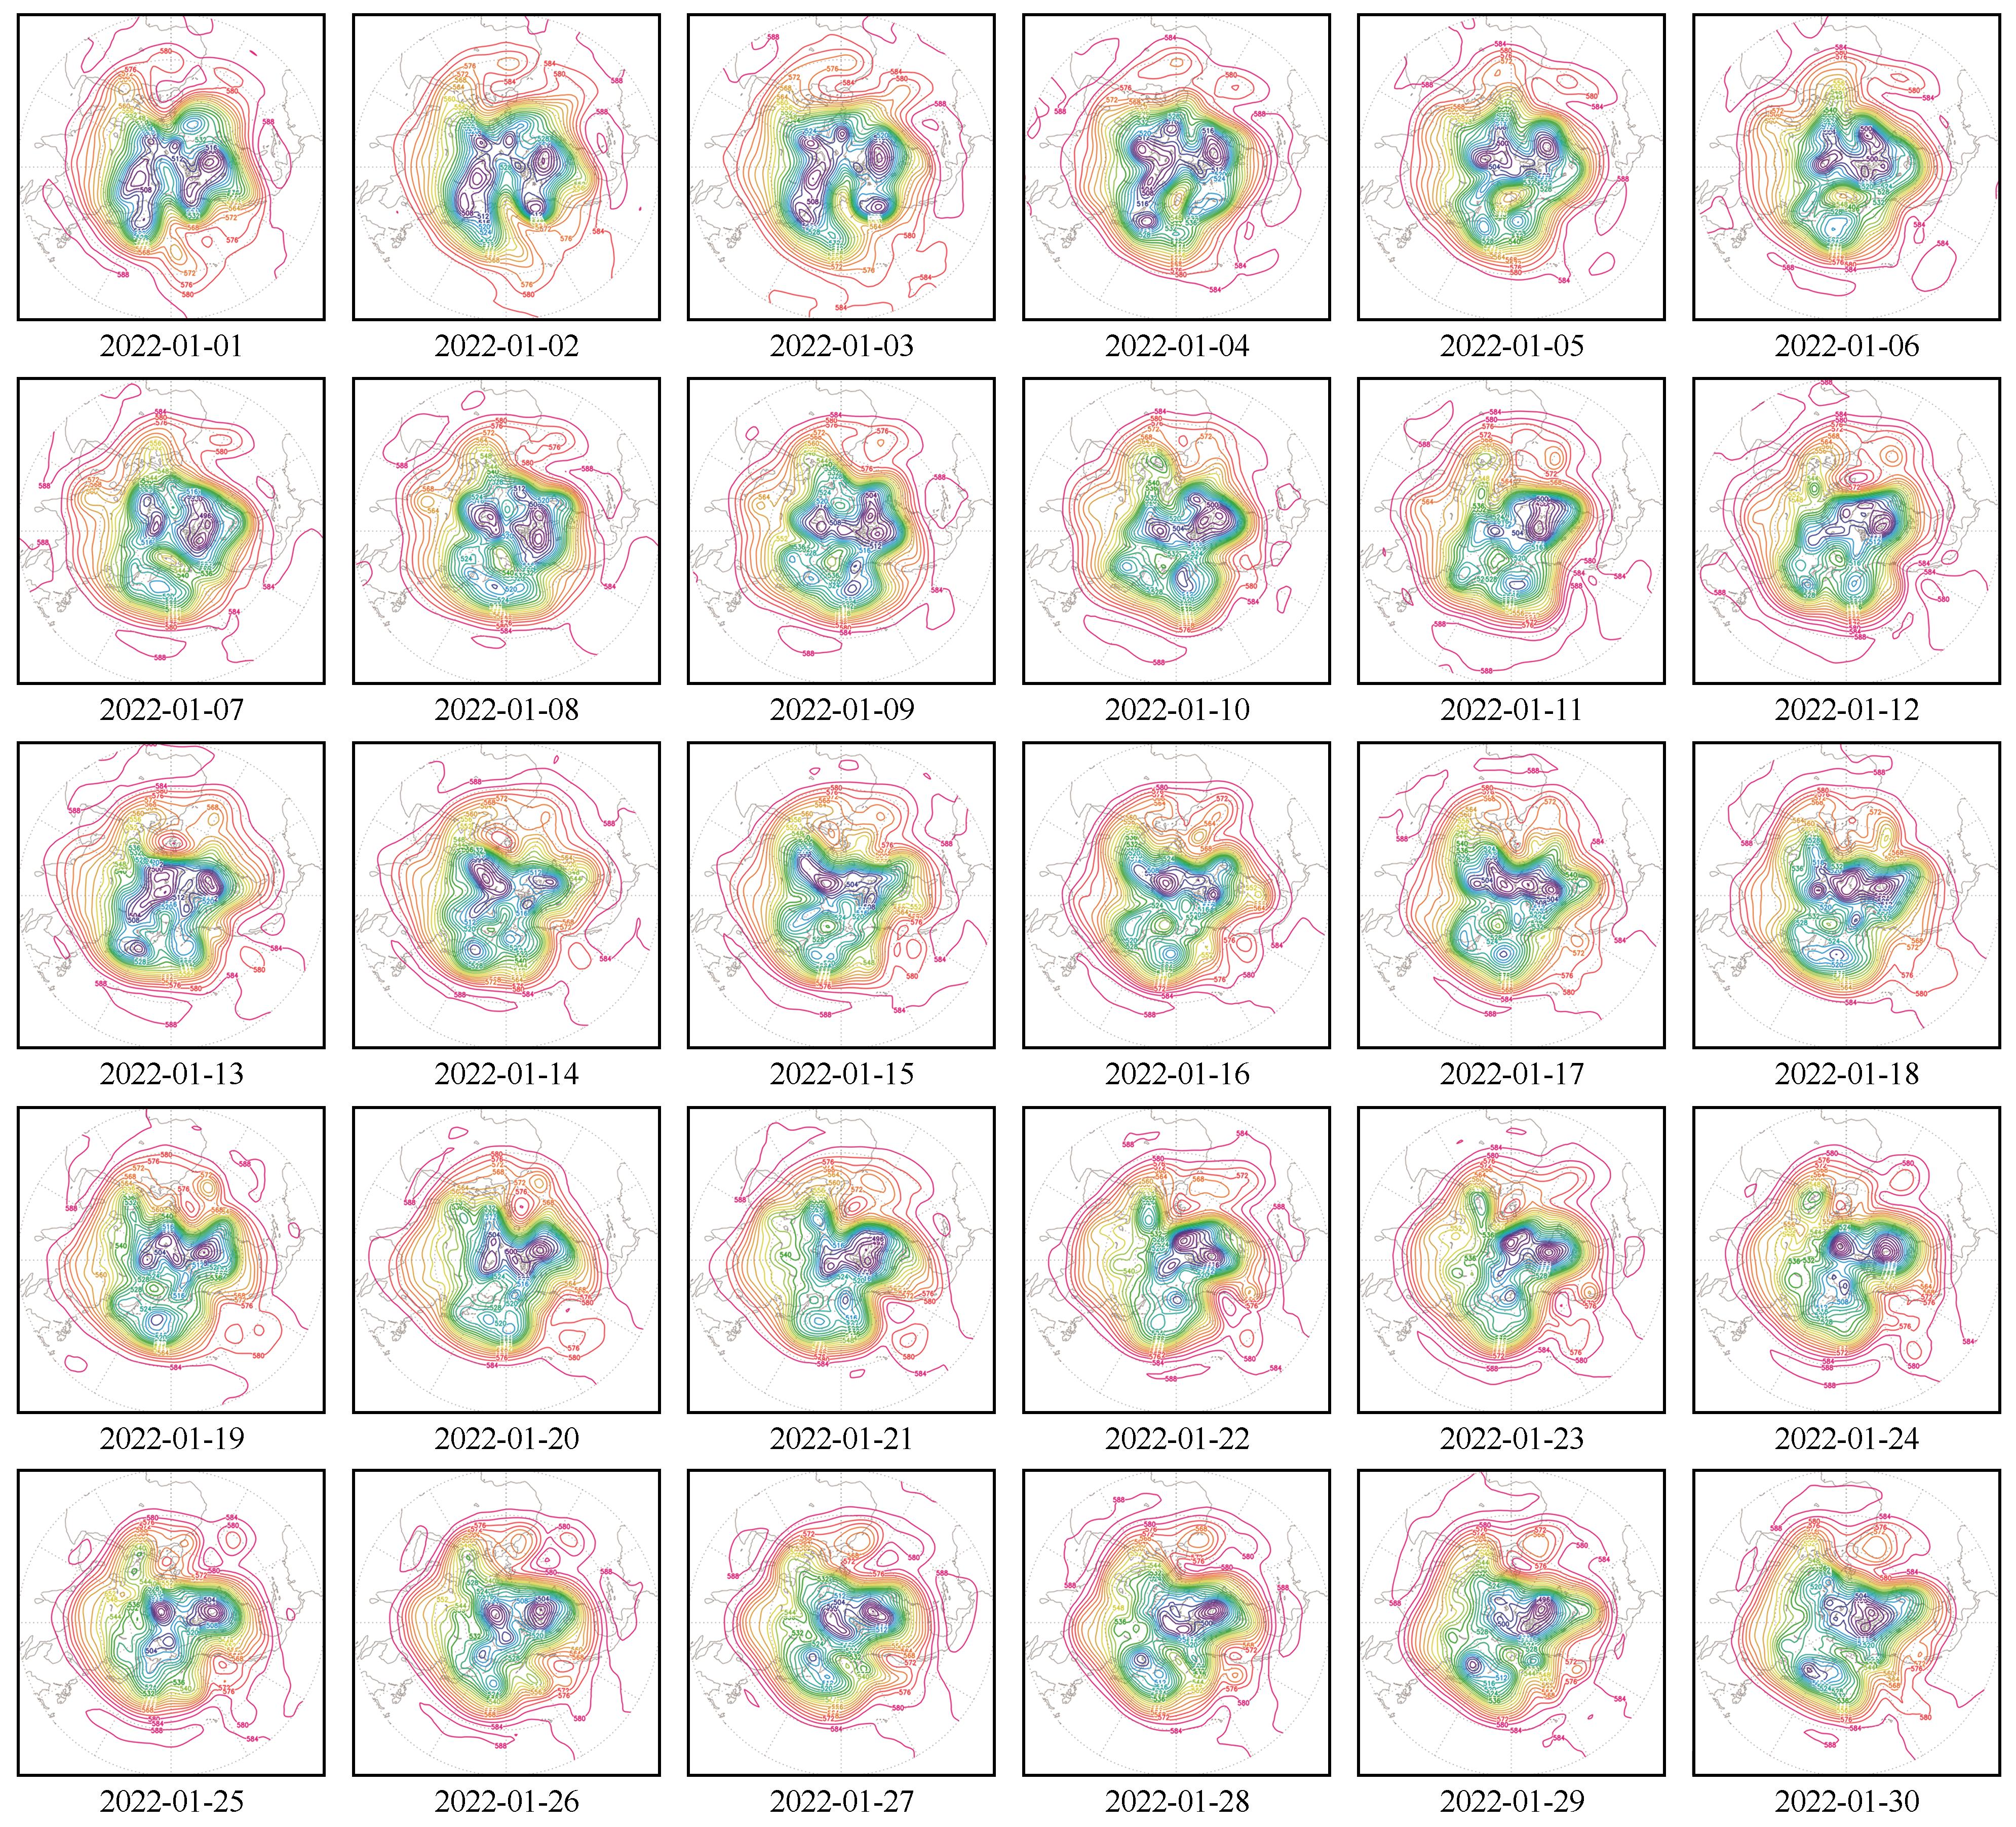
Fig. 13
Daily circulation charts at 500 hPa for January 2022
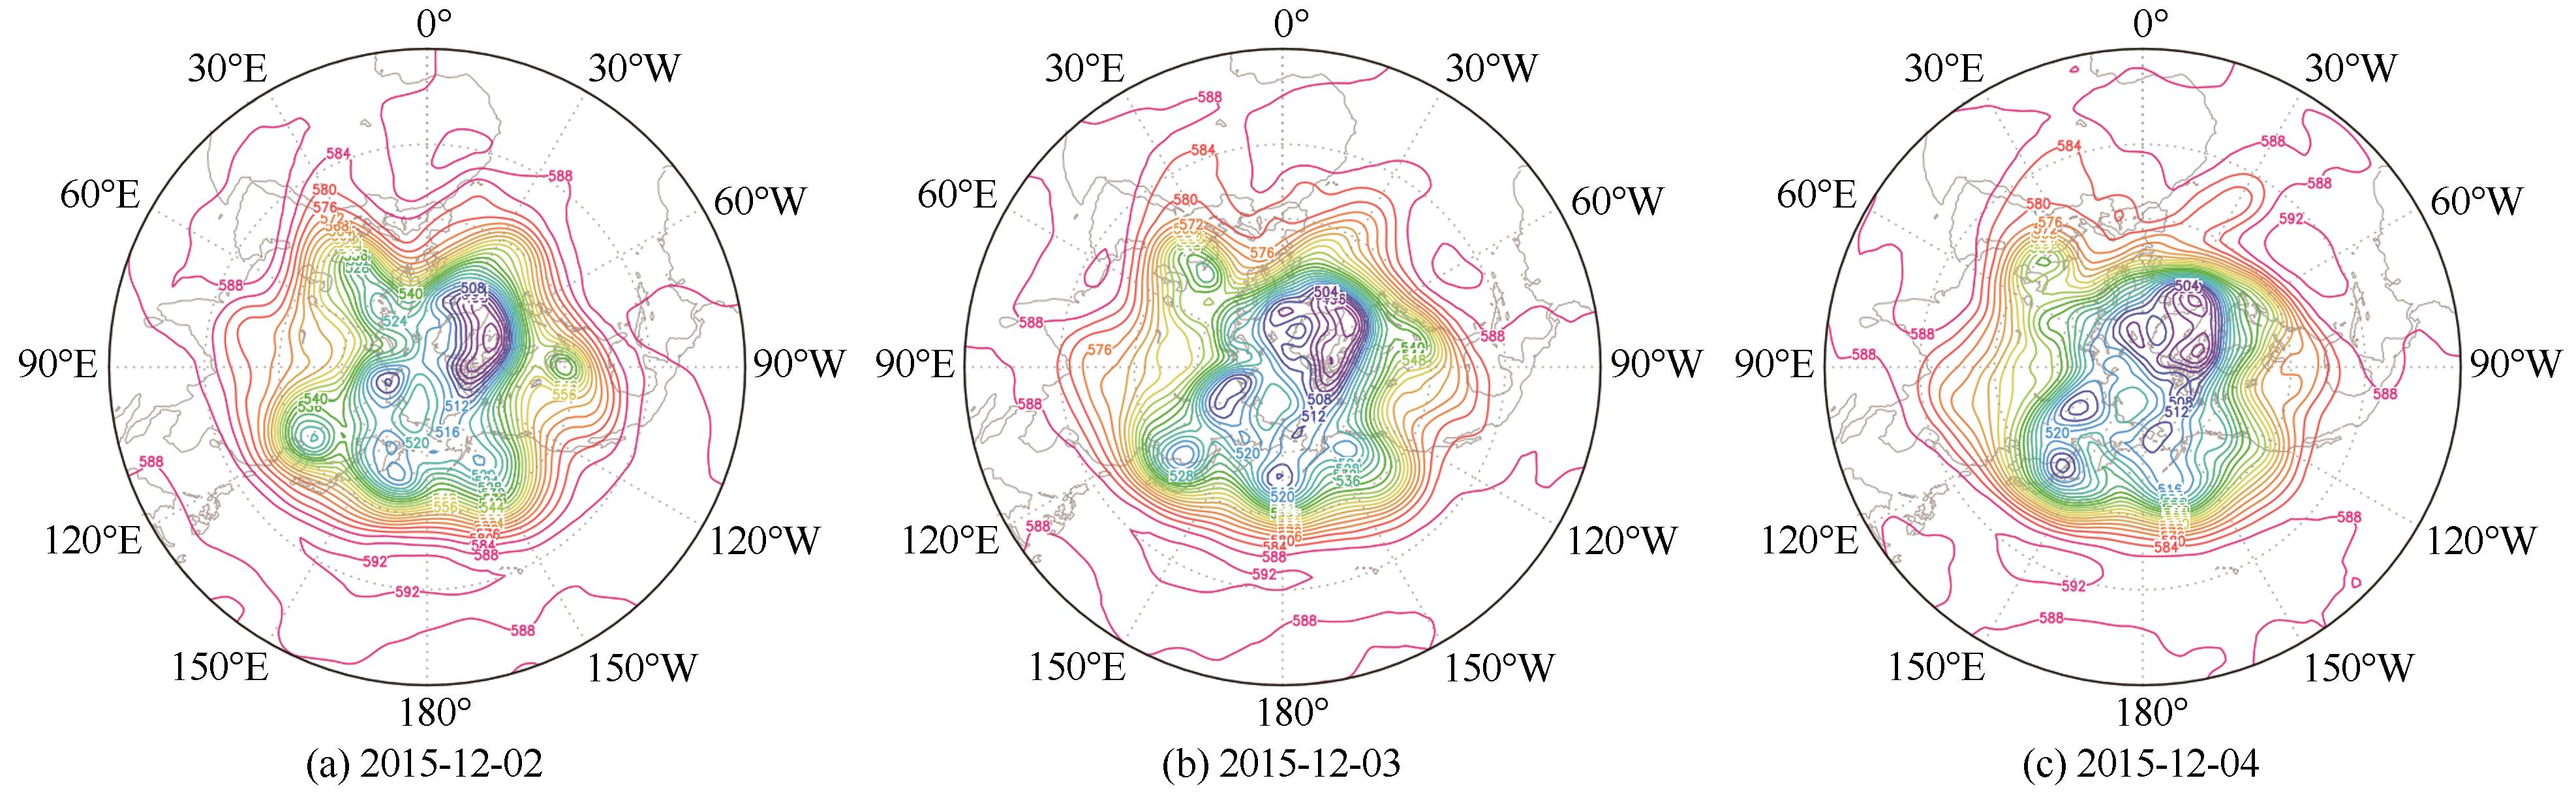
Fig. 14
Circulation charts at 500 hPa on December 2—4, 2015
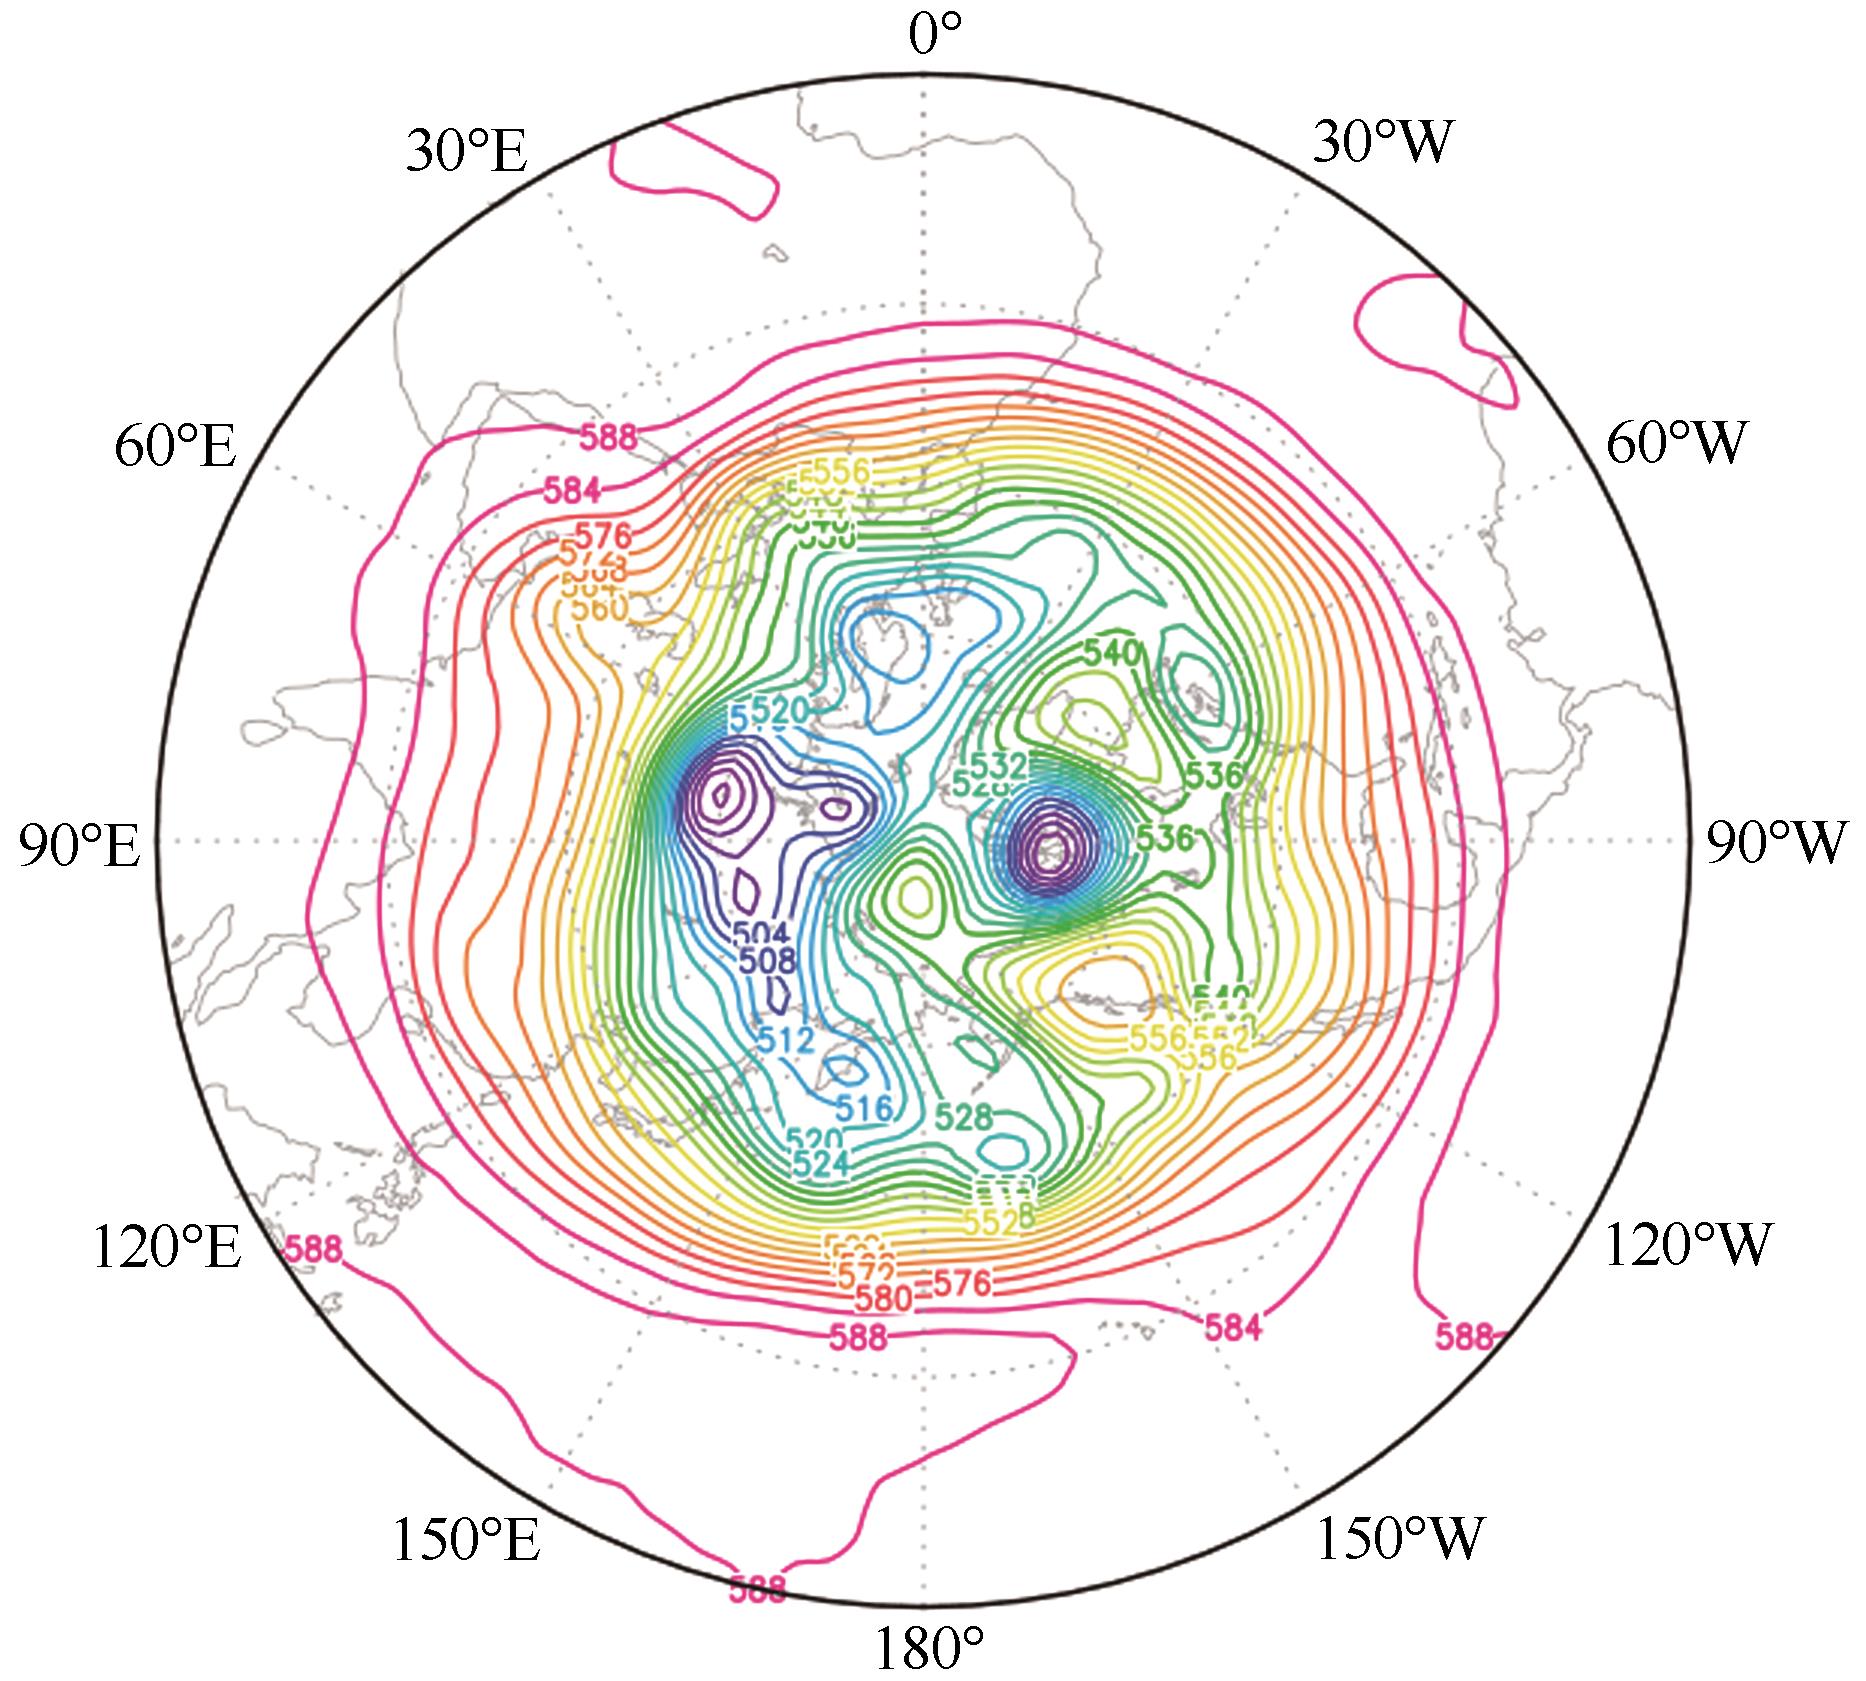
Fig. 15
Circulation chart at 500 hPa on February 21, 2010