Statistics and characteristics of permafrost and ground-ice distribution in the Northern Hemisphere
1
1999
... 多年冻土约占北半球陆地面积的25%[1],其对气候变化尤为敏感[2].青藏高原是全球海拔最高的地区,分布面积高达约1.06×10⁶ km2的多年冻土[3],并以高温高含冰量为特征[4-5].全球气候变暖的背景下,多年冻土呈现退化趋势,表现为多年冻土升温、埋藏深度增大和地下冰融化等,对寒区的工程建筑的稳定性、气候以及水文生态过程都有着重大影响.多年冻土退化导致地基的力学稳定性降低以及引发的地表沉降是影响寒区工程稳定性和安全性的主要因素[6];多年冻土与寒区生态系统之间也存在着相辅相生的共生关系,青藏高原多年冻土退化已经引起高寒草甸生态系统发生变化,甚至出现荒漠化、沙漠化[7-8];随着多年冻土消融,冻土中的碳储量可能被释放,从而放大高原气候变暖效应[9];大量赋存于多年冻土中的地下冰转化为液态水,部分参与到活动层的冻融过程中,而其余部分将参与到区域乃至全球的水循环过程中[10];此外,多年冻土退化导致高原下垫面的能量平衡发生变化,最终可能触发整个北半球气候系统的变化[11-12].因此,准确评估和预估全球气候变暖背景下大时间尺度多年冻土热状况的变化已经成为冰冻圈科学研究的核心环节之一[13]. ...
Recent changes in the active layer thickness across the northern hemisphere
1
2016
... 多年冻土约占北半球陆地面积的25%[1],其对气候变化尤为敏感[2].青藏高原是全球海拔最高的地区,分布面积高达约1.06×10⁶ km2的多年冻土[3],并以高温高含冰量为特征[4-5].全球气候变暖的背景下,多年冻土呈现退化趋势,表现为多年冻土升温、埋藏深度增大和地下冰融化等,对寒区的工程建筑的稳定性、气候以及水文生态过程都有着重大影响.多年冻土退化导致地基的力学稳定性降低以及引发的地表沉降是影响寒区工程稳定性和安全性的主要因素[6];多年冻土与寒区生态系统之间也存在着相辅相生的共生关系,青藏高原多年冻土退化已经引起高寒草甸生态系统发生变化,甚至出现荒漠化、沙漠化[7-8];随着多年冻土消融,冻土中的碳储量可能被释放,从而放大高原气候变暖效应[9];大量赋存于多年冻土中的地下冰转化为液态水,部分参与到活动层的冻融过程中,而其余部分将参与到区域乃至全球的水循环过程中[10];此外,多年冻土退化导致高原下垫面的能量平衡发生变化,最终可能触发整个北半球气候系统的变化[11-12].因此,准确评估和预估全球气候变暖背景下大时间尺度多年冻土热状况的变化已经成为冰冻圈科学研究的核心环节之一[13]. ...
A new map of permafrost distribution on the Tibetan Plateau
1
2017
... 多年冻土约占北半球陆地面积的25%[1],其对气候变化尤为敏感[2].青藏高原是全球海拔最高的地区,分布面积高达约1.06×10⁶ km2的多年冻土[3],并以高温高含冰量为特征[4-5].全球气候变暖的背景下,多年冻土呈现退化趋势,表现为多年冻土升温、埋藏深度增大和地下冰融化等,对寒区的工程建筑的稳定性、气候以及水文生态过程都有着重大影响.多年冻土退化导致地基的力学稳定性降低以及引发的地表沉降是影响寒区工程稳定性和安全性的主要因素[6];多年冻土与寒区生态系统之间也存在着相辅相生的共生关系,青藏高原多年冻土退化已经引起高寒草甸生态系统发生变化,甚至出现荒漠化、沙漠化[7-8];随着多年冻土消融,冻土中的碳储量可能被释放,从而放大高原气候变暖效应[9];大量赋存于多年冻土中的地下冰转化为液态水,部分参与到活动层的冻融过程中,而其余部分将参与到区域乃至全球的水循环过程中[10];此外,多年冻土退化导致高原下垫面的能量平衡发生变化,最终可能触发整个北半球气候系统的变化[11-12].因此,准确评估和预估全球气候变暖背景下大时间尺度多年冻土热状况的变化已经成为冰冻圈科学研究的核心环节之一[13]. ...
The distribution characteristics of permafrost along the Qinghai-Tibet Railway and their response to environmental change
1
2014
... 多年冻土约占北半球陆地面积的25%[1],其对气候变化尤为敏感[2].青藏高原是全球海拔最高的地区,分布面积高达约1.06×10⁶ km2的多年冻土[3],并以高温高含冰量为特征[4-5].全球气候变暖的背景下,多年冻土呈现退化趋势,表现为多年冻土升温、埋藏深度增大和地下冰融化等,对寒区的工程建筑的稳定性、气候以及水文生态过程都有着重大影响.多年冻土退化导致地基的力学稳定性降低以及引发的地表沉降是影响寒区工程稳定性和安全性的主要因素[6];多年冻土与寒区生态系统之间也存在着相辅相生的共生关系,青藏高原多年冻土退化已经引起高寒草甸生态系统发生变化,甚至出现荒漠化、沙漠化[7-8];随着多年冻土消融,冻土中的碳储量可能被释放,从而放大高原气候变暖效应[9];大量赋存于多年冻土中的地下冰转化为液态水,部分参与到活动层的冻融过程中,而其余部分将参与到区域乃至全球的水循环过程中[10];此外,多年冻土退化导致高原下垫面的能量平衡发生变化,最终可能触发整个北半球气候系统的变化[11-12].因此,准确评估和预估全球气候变暖背景下大时间尺度多年冻土热状况的变化已经成为冰冻圈科学研究的核心环节之一[13]. ...
青藏铁路沿线多年冻土分布特征及其对环境变化的响应
1
2014
... 多年冻土约占北半球陆地面积的25%[1],其对气候变化尤为敏感[2].青藏高原是全球海拔最高的地区,分布面积高达约1.06×10⁶ km2的多年冻土[3],并以高温高含冰量为特征[4-5].全球气候变暖的背景下,多年冻土呈现退化趋势,表现为多年冻土升温、埋藏深度增大和地下冰融化等,对寒区的工程建筑的稳定性、气候以及水文生态过程都有着重大影响.多年冻土退化导致地基的力学稳定性降低以及引发的地表沉降是影响寒区工程稳定性和安全性的主要因素[6];多年冻土与寒区生态系统之间也存在着相辅相生的共生关系,青藏高原多年冻土退化已经引起高寒草甸生态系统发生变化,甚至出现荒漠化、沙漠化[7-8];随着多年冻土消融,冻土中的碳储量可能被释放,从而放大高原气候变暖效应[9];大量赋存于多年冻土中的地下冰转化为液态水,部分参与到活动层的冻融过程中,而其余部分将参与到区域乃至全球的水循环过程中[10];此外,多年冻土退化导致高原下垫面的能量平衡发生变化,最终可能触发整个北半球气候系统的变化[11-12].因此,准确评估和预估全球气候变暖背景下大时间尺度多年冻土热状况的变化已经成为冰冻圈科学研究的核心环节之一[13]. ...
Engineering geological characteristic and evalution of permafromast ground along Qinghai-Tibet Railway
1
2008
... 多年冻土约占北半球陆地面积的25%[1],其对气候变化尤为敏感[2].青藏高原是全球海拔最高的地区,分布面积高达约1.06×10⁶ km2的多年冻土[3],并以高温高含冰量为特征[4-5].全球气候变暖的背景下,多年冻土呈现退化趋势,表现为多年冻土升温、埋藏深度增大和地下冰融化等,对寒区的工程建筑的稳定性、气候以及水文生态过程都有着重大影响.多年冻土退化导致地基的力学稳定性降低以及引发的地表沉降是影响寒区工程稳定性和安全性的主要因素[6];多年冻土与寒区生态系统之间也存在着相辅相生的共生关系,青藏高原多年冻土退化已经引起高寒草甸生态系统发生变化,甚至出现荒漠化、沙漠化[7-8];随着多年冻土消融,冻土中的碳储量可能被释放,从而放大高原气候变暖效应[9];大量赋存于多年冻土中的地下冰转化为液态水,部分参与到活动层的冻融过程中,而其余部分将参与到区域乃至全球的水循环过程中[10];此外,多年冻土退化导致高原下垫面的能量平衡发生变化,最终可能触发整个北半球气候系统的变化[11-12].因此,准确评估和预估全球气候变暖背景下大时间尺度多年冻土热状况的变化已经成为冰冻圈科学研究的核心环节之一[13]. ...
青藏铁路多年冻土工程地质特征及其评价
1
2008
... 多年冻土约占北半球陆地面积的25%[1],其对气候变化尤为敏感[2].青藏高原是全球海拔最高的地区,分布面积高达约1.06×10⁶ km2的多年冻土[3],并以高温高含冰量为特征[4-5].全球气候变暖的背景下,多年冻土呈现退化趋势,表现为多年冻土升温、埋藏深度增大和地下冰融化等,对寒区的工程建筑的稳定性、气候以及水文生态过程都有着重大影响.多年冻土退化导致地基的力学稳定性降低以及引发的地表沉降是影响寒区工程稳定性和安全性的主要因素[6];多年冻土与寒区生态系统之间也存在着相辅相生的共生关系,青藏高原多年冻土退化已经引起高寒草甸生态系统发生变化,甚至出现荒漠化、沙漠化[7-8];随着多年冻土消融,冻土中的碳储量可能被释放,从而放大高原气候变暖效应[9];大量赋存于多年冻土中的地下冰转化为液态水,部分参与到活动层的冻融过程中,而其余部分将参与到区域乃至全球的水循环过程中[10];此外,多年冻土退化导致高原下垫面的能量平衡发生变化,最终可能触发整个北半球气候系统的变化[11-12].因此,准确评估和预估全球气候变暖背景下大时间尺度多年冻土热状况的变化已经成为冰冻圈科学研究的核心环节之一[13]. ...
Interactions between the frozen-soil and engineering environments in the cold regions
1
2000
... 多年冻土约占北半球陆地面积的25%[1],其对气候变化尤为敏感[2].青藏高原是全球海拔最高的地区,分布面积高达约1.06×10⁶ km2的多年冻土[3],并以高温高含冰量为特征[4-5].全球气候变暖的背景下,多年冻土呈现退化趋势,表现为多年冻土升温、埋藏深度增大和地下冰融化等,对寒区的工程建筑的稳定性、气候以及水文生态过程都有着重大影响.多年冻土退化导致地基的力学稳定性降低以及引发的地表沉降是影响寒区工程稳定性和安全性的主要因素[6];多年冻土与寒区生态系统之间也存在着相辅相生的共生关系,青藏高原多年冻土退化已经引起高寒草甸生态系统发生变化,甚至出现荒漠化、沙漠化[7-8];随着多年冻土消融,冻土中的碳储量可能被释放,从而放大高原气候变暖效应[9];大量赋存于多年冻土中的地下冰转化为液态水,部分参与到活动层的冻融过程中,而其余部分将参与到区域乃至全球的水循环过程中[10];此外,多年冻土退化导致高原下垫面的能量平衡发生变化,最终可能触发整个北半球气候系统的变化[11-12].因此,准确评估和预估全球气候变暖背景下大时间尺度多年冻土热状况的变化已经成为冰冻圈科学研究的核心环节之一[13]. ...
寒区冻土环境与工程环境间的相互作用
1
2000
... 多年冻土约占北半球陆地面积的25%[1],其对气候变化尤为敏感[2].青藏高原是全球海拔最高的地区,分布面积高达约1.06×10⁶ km2的多年冻土[3],并以高温高含冰量为特征[4-5].全球气候变暖的背景下,多年冻土呈现退化趋势,表现为多年冻土升温、埋藏深度增大和地下冰融化等,对寒区的工程建筑的稳定性、气候以及水文生态过程都有着重大影响.多年冻土退化导致地基的力学稳定性降低以及引发的地表沉降是影响寒区工程稳定性和安全性的主要因素[6];多年冻土与寒区生态系统之间也存在着相辅相生的共生关系,青藏高原多年冻土退化已经引起高寒草甸生态系统发生变化,甚至出现荒漠化、沙漠化[7-8];随着多年冻土消融,冻土中的碳储量可能被释放,从而放大高原气候变暖效应[9];大量赋存于多年冻土中的地下冰转化为液态水,部分参与到活动层的冻融过程中,而其余部分将参与到区域乃至全球的水循环过程中[10];此外,多年冻土退化导致高原下垫面的能量平衡发生变化,最终可能触发整个北半球气候系统的变化[11-12].因此,准确评估和预估全球气候变暖背景下大时间尺度多年冻土热状况的变化已经成为冰冻圈科学研究的核心环节之一[13]. ...
Relationship between frozen soil together with its water-heat process and ecological environment in the Tibetan Plateau
1
2003
... 多年冻土约占北半球陆地面积的25%[1],其对气候变化尤为敏感[2].青藏高原是全球海拔最高的地区,分布面积高达约1.06×10⁶ km2的多年冻土[3],并以高温高含冰量为特征[4-5].全球气候变暖的背景下,多年冻土呈现退化趋势,表现为多年冻土升温、埋藏深度增大和地下冰融化等,对寒区的工程建筑的稳定性、气候以及水文生态过程都有着重大影响.多年冻土退化导致地基的力学稳定性降低以及引发的地表沉降是影响寒区工程稳定性和安全性的主要因素[6];多年冻土与寒区生态系统之间也存在着相辅相生的共生关系,青藏高原多年冻土退化已经引起高寒草甸生态系统发生变化,甚至出现荒漠化、沙漠化[7-8];随着多年冻土消融,冻土中的碳储量可能被释放,从而放大高原气候变暖效应[9];大量赋存于多年冻土中的地下冰转化为液态水,部分参与到活动层的冻融过程中,而其余部分将参与到区域乃至全球的水循环过程中[10];此外,多年冻土退化导致高原下垫面的能量平衡发生变化,最终可能触发整个北半球气候系统的变化[11-12].因此,准确评估和预估全球气候变暖背景下大时间尺度多年冻土热状况的变化已经成为冰冻圈科学研究的核心环节之一[13]. ...
青藏高原冻土及水热过程与寒区生态环境的关系
1
2003
... 多年冻土约占北半球陆地面积的25%[1],其对气候变化尤为敏感[2].青藏高原是全球海拔最高的地区,分布面积高达约1.06×10⁶ km2的多年冻土[3],并以高温高含冰量为特征[4-5].全球气候变暖的背景下,多年冻土呈现退化趋势,表现为多年冻土升温、埋藏深度增大和地下冰融化等,对寒区的工程建筑的稳定性、气候以及水文生态过程都有着重大影响.多年冻土退化导致地基的力学稳定性降低以及引发的地表沉降是影响寒区工程稳定性和安全性的主要因素[6];多年冻土与寒区生态系统之间也存在着相辅相生的共生关系,青藏高原多年冻土退化已经引起高寒草甸生态系统发生变化,甚至出现荒漠化、沙漠化[7-8];随着多年冻土消融,冻土中的碳储量可能被释放,从而放大高原气候变暖效应[9];大量赋存于多年冻土中的地下冰转化为液态水,部分参与到活动层的冻融过程中,而其余部分将参与到区域乃至全球的水循环过程中[10];此外,多年冻土退化导致高原下垫面的能量平衡发生变化,最终可能触发整个北半球气候系统的变化[11-12].因此,准确评估和预估全球气候变暖背景下大时间尺度多年冻土热状况的变化已经成为冰冻圈科学研究的核心环节之一[13]. ...
Impacts of permafrost changes on alpine ecosystem in Qinghai-Tibet Plateau
1
2006
... 多年冻土约占北半球陆地面积的25%[1],其对气候变化尤为敏感[2].青藏高原是全球海拔最高的地区,分布面积高达约1.06×10⁶ km2的多年冻土[3],并以高温高含冰量为特征[4-5].全球气候变暖的背景下,多年冻土呈现退化趋势,表现为多年冻土升温、埋藏深度增大和地下冰融化等,对寒区的工程建筑的稳定性、气候以及水文生态过程都有着重大影响.多年冻土退化导致地基的力学稳定性降低以及引发的地表沉降是影响寒区工程稳定性和安全性的主要因素[6];多年冻土与寒区生态系统之间也存在着相辅相生的共生关系,青藏高原多年冻土退化已经引起高寒草甸生态系统发生变化,甚至出现荒漠化、沙漠化[7-8];随着多年冻土消融,冻土中的碳储量可能被释放,从而放大高原气候变暖效应[9];大量赋存于多年冻土中的地下冰转化为液态水,部分参与到活动层的冻融过程中,而其余部分将参与到区域乃至全球的水循环过程中[10];此外,多年冻土退化导致高原下垫面的能量平衡发生变化,最终可能触发整个北半球气候系统的变化[11-12].因此,准确评估和预估全球气候变暖背景下大时间尺度多年冻土热状况的变化已经成为冰冻圈科学研究的核心环节之一[13]. ...
青藏高原冻土区冻土与植被的关系及其对高寒生态系统的影响
1
2006
... 多年冻土约占北半球陆地面积的25%[1],其对气候变化尤为敏感[2].青藏高原是全球海拔最高的地区,分布面积高达约1.06×10⁶ km2的多年冻土[3],并以高温高含冰量为特征[4-5].全球气候变暖的背景下,多年冻土呈现退化趋势,表现为多年冻土升温、埋藏深度增大和地下冰融化等,对寒区的工程建筑的稳定性、气候以及水文生态过程都有着重大影响.多年冻土退化导致地基的力学稳定性降低以及引发的地表沉降是影响寒区工程稳定性和安全性的主要因素[6];多年冻土与寒区生态系统之间也存在着相辅相生的共生关系,青藏高原多年冻土退化已经引起高寒草甸生态系统发生变化,甚至出现荒漠化、沙漠化[7-8];随着多年冻土消融,冻土中的碳储量可能被释放,从而放大高原气候变暖效应[9];大量赋存于多年冻土中的地下冰转化为液态水,部分参与到活动层的冻融过程中,而其余部分将参与到区域乃至全球的水循环过程中[10];此外,多年冻土退化导致高原下垫面的能量平衡发生变化,最终可能触发整个北半球气候系统的变化[11-12].因此,准确评估和预估全球气候变暖背景下大时间尺度多年冻土热状况的变化已经成为冰冻圈科学研究的核心环节之一[13]. ...
Permafrost collapse alters soil carbon stocks, respiration, CH4, and N2O in upland tundra
1
2015
... 多年冻土约占北半球陆地面积的25%[1],其对气候变化尤为敏感[2].青藏高原是全球海拔最高的地区,分布面积高达约1.06×10⁶ km2的多年冻土[3],并以高温高含冰量为特征[4-5].全球气候变暖的背景下,多年冻土呈现退化趋势,表现为多年冻土升温、埋藏深度增大和地下冰融化等,对寒区的工程建筑的稳定性、气候以及水文生态过程都有着重大影响.多年冻土退化导致地基的力学稳定性降低以及引发的地表沉降是影响寒区工程稳定性和安全性的主要因素[6];多年冻土与寒区生态系统之间也存在着相辅相生的共生关系,青藏高原多年冻土退化已经引起高寒草甸生态系统发生变化,甚至出现荒漠化、沙漠化[7-8];随着多年冻土消融,冻土中的碳储量可能被释放,从而放大高原气候变暖效应[9];大量赋存于多年冻土中的地下冰转化为液态水,部分参与到活动层的冻融过程中,而其余部分将参与到区域乃至全球的水循环过程中[10];此外,多年冻土退化导致高原下垫面的能量平衡发生变化,最终可能触发整个北半球气候系统的变化[11-12].因此,准确评估和预估全球气候变暖背景下大时间尺度多年冻土热状况的变化已经成为冰冻圈科学研究的核心环节之一[13]. ...
Pan-Arctic ice-wedge degradation in warming permafrost and its influence on tundra hydrology
1
2016
... 多年冻土约占北半球陆地面积的25%[1],其对气候变化尤为敏感[2].青藏高原是全球海拔最高的地区,分布面积高达约1.06×10⁶ km2的多年冻土[3],并以高温高含冰量为特征[4-5].全球气候变暖的背景下,多年冻土呈现退化趋势,表现为多年冻土升温、埋藏深度增大和地下冰融化等,对寒区的工程建筑的稳定性、气候以及水文生态过程都有着重大影响.多年冻土退化导致地基的力学稳定性降低以及引发的地表沉降是影响寒区工程稳定性和安全性的主要因素[6];多年冻土与寒区生态系统之间也存在着相辅相生的共生关系,青藏高原多年冻土退化已经引起高寒草甸生态系统发生变化,甚至出现荒漠化、沙漠化[7-8];随着多年冻土消融,冻土中的碳储量可能被释放,从而放大高原气候变暖效应[9];大量赋存于多年冻土中的地下冰转化为液态水,部分参与到活动层的冻融过程中,而其余部分将参与到区域乃至全球的水循环过程中[10];此外,多年冻土退化导致高原下垫面的能量平衡发生变化,最终可能触发整个北半球气候系统的变化[11-12].因此,准确评估和预估全球气候变暖背景下大时间尺度多年冻土热状况的变化已经成为冰冻圈科学研究的核心环节之一[13]. ...
Temperature in Qinghai-Xizang Plateau and the atmospheric circulation in the East Asia
1
1985
... 多年冻土约占北半球陆地面积的25%[1],其对气候变化尤为敏感[2].青藏高原是全球海拔最高的地区,分布面积高达约1.06×10⁶ km2的多年冻土[3],并以高温高含冰量为特征[4-5].全球气候变暖的背景下,多年冻土呈现退化趋势,表现为多年冻土升温、埋藏深度增大和地下冰融化等,对寒区的工程建筑的稳定性、气候以及水文生态过程都有着重大影响.多年冻土退化导致地基的力学稳定性降低以及引发的地表沉降是影响寒区工程稳定性和安全性的主要因素[6];多年冻土与寒区生态系统之间也存在着相辅相生的共生关系,青藏高原多年冻土退化已经引起高寒草甸生态系统发生变化,甚至出现荒漠化、沙漠化[7-8];随着多年冻土消融,冻土中的碳储量可能被释放,从而放大高原气候变暖效应[9];大量赋存于多年冻土中的地下冰转化为液态水,部分参与到活动层的冻融过程中,而其余部分将参与到区域乃至全球的水循环过程中[10];此外,多年冻土退化导致高原下垫面的能量平衡发生变化,最终可能触发整个北半球气候系统的变化[11-12].因此,准确评估和预估全球气候变暖背景下大时间尺度多年冻土热状况的变化已经成为冰冻圈科学研究的核心环节之一[13]. ...
青藏高原温度与东亚环流
1
1985
... 多年冻土约占北半球陆地面积的25%[1],其对气候变化尤为敏感[2].青藏高原是全球海拔最高的地区,分布面积高达约1.06×10⁶ km2的多年冻土[3],并以高温高含冰量为特征[4-5].全球气候变暖的背景下,多年冻土呈现退化趋势,表现为多年冻土升温、埋藏深度增大和地下冰融化等,对寒区的工程建筑的稳定性、气候以及水文生态过程都有着重大影响.多年冻土退化导致地基的力学稳定性降低以及引发的地表沉降是影响寒区工程稳定性和安全性的主要因素[6];多年冻土与寒区生态系统之间也存在着相辅相生的共生关系,青藏高原多年冻土退化已经引起高寒草甸生态系统发生变化,甚至出现荒漠化、沙漠化[7-8];随着多年冻土消融,冻土中的碳储量可能被释放,从而放大高原气候变暖效应[9];大量赋存于多年冻土中的地下冰转化为液态水,部分参与到活动层的冻融过程中,而其余部分将参与到区域乃至全球的水循环过程中[10];此外,多年冻土退化导致高原下垫面的能量平衡发生变化,最终可能触发整个北半球气候系统的变化[11-12].因此,准确评估和预估全球气候变暖背景下大时间尺度多年冻土热状况的变化已经成为冰冻圈科学研究的核心环节之一[13]. ...
Study on relationship between the frozen-thaw process in Qinghai-Xizang Plateau and circulation in East-Asia
1
2003
... 多年冻土约占北半球陆地面积的25%[1],其对气候变化尤为敏感[2].青藏高原是全球海拔最高的地区,分布面积高达约1.06×10⁶ km2的多年冻土[3],并以高温高含冰量为特征[4-5].全球气候变暖的背景下,多年冻土呈现退化趋势,表现为多年冻土升温、埋藏深度增大和地下冰融化等,对寒区的工程建筑的稳定性、气候以及水文生态过程都有着重大影响.多年冻土退化导致地基的力学稳定性降低以及引发的地表沉降是影响寒区工程稳定性和安全性的主要因素[6];多年冻土与寒区生态系统之间也存在着相辅相生的共生关系,青藏高原多年冻土退化已经引起高寒草甸生态系统发生变化,甚至出现荒漠化、沙漠化[7-8];随着多年冻土消融,冻土中的碳储量可能被释放,从而放大高原气候变暖效应[9];大量赋存于多年冻土中的地下冰转化为液态水,部分参与到活动层的冻融过程中,而其余部分将参与到区域乃至全球的水循环过程中[10];此外,多年冻土退化导致高原下垫面的能量平衡发生变化,最终可能触发整个北半球气候系统的变化[11-12].因此,准确评估和预估全球气候变暖背景下大时间尺度多年冻土热状况的变化已经成为冰冻圈科学研究的核心环节之一[13]. ...
青藏高原季节冻融过程与东亚大气环流关系的研究
1
2003
... 多年冻土约占北半球陆地面积的25%[1],其对气候变化尤为敏感[2].青藏高原是全球海拔最高的地区,分布面积高达约1.06×10⁶ km2的多年冻土[3],并以高温高含冰量为特征[4-5].全球气候变暖的背景下,多年冻土呈现退化趋势,表现为多年冻土升温、埋藏深度增大和地下冰融化等,对寒区的工程建筑的稳定性、气候以及水文生态过程都有着重大影响.多年冻土退化导致地基的力学稳定性降低以及引发的地表沉降是影响寒区工程稳定性和安全性的主要因素[6];多年冻土与寒区生态系统之间也存在着相辅相生的共生关系,青藏高原多年冻土退化已经引起高寒草甸生态系统发生变化,甚至出现荒漠化、沙漠化[7-8];随着多年冻土消融,冻土中的碳储量可能被释放,从而放大高原气候变暖效应[9];大量赋存于多年冻土中的地下冰转化为液态水,部分参与到活动层的冻融过程中,而其余部分将参与到区域乃至全球的水循环过程中[10];此外,多年冻土退化导致高原下垫面的能量平衡发生变化,最终可能触发整个北半球气候系统的变化[11-12].因此,准确评估和预估全球气候变暖背景下大时间尺度多年冻土热状况的变化已经成为冰冻圈科学研究的核心环节之一[13]. ...
Challenges in the study of cryospheric changes and their impacts
1
2013
... 多年冻土约占北半球陆地面积的25%[1],其对气候变化尤为敏感[2].青藏高原是全球海拔最高的地区,分布面积高达约1.06×10⁶ km2的多年冻土[3],并以高温高含冰量为特征[4-5].全球气候变暖的背景下,多年冻土呈现退化趋势,表现为多年冻土升温、埋藏深度增大和地下冰融化等,对寒区的工程建筑的稳定性、气候以及水文生态过程都有着重大影响.多年冻土退化导致地基的力学稳定性降低以及引发的地表沉降是影响寒区工程稳定性和安全性的主要因素[6];多年冻土与寒区生态系统之间也存在着相辅相生的共生关系,青藏高原多年冻土退化已经引起高寒草甸生态系统发生变化,甚至出现荒漠化、沙漠化[7-8];随着多年冻土消融,冻土中的碳储量可能被释放,从而放大高原气候变暖效应[9];大量赋存于多年冻土中的地下冰转化为液态水,部分参与到活动层的冻融过程中,而其余部分将参与到区域乃至全球的水循环过程中[10];此外,多年冻土退化导致高原下垫面的能量平衡发生变化,最终可能触发整个北半球气候系统的变化[11-12].因此,准确评估和预估全球气候变暖背景下大时间尺度多年冻土热状况的变化已经成为冰冻圈科学研究的核心环节之一[13]. ...
冰冻圈变化及其影响研究的主要科学问题概论
1
2013
... 多年冻土约占北半球陆地面积的25%[1],其对气候变化尤为敏感[2].青藏高原是全球海拔最高的地区,分布面积高达约1.06×10⁶ km2的多年冻土[3],并以高温高含冰量为特征[4-5].全球气候变暖的背景下,多年冻土呈现退化趋势,表现为多年冻土升温、埋藏深度增大和地下冰融化等,对寒区的工程建筑的稳定性、气候以及水文生态过程都有着重大影响.多年冻土退化导致地基的力学稳定性降低以及引发的地表沉降是影响寒区工程稳定性和安全性的主要因素[6];多年冻土与寒区生态系统之间也存在着相辅相生的共生关系,青藏高原多年冻土退化已经引起高寒草甸生态系统发生变化,甚至出现荒漠化、沙漠化[7-8];随着多年冻土消融,冻土中的碳储量可能被释放,从而放大高原气候变暖效应[9];大量赋存于多年冻土中的地下冰转化为液态水,部分参与到活动层的冻融过程中,而其余部分将参与到区域乃至全球的水循环过程中[10];此外,多年冻土退化导致高原下垫面的能量平衡发生变化,最终可能触发整个北半球气候系统的变化[11-12].因此,准确评估和预估全球气候变暖背景下大时间尺度多年冻土热状况的变化已经成为冰冻圈科学研究的核心环节之一[13]. ...
Recent advances in permafrost modelling
2
2010
... 瞬态数值冻土模式是研究多年冻土温度场变化的一个有效手段,因为其能灵活描述多年冻土剖面的异质性、几何形状和边界条件[14].已有多种冻土模式应用于模拟多年冻土的分布及变化[15-19].在现有的冻土模式中,考虑相变的热传导方程是计算多年冻土温度场的核心.一般的模拟步骤为首先采用初始恒定的上边界条件进行反复迭代数百次后,直至多年冻土垂直剖面温度场达到稳态作为初始条件,然后赋予相应的上边界条件变化模拟不同情景下冻土温度场的变化[20].现有用于模拟多年冻土的研究主要关注近地表温度场变化的影响,主要集中于对气温和浅表层物理过程和参数化方案等改进和优化[18,20-21].而对于下边界条件设置对模拟多年冻土热状况的影响尚缺乏深入评估.例如大气环流模式中的陆面模式一般采用较浅的下边界,通常为3~10 m,采用零地热通量或恒定温度作为下边界条件[21-22],而一些专门针对多年冻土计算的数值模式则采用较深的下边界,通常大于50 m,采用恒定热通量或恒定温度作为下边界条件[15,19,23-24].对深层多年冻土物理过程不恰当的表现,是当前冻土模式模拟结果主要的不确定性来源之一[22,25-28].多年冻土是历史气候及地质过程的综合产物,由于土壤是不良的热导体,热传导沿岩土层深度具有滞后性及衰减性.浅层冻土的温度变化主要受控于年际气候变化,而随着岩土层加深,年际气候波动信号会被衰减过滤,深层多年冻土的温度主要取决于长期历史气候以及岩土层下部地热能量共同作用[29].因此,如果研究只关注活动层或较浅的多年冻土层年际地温场的变化,也许可以忽视岩土层下部地热能量的影响,相反,如果关注点在于在气候变暖的背景下,模拟和预测百年或千年尺度下多年冻土退化的时机和程度,其取决于深层多年冻土地温场变化,则应必须重视下边界条件设置的影响 [26].定量界定“浅层”和“深层”多年冻土,同样需要评估在所研究的时间尺度内,不同的下边界条件设置对不同深度多年冻土温度计算的影响程度. ...
... 从相变热传导理论的角度,采用恒定地热流作为第二类下边界条件的方案4~6相对更符合实际的物理过程 [14,26].在预热结束后方案4~6计算的1965年地温-深度曲线也基本重合[图4(b1)],而随着地表升温,方案4~6的多年冻土2015年地温模拟结果能较好的符合实测值[图4(b2)],也能较好的再现各岩土层实测近十年的升温情况[图5(b1~b5)].就方案4~6相互比较而言,下边界深度设置越浅,多年冻土地温模拟结果就会越偏高.这是因为在实验第三步地温自上而下逐步升高时,上层的地温梯度会减小,同时又受到岩土层下部地热流作用,使得整个地温曲线随时间呈现“弓形”[46].实测的上层多年冻土垂直剖面的地温梯度小于深层的垂直剖面地温梯度.若下边界深度设得浅,又采用深层的地温梯度换算的恒定地热流作为下边界条件,则会高估来自岩土层下部地热流输入的能量,进而模拟出偏高的多年冻土温度. ...
Modeling permafrost changes on the Qinghai-Tibetan Plateau from 1966 to 2100: a case study from two boreholes along the Qinghai-Tibet engineering corridor
2
2019
... 瞬态数值冻土模式是研究多年冻土温度场变化的一个有效手段,因为其能灵活描述多年冻土剖面的异质性、几何形状和边界条件[14].已有多种冻土模式应用于模拟多年冻土的分布及变化[15-19].在现有的冻土模式中,考虑相变的热传导方程是计算多年冻土温度场的核心.一般的模拟步骤为首先采用初始恒定的上边界条件进行反复迭代数百次后,直至多年冻土垂直剖面温度场达到稳态作为初始条件,然后赋予相应的上边界条件变化模拟不同情景下冻土温度场的变化[20].现有用于模拟多年冻土的研究主要关注近地表温度场变化的影响,主要集中于对气温和浅表层物理过程和参数化方案等改进和优化[18,20-21].而对于下边界条件设置对模拟多年冻土热状况的影响尚缺乏深入评估.例如大气环流模式中的陆面模式一般采用较浅的下边界,通常为3~10 m,采用零地热通量或恒定温度作为下边界条件[21-22],而一些专门针对多年冻土计算的数值模式则采用较深的下边界,通常大于50 m,采用恒定热通量或恒定温度作为下边界条件[15,19,23-24].对深层多年冻土物理过程不恰当的表现,是当前冻土模式模拟结果主要的不确定性来源之一[22,25-28].多年冻土是历史气候及地质过程的综合产物,由于土壤是不良的热导体,热传导沿岩土层深度具有滞后性及衰减性.浅层冻土的温度变化主要受控于年际气候变化,而随着岩土层加深,年际气候波动信号会被衰减过滤,深层多年冻土的温度主要取决于长期历史气候以及岩土层下部地热能量共同作用[29].因此,如果研究只关注活动层或较浅的多年冻土层年际地温场的变化,也许可以忽视岩土层下部地热能量的影响,相反,如果关注点在于在气候变暖的背景下,模拟和预测百年或千年尺度下多年冻土退化的时机和程度,其取决于深层多年冻土地温场变化,则应必须重视下边界条件设置的影响 [26].定量界定“浅层”和“深层”多年冻土,同样需要评估在所研究的时间尺度内,不同的下边界条件设置对不同深度多年冻土温度计算的影响程度. ...
... [15,19,23-24].对深层多年冻土物理过程不恰当的表现,是当前冻土模式模拟结果主要的不确定性来源之一[22,25-28].多年冻土是历史气候及地质过程的综合产物,由于土壤是不良的热导体,热传导沿岩土层深度具有滞后性及衰减性.浅层冻土的温度变化主要受控于年际气候变化,而随着岩土层加深,年际气候波动信号会被衰减过滤,深层多年冻土的温度主要取决于长期历史气候以及岩土层下部地热能量共同作用[29].因此,如果研究只关注活动层或较浅的多年冻土层年际地温场的变化,也许可以忽视岩土层下部地热能量的影响,相反,如果关注点在于在气候变暖的背景下,模拟和预测百年或千年尺度下多年冻土退化的时机和程度,其取决于深层多年冻土地温场变化,则应必须重视下边界条件设置的影响 [26].定量界定“浅层”和“深层”多年冻土,同样需要评估在所研究的时间尺度内,不同的下边界条件设置对不同深度多年冻土温度计算的影响程度. ...
Simulation of permafrost and seasonally frozen ground conditions on the Tibetan Plateau, 1981-2010
0
2013
Numerical simulation of spatial distribution and change of permafrost in the source area of the Yellow River
1
2017
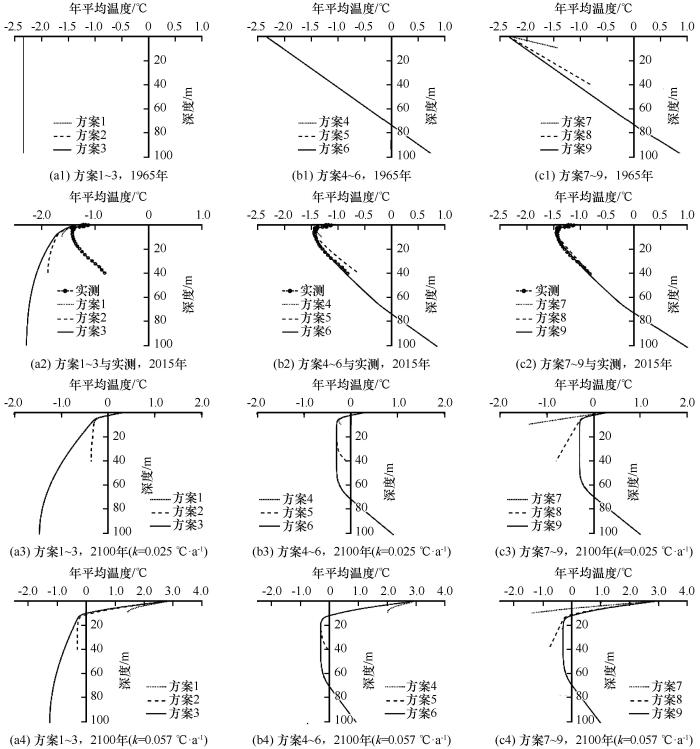
... 现有冻土数值模拟计算中,下边界条件的设置差异主要包括设置深度不同和设置方式不同.综合现有主要的冻土模式对于下边界条件的设置,本文设计3个下边界深度:10 m(大气环流模式中的冻土层一般设置的范围[22],且位于研究区地温年变化深度以下)、40 m(研究区钻孔底部)和100 m(一些专门针对百年尺度多年冻土变化数值模拟研究所采用下边界深度[17, 20]);3种下边界条件的设置方式:零地热通量(不考虑地热影响,第二类边界条件)、恒定地热流(第二类边界条件)和相应岩土层的恒定温度(第一类边界条件).3个深度和3种设置方式进行相互组合,共设计9种下边界条件方案(表2).根据五道梁地区的深孔(大于60 m)的相关文献[44-45],深层地热梯度约为0.03 ℃·m-1,换算成地热流(方案4~6). ...
黄河源区多年冻土空间分布变化特征数值模拟
1
2017
... 现有冻土数值模拟计算中,下边界条件的设置差异主要包括设置深度不同和设置方式不同.综合现有主要的冻土模式对于下边界条件的设置,本文设计3个下边界深度:10 m(大气环流模式中的冻土层一般设置的范围[22],且位于研究区地温年变化深度以下)、40 m(研究区钻孔底部)和100 m(一些专门针对百年尺度多年冻土变化数值模拟研究所采用下边界深度[17, 20]);3种下边界条件的设置方式:零地热通量(不考虑地热影响,第二类边界条件)、恒定地热流(第二类边界条件)和相应岩土层的恒定温度(第一类边界条件).3个深度和3种设置方式进行相互组合,共设计9种下边界条件方案(表2).根据五道梁地区的深孔(大于60 m)的相关文献[44-45],深层地热梯度约为0.03 ℃·m-1,换算成地热流(方案4~6). ...
Spatial modeling of permafrost distribution and properties on the Qinghai-Tibet Plateau
1
2018
... 瞬态数值冻土模式是研究多年冻土温度场变化的一个有效手段,因为其能灵活描述多年冻土剖面的异质性、几何形状和边界条件[14].已有多种冻土模式应用于模拟多年冻土的分布及变化[15-19].在现有的冻土模式中,考虑相变的热传导方程是计算多年冻土温度场的核心.一般的模拟步骤为首先采用初始恒定的上边界条件进行反复迭代数百次后,直至多年冻土垂直剖面温度场达到稳态作为初始条件,然后赋予相应的上边界条件变化模拟不同情景下冻土温度场的变化[20].现有用于模拟多年冻土的研究主要关注近地表温度场变化的影响,主要集中于对气温和浅表层物理过程和参数化方案等改进和优化[18,20-21].而对于下边界条件设置对模拟多年冻土热状况的影响尚缺乏深入评估.例如大气环流模式中的陆面模式一般采用较浅的下边界,通常为3~10 m,采用零地热通量或恒定温度作为下边界条件[21-22],而一些专门针对多年冻土计算的数值模式则采用较深的下边界,通常大于50 m,采用恒定热通量或恒定温度作为下边界条件[15,19,23-24].对深层多年冻土物理过程不恰当的表现,是当前冻土模式模拟结果主要的不确定性来源之一[22,25-28].多年冻土是历史气候及地质过程的综合产物,由于土壤是不良的热导体,热传导沿岩土层深度具有滞后性及衰减性.浅层冻土的温度变化主要受控于年际气候变化,而随着岩土层加深,年际气候波动信号会被衰减过滤,深层多年冻土的温度主要取决于长期历史气候以及岩土层下部地热能量共同作用[29].因此,如果研究只关注活动层或较浅的多年冻土层年际地温场的变化,也许可以忽视岩土层下部地热能量的影响,相反,如果关注点在于在气候变暖的背景下,模拟和预测百年或千年尺度下多年冻土退化的时机和程度,其取决于深层多年冻土地温场变化,则应必须重视下边界条件设置的影响 [26].定量界定“浅层”和“深层”多年冻土,同样需要评估在所研究的时间尺度内,不同的下边界条件设置对不同深度多年冻土温度计算的影响程度. ...
Numerical modeling of the active layer thickness and permafrost thermal state across Qinghai-Tibetan Plateau
2
2017
... 瞬态数值冻土模式是研究多年冻土温度场变化的一个有效手段,因为其能灵活描述多年冻土剖面的异质性、几何形状和边界条件[14].已有多种冻土模式应用于模拟多年冻土的分布及变化[15-19].在现有的冻土模式中,考虑相变的热传导方程是计算多年冻土温度场的核心.一般的模拟步骤为首先采用初始恒定的上边界条件进行反复迭代数百次后,直至多年冻土垂直剖面温度场达到稳态作为初始条件,然后赋予相应的上边界条件变化模拟不同情景下冻土温度场的变化[20].现有用于模拟多年冻土的研究主要关注近地表温度场变化的影响,主要集中于对气温和浅表层物理过程和参数化方案等改进和优化[18,20-21].而对于下边界条件设置对模拟多年冻土热状况的影响尚缺乏深入评估.例如大气环流模式中的陆面模式一般采用较浅的下边界,通常为3~10 m,采用零地热通量或恒定温度作为下边界条件[21-22],而一些专门针对多年冻土计算的数值模式则采用较深的下边界,通常大于50 m,采用恒定热通量或恒定温度作为下边界条件[15,19,23-24].对深层多年冻土物理过程不恰当的表现,是当前冻土模式模拟结果主要的不确定性来源之一[22,25-28].多年冻土是历史气候及地质过程的综合产物,由于土壤是不良的热导体,热传导沿岩土层深度具有滞后性及衰减性.浅层冻土的温度变化主要受控于年际气候变化,而随着岩土层加深,年际气候波动信号会被衰减过滤,深层多年冻土的温度主要取决于长期历史气候以及岩土层下部地热能量共同作用[29].因此,如果研究只关注活动层或较浅的多年冻土层年际地温场的变化,也许可以忽视岩土层下部地热能量的影响,相反,如果关注点在于在气候变暖的背景下,模拟和预测百年或千年尺度下多年冻土退化的时机和程度,其取决于深层多年冻土地温场变化,则应必须重视下边界条件设置的影响 [26].定量界定“浅层”和“深层”多年冻土,同样需要评估在所研究的时间尺度内,不同的下边界条件设置对不同深度多年冻土温度计算的影响程度. ...
... ,19,23-24].对深层多年冻土物理过程不恰当的表现,是当前冻土模式模拟结果主要的不确定性来源之一[22,25-28].多年冻土是历史气候及地质过程的综合产物,由于土壤是不良的热导体,热传导沿岩土层深度具有滞后性及衰减性.浅层冻土的温度变化主要受控于年际气候变化,而随着岩土层加深,年际气候波动信号会被衰减过滤,深层多年冻土的温度主要取决于长期历史气候以及岩土层下部地热能量共同作用[29].因此,如果研究只关注活动层或较浅的多年冻土层年际地温场的变化,也许可以忽视岩土层下部地热能量的影响,相反,如果关注点在于在气候变暖的背景下,模拟和预测百年或千年尺度下多年冻土退化的时机和程度,其取决于深层多年冻土地温场变化,则应必须重视下边界条件设置的影响 [26].定量界定“浅层”和“深层”多年冻土,同样需要评估在所研究的时间尺度内,不同的下边界条件设置对不同深度多年冻土温度计算的影响程度. ...
Influence of upper boundary conditions on simulated ground temperature field in permafrost regions
3
2014
... 瞬态数值冻土模式是研究多年冻土温度场变化的一个有效手段,因为其能灵活描述多年冻土剖面的异质性、几何形状和边界条件[14].已有多种冻土模式应用于模拟多年冻土的分布及变化[15-19].在现有的冻土模式中,考虑相变的热传导方程是计算多年冻土温度场的核心.一般的模拟步骤为首先采用初始恒定的上边界条件进行反复迭代数百次后,直至多年冻土垂直剖面温度场达到稳态作为初始条件,然后赋予相应的上边界条件变化模拟不同情景下冻土温度场的变化[20].现有用于模拟多年冻土的研究主要关注近地表温度场变化的影响,主要集中于对气温和浅表层物理过程和参数化方案等改进和优化[18,20-21].而对于下边界条件设置对模拟多年冻土热状况的影响尚缺乏深入评估.例如大气环流模式中的陆面模式一般采用较浅的下边界,通常为3~10 m,采用零地热通量或恒定温度作为下边界条件[21-22],而一些专门针对多年冻土计算的数值模式则采用较深的下边界,通常大于50 m,采用恒定热通量或恒定温度作为下边界条件[15,19,23-24].对深层多年冻土物理过程不恰当的表现,是当前冻土模式模拟结果主要的不确定性来源之一[22,25-28].多年冻土是历史气候及地质过程的综合产物,由于土壤是不良的热导体,热传导沿岩土层深度具有滞后性及衰减性.浅层冻土的温度变化主要受控于年际气候变化,而随着岩土层加深,年际气候波动信号会被衰减过滤,深层多年冻土的温度主要取决于长期历史气候以及岩土层下部地热能量共同作用[29].因此,如果研究只关注活动层或较浅的多年冻土层年际地温场的变化,也许可以忽视岩土层下部地热能量的影响,相反,如果关注点在于在气候变暖的背景下,模拟和预测百年或千年尺度下多年冻土退化的时机和程度,其取决于深层多年冻土地温场变化,则应必须重视下边界条件设置的影响 [26].定量界定“浅层”和“深层”多年冻土,同样需要评估在所研究的时间尺度内,不同的下边界条件设置对不同深度多年冻土温度计算的影响程度. ...
... ,20-21].而对于下边界条件设置对模拟多年冻土热状况的影响尚缺乏深入评估.例如大气环流模式中的陆面模式一般采用较浅的下边界,通常为3~10 m,采用零地热通量或恒定温度作为下边界条件[21-22],而一些专门针对多年冻土计算的数值模式则采用较深的下边界,通常大于50 m,采用恒定热通量或恒定温度作为下边界条件[15,19,23-24].对深层多年冻土物理过程不恰当的表现,是当前冻土模式模拟结果主要的不确定性来源之一[22,25-28].多年冻土是历史气候及地质过程的综合产物,由于土壤是不良的热导体,热传导沿岩土层深度具有滞后性及衰减性.浅层冻土的温度变化主要受控于年际气候变化,而随着岩土层加深,年际气候波动信号会被衰减过滤,深层多年冻土的温度主要取决于长期历史气候以及岩土层下部地热能量共同作用[29].因此,如果研究只关注活动层或较浅的多年冻土层年际地温场的变化,也许可以忽视岩土层下部地热能量的影响,相反,如果关注点在于在气候变暖的背景下,模拟和预测百年或千年尺度下多年冻土退化的时机和程度,其取决于深层多年冻土地温场变化,则应必须重视下边界条件设置的影响 [26].定量界定“浅层”和“深层”多年冻土,同样需要评估在所研究的时间尺度内,不同的下边界条件设置对不同深度多年冻土温度计算的影响程度. ...
... 现有冻土数值模拟计算中,下边界条件的设置差异主要包括设置深度不同和设置方式不同.综合现有主要的冻土模式对于下边界条件的设置,本文设计3个下边界深度:10 m(大气环流模式中的冻土层一般设置的范围[22],且位于研究区地温年变化深度以下)、40 m(研究区钻孔底部)和100 m(一些专门针对百年尺度多年冻土变化数值模拟研究所采用下边界深度[17, 20]);3种下边界条件的设置方式:零地热通量(不考虑地热影响,第二类边界条件)、恒定地热流(第二类边界条件)和相应岩土层的恒定温度(第一类边界条件).3个深度和3种设置方式进行相互组合,共设计9种下边界条件方案(表2).根据五道梁地区的深孔(大于60 m)的相关文献[44-45],深层地热梯度约为0.03 ℃·m-1,换算成地热流(方案4~6). ...
上边界条件对多年冻土地温场数值模拟结果的影响分析
3
2014
... 瞬态数值冻土模式是研究多年冻土温度场变化的一个有效手段,因为其能灵活描述多年冻土剖面的异质性、几何形状和边界条件[14].已有多种冻土模式应用于模拟多年冻土的分布及变化[15-19].在现有的冻土模式中,考虑相变的热传导方程是计算多年冻土温度场的核心.一般的模拟步骤为首先采用初始恒定的上边界条件进行反复迭代数百次后,直至多年冻土垂直剖面温度场达到稳态作为初始条件,然后赋予相应的上边界条件变化模拟不同情景下冻土温度场的变化[20].现有用于模拟多年冻土的研究主要关注近地表温度场变化的影响,主要集中于对气温和浅表层物理过程和参数化方案等改进和优化[18,20-21].而对于下边界条件设置对模拟多年冻土热状况的影响尚缺乏深入评估.例如大气环流模式中的陆面模式一般采用较浅的下边界,通常为3~10 m,采用零地热通量或恒定温度作为下边界条件[21-22],而一些专门针对多年冻土计算的数值模式则采用较深的下边界,通常大于50 m,采用恒定热通量或恒定温度作为下边界条件[15,19,23-24].对深层多年冻土物理过程不恰当的表现,是当前冻土模式模拟结果主要的不确定性来源之一[22,25-28].多年冻土是历史气候及地质过程的综合产物,由于土壤是不良的热导体,热传导沿岩土层深度具有滞后性及衰减性.浅层冻土的温度变化主要受控于年际气候变化,而随着岩土层加深,年际气候波动信号会被衰减过滤,深层多年冻土的温度主要取决于长期历史气候以及岩土层下部地热能量共同作用[29].因此,如果研究只关注活动层或较浅的多年冻土层年际地温场的变化,也许可以忽视岩土层下部地热能量的影响,相反,如果关注点在于在气候变暖的背景下,模拟和预测百年或千年尺度下多年冻土退化的时机和程度,其取决于深层多年冻土地温场变化,则应必须重视下边界条件设置的影响 [26].定量界定“浅层”和“深层”多年冻土,同样需要评估在所研究的时间尺度内,不同的下边界条件设置对不同深度多年冻土温度计算的影响程度. ...
... ,20-21].而对于下边界条件设置对模拟多年冻土热状况的影响尚缺乏深入评估.例如大气环流模式中的陆面模式一般采用较浅的下边界,通常为3~10 m,采用零地热通量或恒定温度作为下边界条件[21-22],而一些专门针对多年冻土计算的数值模式则采用较深的下边界,通常大于50 m,采用恒定热通量或恒定温度作为下边界条件[15,19,23-24].对深层多年冻土物理过程不恰当的表现,是当前冻土模式模拟结果主要的不确定性来源之一[22,25-28].多年冻土是历史气候及地质过程的综合产物,由于土壤是不良的热导体,热传导沿岩土层深度具有滞后性及衰减性.浅层冻土的温度变化主要受控于年际气候变化,而随着岩土层加深,年际气候波动信号会被衰减过滤,深层多年冻土的温度主要取决于长期历史气候以及岩土层下部地热能量共同作用[29].因此,如果研究只关注活动层或较浅的多年冻土层年际地温场的变化,也许可以忽视岩土层下部地热能量的影响,相反,如果关注点在于在气候变暖的背景下,模拟和预测百年或千年尺度下多年冻土退化的时机和程度,其取决于深层多年冻土地温场变化,则应必须重视下边界条件设置的影响 [26].定量界定“浅层”和“深层”多年冻土,同样需要评估在所研究的时间尺度内,不同的下边界条件设置对不同深度多年冻土温度计算的影响程度. ...
... 现有冻土数值模拟计算中,下边界条件的设置差异主要包括设置深度不同和设置方式不同.综合现有主要的冻土模式对于下边界条件的设置,本文设计3个下边界深度:10 m(大气环流模式中的冻土层一般设置的范围[22],且位于研究区地温年变化深度以下)、40 m(研究区钻孔底部)和100 m(一些专门针对百年尺度多年冻土变化数值模拟研究所采用下边界深度[17, 20]);3种下边界条件的设置方式:零地热通量(不考虑地热影响,第二类边界条件)、恒定地热流(第二类边界条件)和相应岩土层的恒定温度(第一类边界条件).3个深度和3种设置方式进行相互组合,共设计9种下边界条件方案(表2).根据五道梁地区的深孔(大于60 m)的相关文献[44-45],深层地热梯度约为0.03 ℃·m-1,换算成地热流(方案4~6). ...
Improving the Noah-MP model for simulating hydrothermal regime of the active layer in the permafrost regions of the Qinghai-Tibet Plateau
2
2020
... 瞬态数值冻土模式是研究多年冻土温度场变化的一个有效手段,因为其能灵活描述多年冻土剖面的异质性、几何形状和边界条件[14].已有多种冻土模式应用于模拟多年冻土的分布及变化[15-19].在现有的冻土模式中,考虑相变的热传导方程是计算多年冻土温度场的核心.一般的模拟步骤为首先采用初始恒定的上边界条件进行反复迭代数百次后,直至多年冻土垂直剖面温度场达到稳态作为初始条件,然后赋予相应的上边界条件变化模拟不同情景下冻土温度场的变化[20].现有用于模拟多年冻土的研究主要关注近地表温度场变化的影响,主要集中于对气温和浅表层物理过程和参数化方案等改进和优化[18,20-21].而对于下边界条件设置对模拟多年冻土热状况的影响尚缺乏深入评估.例如大气环流模式中的陆面模式一般采用较浅的下边界,通常为3~10 m,采用零地热通量或恒定温度作为下边界条件[21-22],而一些专门针对多年冻土计算的数值模式则采用较深的下边界,通常大于50 m,采用恒定热通量或恒定温度作为下边界条件[15,19,23-24].对深层多年冻土物理过程不恰当的表现,是当前冻土模式模拟结果主要的不确定性来源之一[22,25-28].多年冻土是历史气候及地质过程的综合产物,由于土壤是不良的热导体,热传导沿岩土层深度具有滞后性及衰减性.浅层冻土的温度变化主要受控于年际气候变化,而随着岩土层加深,年际气候波动信号会被衰减过滤,深层多年冻土的温度主要取决于长期历史气候以及岩土层下部地热能量共同作用[29].因此,如果研究只关注活动层或较浅的多年冻土层年际地温场的变化,也许可以忽视岩土层下部地热能量的影响,相反,如果关注点在于在气候变暖的背景下,模拟和预测百年或千年尺度下多年冻土退化的时机和程度,其取决于深层多年冻土地温场变化,则应必须重视下边界条件设置的影响 [26].定量界定“浅层”和“深层”多年冻土,同样需要评估在所研究的时间尺度内,不同的下边界条件设置对不同深度多年冻土温度计算的影响程度. ...
... [21-22],而一些专门针对多年冻土计算的数值模式则采用较深的下边界,通常大于50 m,采用恒定热通量或恒定温度作为下边界条件[15,19,23-24].对深层多年冻土物理过程不恰当的表现,是当前冻土模式模拟结果主要的不确定性来源之一[22,25-28].多年冻土是历史气候及地质过程的综合产物,由于土壤是不良的热导体,热传导沿岩土层深度具有滞后性及衰减性.浅层冻土的温度变化主要受控于年际气候变化,而随着岩土层加深,年际气候波动信号会被衰减过滤,深层多年冻土的温度主要取决于长期历史气候以及岩土层下部地热能量共同作用[29].因此,如果研究只关注活动层或较浅的多年冻土层年际地温场的变化,也许可以忽视岩土层下部地热能量的影响,相反,如果关注点在于在气候变暖的背景下,模拟和预测百年或千年尺度下多年冻土退化的时机和程度,其取决于深层多年冻土地温场变化,则应必须重视下边界条件设置的影响 [26].定量界定“浅层”和“深层”多年冻土,同样需要评估在所研究的时间尺度内,不同的下边界条件设置对不同深度多年冻土温度计算的影响程度. ...
Effects of bottom boundary placement on subsurface heat storage: implications for climate model simulations
4
2007
... 瞬态数值冻土模式是研究多年冻土温度场变化的一个有效手段,因为其能灵活描述多年冻土剖面的异质性、几何形状和边界条件[14].已有多种冻土模式应用于模拟多年冻土的分布及变化[15-19].在现有的冻土模式中,考虑相变的热传导方程是计算多年冻土温度场的核心.一般的模拟步骤为首先采用初始恒定的上边界条件进行反复迭代数百次后,直至多年冻土垂直剖面温度场达到稳态作为初始条件,然后赋予相应的上边界条件变化模拟不同情景下冻土温度场的变化[20].现有用于模拟多年冻土的研究主要关注近地表温度场变化的影响,主要集中于对气温和浅表层物理过程和参数化方案等改进和优化[18,20-21].而对于下边界条件设置对模拟多年冻土热状况的影响尚缺乏深入评估.例如大气环流模式中的陆面模式一般采用较浅的下边界,通常为3~10 m,采用零地热通量或恒定温度作为下边界条件[21-22],而一些专门针对多年冻土计算的数值模式则采用较深的下边界,通常大于50 m,采用恒定热通量或恒定温度作为下边界条件[15,19,23-24].对深层多年冻土物理过程不恰当的表现,是当前冻土模式模拟结果主要的不确定性来源之一[22,25-28].多年冻土是历史气候及地质过程的综合产物,由于土壤是不良的热导体,热传导沿岩土层深度具有滞后性及衰减性.浅层冻土的温度变化主要受控于年际气候变化,而随着岩土层加深,年际气候波动信号会被衰减过滤,深层多年冻土的温度主要取决于长期历史气候以及岩土层下部地热能量共同作用[29].因此,如果研究只关注活动层或较浅的多年冻土层年际地温场的变化,也许可以忽视岩土层下部地热能量的影响,相反,如果关注点在于在气候变暖的背景下,模拟和预测百年或千年尺度下多年冻土退化的时机和程度,其取决于深层多年冻土地温场变化,则应必须重视下边界条件设置的影响 [26].定量界定“浅层”和“深层”多年冻土,同样需要评估在所研究的时间尺度内,不同的下边界条件设置对不同深度多年冻土温度计算的影响程度. ...
... [22,25-28].多年冻土是历史气候及地质过程的综合产物,由于土壤是不良的热导体,热传导沿岩土层深度具有滞后性及衰减性.浅层冻土的温度变化主要受控于年际气候变化,而随着岩土层加深,年际气候波动信号会被衰减过滤,深层多年冻土的温度主要取决于长期历史气候以及岩土层下部地热能量共同作用[29].因此,如果研究只关注活动层或较浅的多年冻土层年际地温场的变化,也许可以忽视岩土层下部地热能量的影响,相反,如果关注点在于在气候变暖的背景下,模拟和预测百年或千年尺度下多年冻土退化的时机和程度,其取决于深层多年冻土地温场变化,则应必须重视下边界条件设置的影响 [26].定量界定“浅层”和“深层”多年冻土,同样需要评估在所研究的时间尺度内,不同的下边界条件设置对不同深度多年冻土温度计算的影响程度. ...
... 现有冻土数值模拟计算中,下边界条件的设置差异主要包括设置深度不同和设置方式不同.综合现有主要的冻土模式对于下边界条件的设置,本文设计3个下边界深度:10 m(大气环流模式中的冻土层一般设置的范围[22],且位于研究区地温年变化深度以下)、40 m(研究区钻孔底部)和100 m(一些专门针对百年尺度多年冻土变化数值模拟研究所采用下边界深度[17, 20]);3种下边界条件的设置方式:零地热通量(不考虑地热影响,第二类边界条件)、恒定地热流(第二类边界条件)和相应岩土层的恒定温度(第一类边界条件).3个深度和3种设置方式进行相互组合,共设计9种下边界条件方案(表2).根据五道梁地区的深孔(大于60 m)的相关文献[44-45],深层地热梯度约为0.03 ℃·m-1,换算成地热流(方案4~6). ...
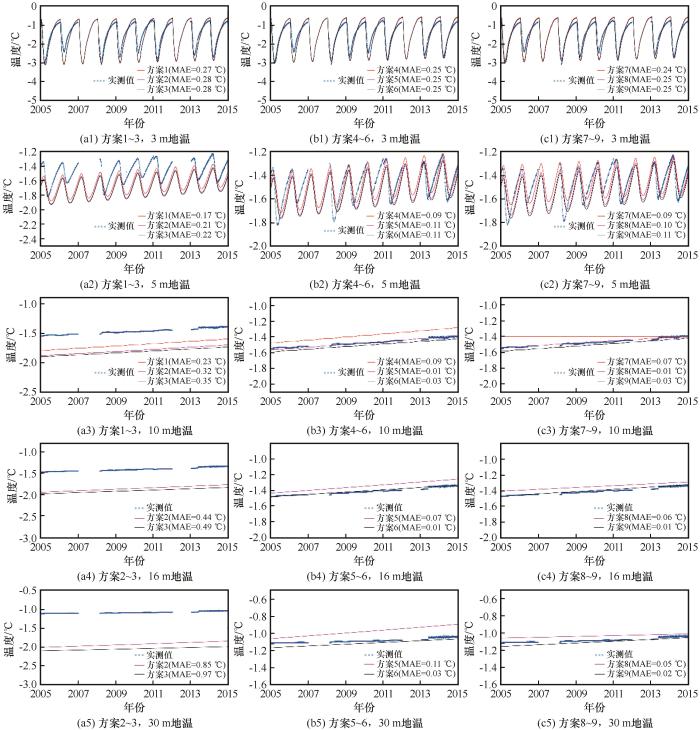
... 方案1~3不考虑来自岩土层下部地热能量影响,采用零地热通量作为下边界条件.在预热结束后方案1~3计算的1965年地度-深度曲线基本重合[图4(a1)],而随着地表升温,至2015年,方案1~3的多年冻土地温模拟结果相对于实测值明显偏小,且下边界设置越深,偏小越显著[图4(a2),图5(a1~a5)].原因为实验第二步的预热计算的初始稳态地温场的物理意义为在之前百年千年长时间尺度下处于恒定的地气热交换所达到稳定状态的过程,实验第三步反映了气候变暖改变了上边界条件导致多年冻土温度场的变化.因此方案1~3在实验第二步和第三步中忽视了来自岩土层下部地热能量对多年冻土地温场的加热作用,模拟的地温场会显著偏小.而下边界设得越深,更深层的岩土层将吸收更多来自地表升温的能量,故模拟深层岩土层的温度就越偏小[22]. ...
An evaluation of deep soil configuration in the CLM3 for improved representation of permafrost
1
2007
... 瞬态数值冻土模式是研究多年冻土温度场变化的一个有效手段,因为其能灵活描述多年冻土剖面的异质性、几何形状和边界条件[14].已有多种冻土模式应用于模拟多年冻土的分布及变化[15-19].在现有的冻土模式中,考虑相变的热传导方程是计算多年冻土温度场的核心.一般的模拟步骤为首先采用初始恒定的上边界条件进行反复迭代数百次后,直至多年冻土垂直剖面温度场达到稳态作为初始条件,然后赋予相应的上边界条件变化模拟不同情景下冻土温度场的变化[20].现有用于模拟多年冻土的研究主要关注近地表温度场变化的影响,主要集中于对气温和浅表层物理过程和参数化方案等改进和优化[18,20-21].而对于下边界条件设置对模拟多年冻土热状况的影响尚缺乏深入评估.例如大气环流模式中的陆面模式一般采用较浅的下边界,通常为3~10 m,采用零地热通量或恒定温度作为下边界条件[21-22],而一些专门针对多年冻土计算的数值模式则采用较深的下边界,通常大于50 m,采用恒定热通量或恒定温度作为下边界条件[15,19,23-24].对深层多年冻土物理过程不恰当的表现,是当前冻土模式模拟结果主要的不确定性来源之一[22,25-28].多年冻土是历史气候及地质过程的综合产物,由于土壤是不良的热导体,热传导沿岩土层深度具有滞后性及衰减性.浅层冻土的温度变化主要受控于年际气候变化,而随着岩土层加深,年际气候波动信号会被衰减过滤,深层多年冻土的温度主要取决于长期历史气候以及岩土层下部地热能量共同作用[29].因此,如果研究只关注活动层或较浅的多年冻土层年际地温场的变化,也许可以忽视岩土层下部地热能量的影响,相反,如果关注点在于在气候变暖的背景下,模拟和预测百年或千年尺度下多年冻土退化的时机和程度,其取决于深层多年冻土地温场变化,则应必须重视下边界条件设置的影响 [26].定量界定“浅层”和“深层”多年冻土,同样需要评估在所研究的时间尺度内,不同的下边界条件设置对不同深度多年冻土温度计算的影响程度. ...
Prediction of permafrost distribution on the Qinghai-Tibet Plateau in the next
1
50
... 瞬态数值冻土模式是研究多年冻土温度场变化的一个有效手段,因为其能灵活描述多年冻土剖面的异质性、几何形状和边界条件[14].已有多种冻土模式应用于模拟多年冻土的分布及变化[15-19].在现有的冻土模式中,考虑相变的热传导方程是计算多年冻土温度场的核心.一般的模拟步骤为首先采用初始恒定的上边界条件进行反复迭代数百次后,直至多年冻土垂直剖面温度场达到稳态作为初始条件,然后赋予相应的上边界条件变化模拟不同情景下冻土温度场的变化[20].现有用于模拟多年冻土的研究主要关注近地表温度场变化的影响,主要集中于对气温和浅表层物理过程和参数化方案等改进和优化[18,20-21].而对于下边界条件设置对模拟多年冻土热状况的影响尚缺乏深入评估.例如大气环流模式中的陆面模式一般采用较浅的下边界,通常为3~10 m,采用零地热通量或恒定温度作为下边界条件[21-22],而一些专门针对多年冻土计算的数值模式则采用较深的下边界,通常大于50 m,采用恒定热通量或恒定温度作为下边界条件[15,19,23-24].对深层多年冻土物理过程不恰当的表现,是当前冻土模式模拟结果主要的不确定性来源之一[22,25-28].多年冻土是历史气候及地质过程的综合产物,由于土壤是不良的热导体,热传导沿岩土层深度具有滞后性及衰减性.浅层冻土的温度变化主要受控于年际气候变化,而随着岩土层加深,年际气候波动信号会被衰减过滤,深层多年冻土的温度主要取决于长期历史气候以及岩土层下部地热能量共同作用[29].因此,如果研究只关注活动层或较浅的多年冻土层年际地温场的变化,也许可以忽视岩土层下部地热能量的影响,相反,如果关注点在于在气候变暖的背景下,模拟和预测百年或千年尺度下多年冻土退化的时机和程度,其取决于深层多年冻土地温场变化,则应必须重视下边界条件设置的影响 [26].定量界定“浅层”和“深层”多年冻土,同样需要评估在所研究的时间尺度内,不同的下边界条件设置对不同深度多年冻土温度计算的影响程度. ...
未来50与100 a青藏高原多年冻土变化情景预测
1
2004
... 瞬态数值冻土模式是研究多年冻土温度场变化的一个有效手段,因为其能灵活描述多年冻土剖面的异质性、几何形状和边界条件[14].已有多种冻土模式应用于模拟多年冻土的分布及变化[15-19].在现有的冻土模式中,考虑相变的热传导方程是计算多年冻土温度场的核心.一般的模拟步骤为首先采用初始恒定的上边界条件进行反复迭代数百次后,直至多年冻土垂直剖面温度场达到稳态作为初始条件,然后赋予相应的上边界条件变化模拟不同情景下冻土温度场的变化[20].现有用于模拟多年冻土的研究主要关注近地表温度场变化的影响,主要集中于对气温和浅表层物理过程和参数化方案等改进和优化[18,20-21].而对于下边界条件设置对模拟多年冻土热状况的影响尚缺乏深入评估.例如大气环流模式中的陆面模式一般采用较浅的下边界,通常为3~10 m,采用零地热通量或恒定温度作为下边界条件[21-22],而一些专门针对多年冻土计算的数值模式则采用较深的下边界,通常大于50 m,采用恒定热通量或恒定温度作为下边界条件[15,19,23-24].对深层多年冻土物理过程不恰当的表现,是当前冻土模式模拟结果主要的不确定性来源之一[22,25-28].多年冻土是历史气候及地质过程的综合产物,由于土壤是不良的热导体,热传导沿岩土层深度具有滞后性及衰减性.浅层冻土的温度变化主要受控于年际气候变化,而随着岩土层加深,年际气候波动信号会被衰减过滤,深层多年冻土的温度主要取决于长期历史气候以及岩土层下部地热能量共同作用[29].因此,如果研究只关注活动层或较浅的多年冻土层年际地温场的变化,也许可以忽视岩土层下部地热能量的影响,相反,如果关注点在于在气候变暖的背景下,模拟和预测百年或千年尺度下多年冻土退化的时机和程度,其取决于深层多年冻土地温场变化,则应必须重视下边界条件设置的影响 [26].定量界定“浅层”和“深层”多年冻土,同样需要评估在所研究的时间尺度内,不同的下边界条件设置对不同深度多年冻土温度计算的影响程度. ...
Most of the Northern Hemisphere permafrost remains under climate change
1
2019
... 瞬态数值冻土模式是研究多年冻土温度场变化的一个有效手段,因为其能灵活描述多年冻土剖面的异质性、几何形状和边界条件[14].已有多种冻土模式应用于模拟多年冻土的分布及变化[15-19].在现有的冻土模式中,考虑相变的热传导方程是计算多年冻土温度场的核心.一般的模拟步骤为首先采用初始恒定的上边界条件进行反复迭代数百次后,直至多年冻土垂直剖面温度场达到稳态作为初始条件,然后赋予相应的上边界条件变化模拟不同情景下冻土温度场的变化[20].现有用于模拟多年冻土的研究主要关注近地表温度场变化的影响,主要集中于对气温和浅表层物理过程和参数化方案等改进和优化[18,20-21].而对于下边界条件设置对模拟多年冻土热状况的影响尚缺乏深入评估.例如大气环流模式中的陆面模式一般采用较浅的下边界,通常为3~10 m,采用零地热通量或恒定温度作为下边界条件[21-22],而一些专门针对多年冻土计算的数值模式则采用较深的下边界,通常大于50 m,采用恒定热通量或恒定温度作为下边界条件[15,19,23-24].对深层多年冻土物理过程不恰当的表现,是当前冻土模式模拟结果主要的不确定性来源之一[22,25-28].多年冻土是历史气候及地质过程的综合产物,由于土壤是不良的热导体,热传导沿岩土层深度具有滞后性及衰减性.浅层冻土的温度变化主要受控于年际气候变化,而随着岩土层加深,年际气候波动信号会被衰减过滤,深层多年冻土的温度主要取决于长期历史气候以及岩土层下部地热能量共同作用[29].因此,如果研究只关注活动层或较浅的多年冻土层年际地温场的变化,也许可以忽视岩土层下部地热能量的影响,相反,如果关注点在于在气候变暖的背景下,模拟和预测百年或千年尺度下多年冻土退化的时机和程度,其取决于深层多年冻土地温场变化,则应必须重视下边界条件设置的影响 [26].定量界定“浅层”和“深层”多年冻土,同样需要评估在所研究的时间尺度内,不同的下边界条件设置对不同深度多年冻土温度计算的影响程度. ...
Climatic warming and the degradation of warm permafrost
3
1996
... 瞬态数值冻土模式是研究多年冻土温度场变化的一个有效手段,因为其能灵活描述多年冻土剖面的异质性、几何形状和边界条件[14].已有多种冻土模式应用于模拟多年冻土的分布及变化[15-19].在现有的冻土模式中,考虑相变的热传导方程是计算多年冻土温度场的核心.一般的模拟步骤为首先采用初始恒定的上边界条件进行反复迭代数百次后,直至多年冻土垂直剖面温度场达到稳态作为初始条件,然后赋予相应的上边界条件变化模拟不同情景下冻土温度场的变化[20].现有用于模拟多年冻土的研究主要关注近地表温度场变化的影响,主要集中于对气温和浅表层物理过程和参数化方案等改进和优化[18,20-21].而对于下边界条件设置对模拟多年冻土热状况的影响尚缺乏深入评估.例如大气环流模式中的陆面模式一般采用较浅的下边界,通常为3~10 m,采用零地热通量或恒定温度作为下边界条件[21-22],而一些专门针对多年冻土计算的数值模式则采用较深的下边界,通常大于50 m,采用恒定热通量或恒定温度作为下边界条件[15,19,23-24].对深层多年冻土物理过程不恰当的表现,是当前冻土模式模拟结果主要的不确定性来源之一[22,25-28].多年冻土是历史气候及地质过程的综合产物,由于土壤是不良的热导体,热传导沿岩土层深度具有滞后性及衰减性.浅层冻土的温度变化主要受控于年际气候变化,而随着岩土层加深,年际气候波动信号会被衰减过滤,深层多年冻土的温度主要取决于长期历史气候以及岩土层下部地热能量共同作用[29].因此,如果研究只关注活动层或较浅的多年冻土层年际地温场的变化,也许可以忽视岩土层下部地热能量的影响,相反,如果关注点在于在气候变暖的背景下,模拟和预测百年或千年尺度下多年冻土退化的时机和程度,其取决于深层多年冻土地温场变化,则应必须重视下边界条件设置的影响 [26].定量界定“浅层”和“深层”多年冻土,同样需要评估在所研究的时间尺度内,不同的下边界条件设置对不同深度多年冻土温度计算的影响程度. ...
... 从相变热传导理论的角度,采用恒定地热流作为第二类下边界条件的方案4~6相对更符合实际的物理过程 [14,26].在预热结束后方案4~6计算的1965年地温-深度曲线也基本重合[图4(b1)],而随着地表升温,方案4~6的多年冻土2015年地温模拟结果能较好的符合实测值[图4(b2)],也能较好的再现各岩土层实测近十年的升温情况[图5(b1~b5)].就方案4~6相互比较而言,下边界深度设置越浅,多年冻土地温模拟结果就会越偏高.这是因为在实验第三步地温自上而下逐步升高时,上层的地温梯度会减小,同时又受到岩土层下部地热流作用,使得整个地温曲线随时间呈现“弓形”[46].实测的上层多年冻土垂直剖面的地温梯度小于深层的垂直剖面地温梯度.若下边界深度设得浅,又采用深层的地温梯度换算的恒定地热流作为下边界条件,则会高估来自岩土层下部地热流输入的能量,进而模拟出偏高的多年冻土温度. ...
... 各方案预估结果的比较显示,当上边界有长时间尺度显著升温的情景时,不同的下边界设置会对多年冻土消融及其产生的相变热的计算会有显著影响,进而模拟结果中百年尺度气候变化对深层多年冻土地温的影响程度也会有很大的差异.如图4(a4)和图4(b4)所示的结果,模拟RCP8.5升温情景(k=0.057 ℃·a-1)下多年冻土百年尺度下未来变化时,若采用第二类边界条件且下边界设在浅层的方案1和方案4的模拟结果显示到2100年五道梁地区的多年冻土以完全消融,变为非多年冻土地区;然而若下边界位置设置在深层以下的方案2~5的模拟结果显示到2100年五道梁地区依旧存在着残余多年冻土,不能划为非多年冻土区.目前气候模式中计算的多年冻土层设置很薄的情况,无疑会对气候变暖的背景下全球多年冻土面积变化的预估结果造成影响并引发较大的争议[26]. ...
Modelling of permafrost thickness during the late glacial stage in France: preliminary results
0
1994
Permafrost, heat flow, and the geothermal regime at Prudhoe Bay, Alaska
1
1982
... 瞬态数值冻土模式是研究多年冻土温度场变化的一个有效手段,因为其能灵活描述多年冻土剖面的异质性、几何形状和边界条件[14].已有多种冻土模式应用于模拟多年冻土的分布及变化[15-19].在现有的冻土模式中,考虑相变的热传导方程是计算多年冻土温度场的核心.一般的模拟步骤为首先采用初始恒定的上边界条件进行反复迭代数百次后,直至多年冻土垂直剖面温度场达到稳态作为初始条件,然后赋予相应的上边界条件变化模拟不同情景下冻土温度场的变化[20].现有用于模拟多年冻土的研究主要关注近地表温度场变化的影响,主要集中于对气温和浅表层物理过程和参数化方案等改进和优化[18,20-21].而对于下边界条件设置对模拟多年冻土热状况的影响尚缺乏深入评估.例如大气环流模式中的陆面模式一般采用较浅的下边界,通常为3~10 m,采用零地热通量或恒定温度作为下边界条件[21-22],而一些专门针对多年冻土计算的数值模式则采用较深的下边界,通常大于50 m,采用恒定热通量或恒定温度作为下边界条件[15,19,23-24].对深层多年冻土物理过程不恰当的表现,是当前冻土模式模拟结果主要的不确定性来源之一[22,25-28].多年冻土是历史气候及地质过程的综合产物,由于土壤是不良的热导体,热传导沿岩土层深度具有滞后性及衰减性.浅层冻土的温度变化主要受控于年际气候变化,而随着岩土层加深,年际气候波动信号会被衰减过滤,深层多年冻土的温度主要取决于长期历史气候以及岩土层下部地热能量共同作用[29].因此,如果研究只关注活动层或较浅的多年冻土层年际地温场的变化,也许可以忽视岩土层下部地热能量的影响,相反,如果关注点在于在气候变暖的背景下,模拟和预测百年或千年尺度下多年冻土退化的时机和程度,其取决于深层多年冻土地温场变化,则应必须重视下边界条件设置的影响 [26].定量界定“浅层”和“深层”多年冻土,同样需要评估在所研究的时间尺度内,不同的下边界条件设置对不同深度多年冻土温度计算的影响程度. ...
Permafrost thermal state in the polar Northern Hemisphere during the international polar year 2007-2009: a synthesis
1
2010
... 瞬态数值冻土模式是研究多年冻土温度场变化的一个有效手段,因为其能灵活描述多年冻土剖面的异质性、几何形状和边界条件[14].已有多种冻土模式应用于模拟多年冻土的分布及变化[15-19].在现有的冻土模式中,考虑相变的热传导方程是计算多年冻土温度场的核心.一般的模拟步骤为首先采用初始恒定的上边界条件进行反复迭代数百次后,直至多年冻土垂直剖面温度场达到稳态作为初始条件,然后赋予相应的上边界条件变化模拟不同情景下冻土温度场的变化[20].现有用于模拟多年冻土的研究主要关注近地表温度场变化的影响,主要集中于对气温和浅表层物理过程和参数化方案等改进和优化[18,20-21].而对于下边界条件设置对模拟多年冻土热状况的影响尚缺乏深入评估.例如大气环流模式中的陆面模式一般采用较浅的下边界,通常为3~10 m,采用零地热通量或恒定温度作为下边界条件[21-22],而一些专门针对多年冻土计算的数值模式则采用较深的下边界,通常大于50 m,采用恒定热通量或恒定温度作为下边界条件[15,19,23-24].对深层多年冻土物理过程不恰当的表现,是当前冻土模式模拟结果主要的不确定性来源之一[22,25-28].多年冻土是历史气候及地质过程的综合产物,由于土壤是不良的热导体,热传导沿岩土层深度具有滞后性及衰减性.浅层冻土的温度变化主要受控于年际气候变化,而随着岩土层加深,年际气候波动信号会被衰减过滤,深层多年冻土的温度主要取决于长期历史气候以及岩土层下部地热能量共同作用[29].因此,如果研究只关注活动层或较浅的多年冻土层年际地温场的变化,也许可以忽视岩土层下部地热能量的影响,相反,如果关注点在于在气候变暖的背景下,模拟和预测百年或千年尺度下多年冻土退化的时机和程度,其取决于深层多年冻土地温场变化,则应必须重视下边界条件设置的影响 [26].定量界定“浅层”和“深层”多年冻土,同样需要评估在所研究的时间尺度内,不同的下边界条件设置对不同深度多年冻土温度计算的影响程度. ...
Advances in energy budget observation experiment over the Qinghai-Xizang Plateau
1
1999
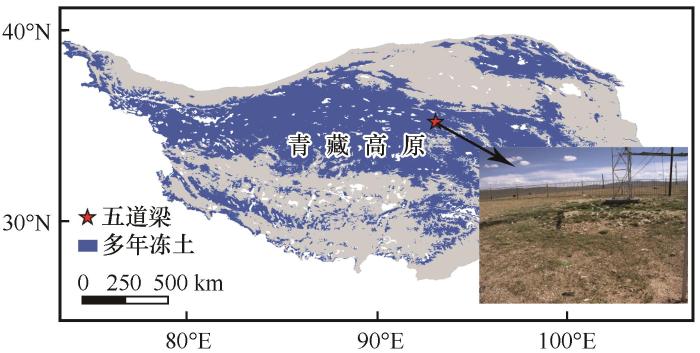
... 青藏高原五道梁地区(35°13′N、93°05′E,海拔4 783 m)位于昆仑山和唐古拉山脉之间的可可西里地区的东边(图1).该地区位于高原北部连续多年冻土区,年均气温-5.1 ℃,年降水量为284.8 mm,下垫面为盖度稀疏的高寒荒漠草原.其气候特征与多年冻土特征有较好的代表性[30-31]. ...
青藏高原能量收支观测实验的新进展
1
1999
... 青藏高原五道梁地区(35°13′N、93°05′E,海拔4 783 m)位于昆仑山和唐古拉山脉之间的可可西里地区的东边(图1).该地区位于高原北部连续多年冻土区,年均气温-5.1 ℃,年降水量为284.8 mm,下垫面为盖度稀疏的高寒荒漠草原.其气候特征与多年冻土特征有较好的代表性[30-31]. ...
Process of freezing and thawing in active layer in Wudaoliang permafrost region of the Tibetan-Qinghai Plateau
1
2000
... 青藏高原五道梁地区(35°13′N、93°05′E,海拔4 783 m)位于昆仑山和唐古拉山脉之间的可可西里地区的东边(图1).该地区位于高原北部连续多年冻土区,年均气温-5.1 ℃,年降水量为284.8 mm,下垫面为盖度稀疏的高寒荒漠草原.其气候特征与多年冻土特征有较好的代表性[30-31]. ...
青藏高原五道梁附近多年冻土活动层冻结和融化过程
1
2000
... 青藏高原五道梁地区(35°13′N、93°05′E,海拔4 783 m)位于昆仑山和唐古拉山脉之间的可可西里地区的东边(图1).该地区位于高原北部连续多年冻土区,年均气温-5.1 ℃,年降水量为284.8 mm,下垫面为盖度稀疏的高寒荒漠草原.其气候特征与多年冻土特征有较好的代表性[30-31]. ...
Evaluation of 11 soil thermal conductivity schemes for the permafrost region of the central Qinghai-Tibet Plateau
1
2020
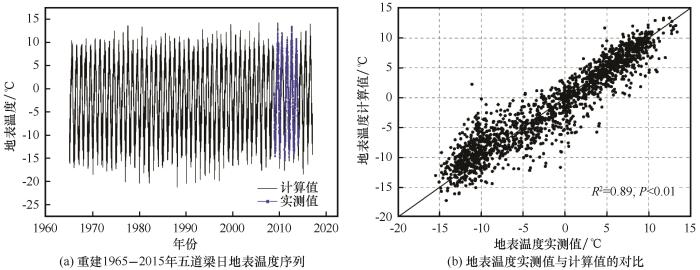
... 藏北高原冰冻圈站在五道梁架设了综合观测站,对五道梁气候变化、地气物质能量交换以及多年冻土的动态变化进行了长期的监测及研究[32-41].冻土监测包括活动层水热监测和钻孔地温监测.活动层水热监测采用美国Campbell公司的CR1000数采仪监测5~60 cm共12层的土壤温度及水分,监测时段2009—2015年.钻孔深40 m,并未打穿多年冻土,地温探头由冻土工程国家重点实验室加工,精度为±0.05 ℃,测量共26层(0~40 m)的土壤温度,监测时段为2005—2015年.根据2015年的监测数据,该年的地表平均温度为-1.77 ℃,活动层为2.4 m,地温年变化深度(ZAA)大约为7 m,年平均地温(MAGT)为-1.5 ℃. ...
Variations in soil temperature from 1980 to 2015 in permafrost regions on the Qinghai-Tibetan Plateau based on observed and reanalysis products
0
2019
Soil thermal regime of active layer in Wudaoliang region of the Yangzi Rive source
0
2013
The features of each components in the surface heat balance equation over Wudaoliang, northern Tibetan Plateau
0
2007
青藏高原北部五道梁地表热量平衡方程中各分量特征
0
2007
Monitoring and analysis of surface deformation in the permafrost area of Wudaoliang on the Tibetan Plateau based on Sentinel-1 data
0
2019
基于Sentinel-1数据对青藏高原五道梁多年冻土区地面形变的监测与分析
0
2019
The characteristics of surface albedo in permafrost regions of northern Tibetan Plateau
0
2010
藏北高原多年冻土区地表反照率特征分析
0
2010
Changing climate and the permafrost environment on the Qinghai-Tibet (Xizang) Plateau
0
2020
A model for obtaining ground temperature from air temperature in permafrost regions on the Qinghai-Tibetan Plateau
0
2020
Permafrost change and its effects on hydrological processes on Qinghai-Tibet Plateau
0
2019
青藏高原多年冻土变化对水文过程的影响
0
2019
Characteristic, changes and impacts of permafrost on Qinghai-Tibet Plateau
1
2019
... 藏北高原冰冻圈站在五道梁架设了综合观测站,对五道梁气候变化、地气物质能量交换以及多年冻土的动态变化进行了长期的监测及研究[32-41].冻土监测包括活动层水热监测和钻孔地温监测.活动层水热监测采用美国Campbell公司的CR1000数采仪监测5~60 cm共12层的土壤温度及水分,监测时段2009—2015年.钻孔深40 m,并未打穿多年冻土,地温探头由冻土工程国家重点实验室加工,精度为±0.05 ℃,测量共26层(0~40 m)的土壤温度,监测时段为2005—2015年.根据2015年的监测数据,该年的地表平均温度为-1.77 ℃,活动层为2.4 m,地温年变化深度(ZAA)大约为7 m,年平均地温(MAGT)为-1.5 ℃. ...
青藏高原多年冻土特征、变化及影响
1
2019
... 藏北高原冰冻圈站在五道梁架设了综合观测站,对五道梁气候变化、地气物质能量交换以及多年冻土的动态变化进行了长期的监测及研究[32-41].冻土监测包括活动层水热监测和钻孔地温监测.活动层水热监测采用美国Campbell公司的CR1000数采仪监测5~60 cm共12层的土壤温度及水分,监测时段2009—2015年.钻孔深40 m,并未打穿多年冻土,地温探头由冻土工程国家重点实验室加工,精度为±0.05 ℃,测量共26层(0~40 m)的土壤温度,监测时段为2005—2015年.根据2015年的监测数据,该年的地表平均温度为-1.77 ℃,活动层为2.4 m,地温年变化深度(ZAA)大约为7 m,年平均地温(MAGT)为-1.5 ℃. ...
The projection of temperature and precipitation over China under RCP scenarios using a CMIP5 multi-model ensemble
1
2012
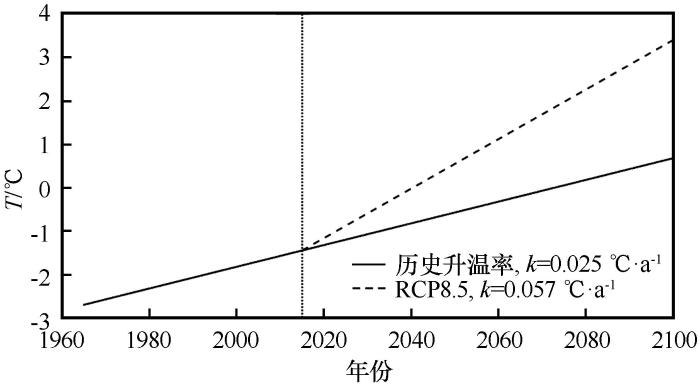
... 此外,根据第5次耦合模式比较计划(CMIP5)11个气候模式的预测结果,2011—2100年中国气温升温率为0.006~0.063 ℃·a-1[42].在RCP8.5情景下,青藏高原地表气温最大升温率最大能达到0.057 ℃·a-1[43].在本研究中,为探究百年尺度气候变化对模拟多年冻土温度场变化的影响,假设两个未来(2015—2100年)升温情景:一是假设重建的历史地温升温率(k=0.025 ℃·a-1)在未来一致持续,二是在RCP8.5极端气候升温情景下假设地表温度与气温以相同速率上升(k=0.057 ℃·a-1),驱动采用不同下边界方案的模型模拟2015—2100年的未来多年冻土的变化(图3). ...
Evaluation and projections of permafrost on the Qinghai-Xizang Plateau by CMIP5 coupled climate models
1
2016
... 此外,根据第5次耦合模式比较计划(CMIP5)11个气候模式的预测结果,2011—2100年中国气温升温率为0.006~0.063 ℃·a-1[42].在RCP8.5情景下,青藏高原地表气温最大升温率最大能达到0.057 ℃·a-1[43].在本研究中,为探究百年尺度气候变化对模拟多年冻土温度场变化的影响,假设两个未来(2015—2100年)升温情景:一是假设重建的历史地温升温率(k=0.025 ℃·a-1)在未来一致持续,二是在RCP8.5极端气候升温情景下假设地表温度与气温以相同速率上升(k=0.057 ℃·a-1),驱动采用不同下边界方案的模型模拟2015—2100年的未来多年冻土的变化(图3). ...
CMIP5耦合模式对青藏高原冻土变化的模拟和预估
1
2016
... 此外,根据第5次耦合模式比较计划(CMIP5)11个气候模式的预测结果,2011—2100年中国气温升温率为0.006~0.063 ℃·a-1[42].在RCP8.5情景下,青藏高原地表气温最大升温率最大能达到0.057 ℃·a-1[43].在本研究中,为探究百年尺度气候变化对模拟多年冻土温度场变化的影响,假设两个未来(2015—2100年)升温情景:一是假设重建的历史地温升温率(k=0.025 ℃·a-1)在未来一致持续,二是在RCP8.5极端气候升温情景下假设地表温度与气温以相同速率上升(k=0.057 ℃·a-1),驱动采用不同下边界方案的模型模拟2015—2100年的未来多年冻土的变化(图3). ...
Relationship between permafrost and gas hydrates on Qinghai-Tibet Plateau
1
2006
... 现有冻土数值模拟计算中,下边界条件的设置差异主要包括设置深度不同和设置方式不同.综合现有主要的冻土模式对于下边界条件的设置,本文设计3个下边界深度:10 m(大气环流模式中的冻土层一般设置的范围[22],且位于研究区地温年变化深度以下)、40 m(研究区钻孔底部)和100 m(一些专门针对百年尺度多年冻土变化数值模拟研究所采用下边界深度[17, 20]);3种下边界条件的设置方式:零地热通量(不考虑地热影响,第二类边界条件)、恒定地热流(第二类边界条件)和相应岩土层的恒定温度(第一类边界条件).3个深度和3种设置方式进行相互组合,共设计9种下边界条件方案(表2).根据五道梁地区的深孔(大于60 m)的相关文献[44-45],深层地热梯度约为0.03 ℃·m-1,换算成地热流(方案4~6). ...
青藏高原天然气水合物的形成与多年冻土的关系
1
2006
... 现有冻土数值模拟计算中,下边界条件的设置差异主要包括设置深度不同和设置方式不同.综合现有主要的冻土模式对于下边界条件的设置,本文设计3个下边界深度:10 m(大气环流模式中的冻土层一般设置的范围[22],且位于研究区地温年变化深度以下)、40 m(研究区钻孔底部)和100 m(一些专门针对百年尺度多年冻土变化数值模拟研究所采用下边界深度[17, 20]);3种下边界条件的设置方式:零地热通量(不考虑地热影响,第二类边界条件)、恒定地热流(第二类边界条件)和相应岩土层的恒定温度(第一类边界条件).3个深度和3种设置方式进行相互组合,共设计9种下边界条件方案(表2).根据五道梁地区的深孔(大于60 m)的相关文献[44-45],深层地热梯度约为0.03 ℃·m-1,换算成地热流(方案4~6). ...
Reconstruction of the past ground surface temperature changes using borhole paleothermometry
1
2015
... 现有冻土数值模拟计算中,下边界条件的设置差异主要包括设置深度不同和设置方式不同.综合现有主要的冻土模式对于下边界条件的设置,本文设计3个下边界深度:10 m(大气环流模式中的冻土层一般设置的范围[22],且位于研究区地温年变化深度以下)、40 m(研究区钻孔底部)和100 m(一些专门针对百年尺度多年冻土变化数值模拟研究所采用下边界深度[17, 20]);3种下边界条件的设置方式:零地热通量(不考虑地热影响,第二类边界条件)、恒定地热流(第二类边界条件)和相应岩土层的恒定温度(第一类边界条件).3个深度和3种设置方式进行相互组合,共设计9种下边界条件方案(表2).根据五道梁地区的深孔(大于60 m)的相关文献[44-45],深层地热梯度约为0.03 ℃·m-1,换算成地热流(方案4~6). ...
利用钻孔温度梯度重建过去地表温度变化研究
1
2015
... 现有冻土数值模拟计算中,下边界条件的设置差异主要包括设置深度不同和设置方式不同.综合现有主要的冻土模式对于下边界条件的设置,本文设计3个下边界深度:10 m(大气环流模式中的冻土层一般设置的范围[22],且位于研究区地温年变化深度以下)、40 m(研究区钻孔底部)和100 m(一些专门针对百年尺度多年冻土变化数值模拟研究所采用下边界深度[17, 20]);3种下边界条件的设置方式:零地热通量(不考虑地热影响,第二类边界条件)、恒定地热流(第二类边界条件)和相应岩土层的恒定温度(第一类边界条件).3个深度和3种设置方式进行相互组合,共设计9种下边界条件方案(表2).根据五道梁地区的深孔(大于60 m)的相关文献[44-45],深层地热梯度约为0.03 ℃·m-1,换算成地热流(方案4~6). ...
Processes and modes of permafrost degradation on the Qinghai-Tibet Plateau
1
2010
... 从相变热传导理论的角度,采用恒定地热流作为第二类下边界条件的方案4~6相对更符合实际的物理过程 [14,26].在预热结束后方案4~6计算的1965年地温-深度曲线也基本重合[图4(b1)],而随着地表升温,方案4~6的多年冻土2015年地温模拟结果能较好的符合实测值[图4(b2)],也能较好的再现各岩土层实测近十年的升温情况[图5(b1~b5)].就方案4~6相互比较而言,下边界深度设置越浅,多年冻土地温模拟结果就会越偏高.这是因为在实验第三步地温自上而下逐步升高时,上层的地温梯度会减小,同时又受到岩土层下部地热流作用,使得整个地温曲线随时间呈现“弓形”[46].实测的上层多年冻土垂直剖面的地温梯度小于深层的垂直剖面地温梯度.若下边界深度设得浅,又采用深层的地温梯度换算的恒定地热流作为下边界条件,则会高估来自岩土层下部地热流输入的能量,进而模拟出偏高的多年冻土温度. ...
青藏高原多年冻土退化过程及方式
1
2009
... 从相变热传导理论的角度,采用恒定地热流作为第二类下边界条件的方案4~6相对更符合实际的物理过程 [14,26].在预热结束后方案4~6计算的1965年地温-深度曲线也基本重合[图4(b1)],而随着地表升温,方案4~6的多年冻土2015年地温模拟结果能较好的符合实测值[图4(b2)],也能较好的再现各岩土层实测近十年的升温情况[图5(b1~b5)].就方案4~6相互比较而言,下边界深度设置越浅,多年冻土地温模拟结果就会越偏高.这是因为在实验第三步地温自上而下逐步升高时,上层的地温梯度会减小,同时又受到岩土层下部地热流作用,使得整个地温曲线随时间呈现“弓形”[46].实测的上层多年冻土垂直剖面的地温梯度小于深层的垂直剖面地温梯度.若下边界深度设得浅,又采用深层的地温梯度换算的恒定地热流作为下边界条件,则会高估来自岩土层下部地热流输入的能量,进而模拟出偏高的多年冻土温度. ...
Assessment of frozen-ground conditions for engineering geology along the Qinghai-Tibet highway and railway, China
1
2008
... 如表3所示,以方案6为基准值时,其他方案的3 m以上岩土层温度场模拟结果的MAE均小于0.1 ℃,由于所有方案的上边界条件设置相同,说明3 m以上岩土层温度变化基本完全由上边界年际气候变化所决定,从热传导的角度可把3 m以上的岩土层划为“近地表层”,其不受岩土层下部的地热能量影响.对于不考虑地热影响的方案1~3,其3~15 m岩土层温度模拟结果的MAE在0.1~0.5 ℃之间(若以实测为基准值,MAE在0.27~0.44 ℃之间),说明该深度范围的岩土层温度变化虽然还是主要受控于年际气候变化,但随着深度增加,下边界设置的影响开始逐渐显现,该深度范围的岩土层可划为“浅层”;15~30 m岩土层温度模拟结果的MAE在0.5~1 ℃之间(若以实测为基准值,MAE在0.44~0.97 ℃之间),说明该深度范围的岩土层温度变化已经开始受到岩土层下部地热能量的显著影响.青藏高原的多年冻土地温年变化深度通常在12~20 m之间[47],计算15~30 m的多年冻土温度时,如果不考虑地热影响,可能会导致较大的误差进而误判多年冻土的类型,该深度范围可划为“中层”;30 m以下岩土层的温度模拟结果的MAE已经大于1 ℃(若以实测为基准值,方案3的MAE同样大于1 ℃),说明使用不考虑地热影响的方案计算30 m以下岩土层的温度应当是不可取的.因此,30 m以下岩的深度范围可以划为“深层”. ...
A projection of permafrost degradation on the Tibetan Plateau during the 21st century
1
2012
... 下边界深度应设置在地热流或温度比较稳定的岩土层,即在所研究的时间尺度内,上边界气候变化难以影响到的岩土层.目前对于气候变暖的背景下青藏高原多年冻土变化的模拟及预估的研究,主要还是集中于近百年尺度内[48].因此,下面探讨在两种未来升温情景下,不同下边界条件的设置对百年尺度多年冻土温度场模拟的影响. ...
Thermal regim es and degradation modes of permafrost along the Qinghai-Tibet Highway
1
2006
... (3)如果研究关注十年或十年以上多年冻土年平均温度(MAGT)的变化,应当不可忽视来自岩土层下部地热能量,建议下边界采用恒定地热流,设置在中层或深层.恒定温度(第一类边界条件)作为下边界条件时,无法反映下边界位置附近的多年冻土温度的变化.因此,仅仅对于地温年际没有变化或变化很小的情景,恒温边界才是可行的.对于处于零地热梯度相变过渡型多年冻土[49],则建议下边界设置在多年冻土底板以下的融土层. ...
青藏公路沿线冻土的地温特征及退化方式
1
2006
... (3)如果研究关注十年或十年以上多年冻土年平均温度(MAGT)的变化,应当不可忽视来自岩土层下部地热能量,建议下边界采用恒定地热流,设置在中层或深层.恒定温度(第一类边界条件)作为下边界条件时,无法反映下边界位置附近的多年冻土温度的变化.因此,仅仅对于地温年际没有变化或变化很小的情景,恒温边界才是可行的.对于处于零地热梯度相变过渡型多年冻土[49],则建议下边界设置在多年冻土底板以下的融土层. ...


 甘公网安备 62010202000676号