2
2010
... 运动是冰川的固有属性,是冰川区别于其他冰体的主要标志[1].冰川运动在其动力学系统的控制下,通过改变物质的分布,影响冰川几何形状、物质平衡、水热及边界的变化[1].冰川运动速度作为冰川动力学模型的重要参数,不仅能响应物质平衡变化,同时也能反应冰川的动态信息[2-3].在全球变暖的背景下,研究冰川运动及其变化规律,对区域经济发展、资源合理利用和自然灾害预警有着重要意义. ...
... [1].冰川运动速度作为冰川动力学模型的重要参数,不仅能响应物质平衡变化,同时也能反应冰川的动态信息[2-3].在全球变暖的背景下,研究冰川运动及其变化规律,对区域经济发展、资源合理利用和自然灾害预警有着重要意义. ...
A Landsat-based dataset of glacier velocity in Eastern Pamir from 1989 to 2020
2
2021
... 运动是冰川的固有属性,是冰川区别于其他冰体的主要标志[1].冰川运动在其动力学系统的控制下,通过改变物质的分布,影响冰川几何形状、物质平衡、水热及边界的变化[1].冰川运动速度作为冰川动力学模型的重要参数,不仅能响应物质平衡变化,同时也能反应冰川的动态信息[2-3].在全球变暖的背景下,研究冰川运动及其变化规律,对区域经济发展、资源合理利用和自然灾害预警有着重要意义. ...
... 本研究使用的Landsat 8 L1T产品是经过几何精校正的数据,各景数据间的匹配精度较高,无需再次配准,可直接用于位移信息的提取.将参考影像和搜索影像进行傅里叶变换后,通过设置合适大小的窗口和步长,滑动计算两景影像上的最大相关系数,进而获得整个区域在影像成像期间的相对位移[10].该方法相关参数设置如下,参考窗口设为128,搜索窗口设为32,步长设为8.此过程生成3个图层:东西向位移(EW)、南北向位移(NS)、信噪比(SNR).信噪比为从0到1的数值,值越大表示计算出的位移量越可信[2,35].为保证结果的准确性,选择SNR≥0.9的部分.受云和阴影的影响,部分值不能准确反映冰川表面的位移信息,对其进行剔除后,即可得到冰川表面位移量. ...
1989—2020年基于Landsat的东帕米尔高原冰川运动速度数据集
2
2021
... 运动是冰川的固有属性,是冰川区别于其他冰体的主要标志[1].冰川运动在其动力学系统的控制下,通过改变物质的分布,影响冰川几何形状、物质平衡、水热及边界的变化[1].冰川运动速度作为冰川动力学模型的重要参数,不仅能响应物质平衡变化,同时也能反应冰川的动态信息[2-3].在全球变暖的背景下,研究冰川运动及其变化规律,对区域经济发展、资源合理利用和自然灾害预警有着重要意义. ...
... 本研究使用的Landsat 8 L1T产品是经过几何精校正的数据,各景数据间的匹配精度较高,无需再次配准,可直接用于位移信息的提取.将参考影像和搜索影像进行傅里叶变换后,通过设置合适大小的窗口和步长,滑动计算两景影像上的最大相关系数,进而获得整个区域在影像成像期间的相对位移[10].该方法相关参数设置如下,参考窗口设为128,搜索窗口设为32,步长设为8.此过程生成3个图层:东西向位移(EW)、南北向位移(NS)、信噪比(SNR).信噪比为从0到1的数值,值越大表示计算出的位移量越可信[2,35].为保证结果的准确性,选择SNR≥0.9的部分.受云和阴影的影响,部分值不能准确反映冰川表面的位移信息,对其进行剔除后,即可得到冰川表面位移量. ...
Surface velocity on the Glacier No. 51 at Haxilegen of the Kuytun River, Tianshan Mountains
1
2012
... 运动是冰川的固有属性,是冰川区别于其他冰体的主要标志[1].冰川运动在其动力学系统的控制下,通过改变物质的分布,影响冰川几何形状、物质平衡、水热及边界的变化[1].冰川运动速度作为冰川动力学模型的重要参数,不仅能响应物质平衡变化,同时也能反应冰川的动态信息[2-3].在全球变暖的背景下,研究冰川运动及其变化规律,对区域经济发展、资源合理利用和自然灾害预警有着重要意义. ...
天山奎屯河哈希勒根51号冰川表面运动特征分析
1
2012
... 运动是冰川的固有属性,是冰川区别于其他冰体的主要标志[1].冰川运动在其动力学系统的控制下,通过改变物质的分布,影响冰川几何形状、物质平衡、水热及边界的变化[1].冰川运动速度作为冰川动力学模型的重要参数,不仅能响应物质平衡变化,同时也能反应冰川的动态信息[2-3].在全球变暖的背景下,研究冰川运动及其变化规律,对区域经济发展、资源合理利用和自然灾害预警有着重要意义. ...
Progress of the research on glacier velocities in China
1
2010
... 冰川运动速度的提取方法主要包括实地测量和遥感监测[4-5].实地测量是在冰面上布设花杆,通过花杆的位置变化测量冰川运动速度.尽管实地测量能获得精度高、连续性好的数据,但由于山地环境恶劣和成本的限制,无法进行长周期、大范围的观测[6-7].遥感监测具有获取速度快、监测范围广的优势,可弥补实地测量的不足[8-9].基于遥感影像的冰川运动速度提取方法主要有雷达差分干涉测量、SAR偏移量跟踪和光学影像互相关[10].由于山地冰川地形复杂且消融较为强烈,获取高相干影像较为困难,因此很少采用雷达差分干涉测量[11-12].基于SAR数据的偏移量跟踪方法受天气影响小,但长时间冰川消融导致较大表面差异,较适合短时间尺度的冰川运动速度提取[5,13].而光学影像互相关方法虽受天气影响,但历史资料丰富,已被广泛应用于年尺度的冰川运动速度研究中[14-15]. ...
中国冰川运动速度研究进展
1
2010
... 冰川运动速度的提取方法主要包括实地测量和遥感监测[4-5].实地测量是在冰面上布设花杆,通过花杆的位置变化测量冰川运动速度.尽管实地测量能获得精度高、连续性好的数据,但由于山地环境恶劣和成本的限制,无法进行长周期、大范围的观测[6-7].遥感监测具有获取速度快、监测范围广的优势,可弥补实地测量的不足[8-9].基于遥感影像的冰川运动速度提取方法主要有雷达差分干涉测量、SAR偏移量跟踪和光学影像互相关[10].由于山地冰川地形复杂且消融较为强烈,获取高相干影像较为困难,因此很少采用雷达差分干涉测量[11-12].基于SAR数据的偏移量跟踪方法受天气影响小,但长时间冰川消融导致较大表面差异,较适合短时间尺度的冰川运动速度提取[5,13].而光学影像互相关方法虽受天气影响,但历史资料丰富,已被广泛应用于年尺度的冰川运动速度研究中[14-15]. ...
The glaciers climate change initiative: methods for creating glacier area, elevation change and velocity products
2
2015
... 冰川运动速度的提取方法主要包括实地测量和遥感监测[4-5].实地测量是在冰面上布设花杆,通过花杆的位置变化测量冰川运动速度.尽管实地测量能获得精度高、连续性好的数据,但由于山地环境恶劣和成本的限制,无法进行长周期、大范围的观测[6-7].遥感监测具有获取速度快、监测范围广的优势,可弥补实地测量的不足[8-9].基于遥感影像的冰川运动速度提取方法主要有雷达差分干涉测量、SAR偏移量跟踪和光学影像互相关[10].由于山地冰川地形复杂且消融较为强烈,获取高相干影像较为困难,因此很少采用雷达差分干涉测量[11-12].基于SAR数据的偏移量跟踪方法受天气影响小,但长时间冰川消融导致较大表面差异,较适合短时间尺度的冰川运动速度提取[5,13].而光学影像互相关方法虽受天气影响,但历史资料丰富,已被广泛应用于年尺度的冰川运动速度研究中[14-15]. ...
... [5,13].而光学影像互相关方法虽受天气影响,但历史资料丰富,已被广泛应用于年尺度的冰川运动速度研究中[14-15]. ...
Features of the surface flow velocity on the Qingbingtan Glacier No.72, Tianshan Mountains
1
2011
... 冰川运动速度的提取方法主要包括实地测量和遥感监测[4-5].实地测量是在冰面上布设花杆,通过花杆的位置变化测量冰川运动速度.尽管实地测量能获得精度高、连续性好的数据,但由于山地环境恶劣和成本的限制,无法进行长周期、大范围的观测[6-7].遥感监测具有获取速度快、监测范围广的优势,可弥补实地测量的不足[8-9].基于遥感影像的冰川运动速度提取方法主要有雷达差分干涉测量、SAR偏移量跟踪和光学影像互相关[10].由于山地冰川地形复杂且消融较为强烈,获取高相干影像较为困难,因此很少采用雷达差分干涉测量[11-12].基于SAR数据的偏移量跟踪方法受天气影响小,但长时间冰川消融导致较大表面差异,较适合短时间尺度的冰川运动速度提取[5,13].而光学影像互相关方法虽受天气影响,但历史资料丰富,已被广泛应用于年尺度的冰川运动速度研究中[14-15]. ...
天山托木尔峰地区青冰滩72号冰川表面运动速度特征研究
1
2011
... 冰川运动速度的提取方法主要包括实地测量和遥感监测[4-5].实地测量是在冰面上布设花杆,通过花杆的位置变化测量冰川运动速度.尽管实地测量能获得精度高、连续性好的数据,但由于山地环境恶劣和成本的限制,无法进行长周期、大范围的观测[6-7].遥感监测具有获取速度快、监测范围广的优势,可弥补实地测量的不足[8-9].基于遥感影像的冰川运动速度提取方法主要有雷达差分干涉测量、SAR偏移量跟踪和光学影像互相关[10].由于山地冰川地形复杂且消融较为强烈,获取高相干影像较为困难,因此很少采用雷达差分干涉测量[11-12].基于SAR数据的偏移量跟踪方法受天气影响小,但长时间冰川消融导致较大表面差异,较适合短时间尺度的冰川运动速度提取[5,13].而光学影像互相关方法虽受天气影响,但历史资料丰富,已被广泛应用于年尺度的冰川运动速度研究中[14-15]. ...
Surface flow velocities of the Ningchanhe No.1 and Shuiguanhe No.4 Glaciers in the East Qilian Mountains
1
2013
... 冰川运动速度的提取方法主要包括实地测量和遥感监测[4-5].实地测量是在冰面上布设花杆,通过花杆的位置变化测量冰川运动速度.尽管实地测量能获得精度高、连续性好的数据,但由于山地环境恶劣和成本的限制,无法进行长周期、大范围的观测[6-7].遥感监测具有获取速度快、监测范围广的优势,可弥补实地测量的不足[8-9].基于遥感影像的冰川运动速度提取方法主要有雷达差分干涉测量、SAR偏移量跟踪和光学影像互相关[10].由于山地冰川地形复杂且消融较为强烈,获取高相干影像较为困难,因此很少采用雷达差分干涉测量[11-12].基于SAR数据的偏移量跟踪方法受天气影响小,但长时间冰川消融导致较大表面差异,较适合短时间尺度的冰川运动速度提取[5,13].而光学影像互相关方法虽受天气影响,但历史资料丰富,已被广泛应用于年尺度的冰川运动速度研究中[14-15]. ...
祁连山东段宁缠河1号冰川和水管河4号冰川表面运动速度研究
1
2013
... 冰川运动速度的提取方法主要包括实地测量和遥感监测[4-5].实地测量是在冰面上布设花杆,通过花杆的位置变化测量冰川运动速度.尽管实地测量能获得精度高、连续性好的数据,但由于山地环境恶劣和成本的限制,无法进行长周期、大范围的观测[6-7].遥感监测具有获取速度快、监测范围广的优势,可弥补实地测量的不足[8-9].基于遥感影像的冰川运动速度提取方法主要有雷达差分干涉测量、SAR偏移量跟踪和光学影像互相关[10].由于山地冰川地形复杂且消融较为强烈,获取高相干影像较为困难,因此很少采用雷达差分干涉测量[11-12].基于SAR数据的偏移量跟踪方法受天气影响小,但长时间冰川消融导致较大表面差异,较适合短时间尺度的冰川运动速度提取[5,13].而光学影像互相关方法虽受天气影响,但历史资料丰富,已被广泛应用于年尺度的冰川运动速度研究中[14-15]. ...
Dynamics of surge‐type glaciers in West Kunlun Shan, northwestern Tibet
1
2015
... 冰川运动速度的提取方法主要包括实地测量和遥感监测[4-5].实地测量是在冰面上布设花杆,通过花杆的位置变化测量冰川运动速度.尽管实地测量能获得精度高、连续性好的数据,但由于山地环境恶劣和成本的限制,无法进行长周期、大范围的观测[6-7].遥感监测具有获取速度快、监测范围广的优势,可弥补实地测量的不足[8-9].基于遥感影像的冰川运动速度提取方法主要有雷达差分干涉测量、SAR偏移量跟踪和光学影像互相关[10].由于山地冰川地形复杂且消融较为强烈,获取高相干影像较为困难,因此很少采用雷达差分干涉测量[11-12].基于SAR数据的偏移量跟踪方法受天气影响小,但长时间冰川消融导致较大表面差异,较适合短时间尺度的冰川运动速度提取[5,13].而光学影像互相关方法虽受天气影响,但历史资料丰富,已被广泛应用于年尺度的冰川运动速度研究中[14-15]. ...
Seasonal surface velocities of a Himalayan glacier derived by automated correlation of unmanned aerial vehicle imagery
1
2016
... 冰川运动速度的提取方法主要包括实地测量和遥感监测[4-5].实地测量是在冰面上布设花杆,通过花杆的位置变化测量冰川运动速度.尽管实地测量能获得精度高、连续性好的数据,但由于山地环境恶劣和成本的限制,无法进行长周期、大范围的观测[6-7].遥感监测具有获取速度快、监测范围广的优势,可弥补实地测量的不足[8-9].基于遥感影像的冰川运动速度提取方法主要有雷达差分干涉测量、SAR偏移量跟踪和光学影像互相关[10].由于山地冰川地形复杂且消融较为强烈,获取高相干影像较为困难,因此很少采用雷达差分干涉测量[11-12].基于SAR数据的偏移量跟踪方法受天气影响小,但长时间冰川消融导致较大表面差异,较适合短时间尺度的冰川运动速度提取[5,13].而光学影像互相关方法虽受天气影响,但历史资料丰富,已被广泛应用于年尺度的冰川运动速度研究中[14-15]. ...
Research of glacier flow velocity: current situation and prospects
3
2020
... 冰川运动速度的提取方法主要包括实地测量和遥感监测[4-5].实地测量是在冰面上布设花杆,通过花杆的位置变化测量冰川运动速度.尽管实地测量能获得精度高、连续性好的数据,但由于山地环境恶劣和成本的限制,无法进行长周期、大范围的观测[6-7].遥感监测具有获取速度快、监测范围广的优势,可弥补实地测量的不足[8-9].基于遥感影像的冰川运动速度提取方法主要有雷达差分干涉测量、SAR偏移量跟踪和光学影像互相关[10].由于山地冰川地形复杂且消融较为强烈,获取高相干影像较为困难,因此很少采用雷达差分干涉测量[11-12].基于SAR数据的偏移量跟踪方法受天气影响小,但长时间冰川消融导致较大表面差异,较适合短时间尺度的冰川运动速度提取[5,13].而光学影像互相关方法虽受天气影响,但历史资料丰富,已被广泛应用于年尺度的冰川运动速度研究中[14-15]. ...
... 本研究使用的Landsat 8 L1T产品是经过几何精校正的数据,各景数据间的匹配精度较高,无需再次配准,可直接用于位移信息的提取.将参考影像和搜索影像进行傅里叶变换后,通过设置合适大小的窗口和步长,滑动计算两景影像上的最大相关系数,进而获得整个区域在影像成像期间的相对位移[10].该方法相关参数设置如下,参考窗口设为128,搜索窗口设为32,步长设为8.此过程生成3个图层:东西向位移(EW)、南北向位移(NS)、信噪比(SNR).信噪比为从0到1的数值,值越大表示计算出的位移量越可信[2,35].为保证结果的准确性,选择SNR≥0.9的部分.受云和阴影的影响,部分值不能准确反映冰川表面的位移信息,对其进行剔除后,即可得到冰川表面位移量. ...
... 由于实测数据有限,基于遥感方法的冰川运动速度误差很难评估[10,38-39].一般假设无冰区在研究时间内保持稳定且未发生运动,那么无冰川区域的测量值可以代表冰川运动速度的误差.结果表明,冰川运动速度误差值为0.007 m·d-1,误差结果整体呈正态分布(图2). ...
冰川运动速度研究:方法、变化、问题与展望
3
2020
... 冰川运动速度的提取方法主要包括实地测量和遥感监测[4-5].实地测量是在冰面上布设花杆,通过花杆的位置变化测量冰川运动速度.尽管实地测量能获得精度高、连续性好的数据,但由于山地环境恶劣和成本的限制,无法进行长周期、大范围的观测[6-7].遥感监测具有获取速度快、监测范围广的优势,可弥补实地测量的不足[8-9].基于遥感影像的冰川运动速度提取方法主要有雷达差分干涉测量、SAR偏移量跟踪和光学影像互相关[10].由于山地冰川地形复杂且消融较为强烈,获取高相干影像较为困难,因此很少采用雷达差分干涉测量[11-12].基于SAR数据的偏移量跟踪方法受天气影响小,但长时间冰川消融导致较大表面差异,较适合短时间尺度的冰川运动速度提取[5,13].而光学影像互相关方法虽受天气影响,但历史资料丰富,已被广泛应用于年尺度的冰川运动速度研究中[14-15]. ...
... 本研究使用的Landsat 8 L1T产品是经过几何精校正的数据,各景数据间的匹配精度较高,无需再次配准,可直接用于位移信息的提取.将参考影像和搜索影像进行傅里叶变换后,通过设置合适大小的窗口和步长,滑动计算两景影像上的最大相关系数,进而获得整个区域在影像成像期间的相对位移[10].该方法相关参数设置如下,参考窗口设为128,搜索窗口设为32,步长设为8.此过程生成3个图层:东西向位移(EW)、南北向位移(NS)、信噪比(SNR).信噪比为从0到1的数值,值越大表示计算出的位移量越可信[2,35].为保证结果的准确性,选择SNR≥0.9的部分.受云和阴影的影响,部分值不能准确反映冰川表面的位移信息,对其进行剔除后,即可得到冰川表面位移量. ...
... 由于实测数据有限,基于遥感方法的冰川运动速度误差很难评估[10,38-39].一般假设无冰区在研究时间内保持稳定且未发生运动,那么无冰川区域的测量值可以代表冰川运动速度的误差.结果表明,冰川运动速度误差值为0.007 m·d-1,误差结果整体呈正态分布(图2). ...
Analysis and extraction of mountain glacier parameters using SAR interferometry
1
2009
... 冰川运动速度的提取方法主要包括实地测量和遥感监测[4-5].实地测量是在冰面上布设花杆,通过花杆的位置变化测量冰川运动速度.尽管实地测量能获得精度高、连续性好的数据,但由于山地环境恶劣和成本的限制,无法进行长周期、大范围的观测[6-7].遥感监测具有获取速度快、监测范围广的优势,可弥补实地测量的不足[8-9].基于遥感影像的冰川运动速度提取方法主要有雷达差分干涉测量、SAR偏移量跟踪和光学影像互相关[10].由于山地冰川地形复杂且消融较为强烈,获取高相干影像较为困难,因此很少采用雷达差分干涉测量[11-12].基于SAR数据的偏移量跟踪方法受天气影响小,但长时间冰川消融导致较大表面差异,较适合短时间尺度的冰川运动速度提取[5,13].而光学影像互相关方法虽受天气影响,但历史资料丰富,已被广泛应用于年尺度的冰川运动速度研究中[14-15]. ...
基于SAR干涉测量的山地冰川参数提取与分析
1
2009
... 冰川运动速度的提取方法主要包括实地测量和遥感监测[4-5].实地测量是在冰面上布设花杆,通过花杆的位置变化测量冰川运动速度.尽管实地测量能获得精度高、连续性好的数据,但由于山地环境恶劣和成本的限制,无法进行长周期、大范围的观测[6-7].遥感监测具有获取速度快、监测范围广的优势,可弥补实地测量的不足[8-9].基于遥感影像的冰川运动速度提取方法主要有雷达差分干涉测量、SAR偏移量跟踪和光学影像互相关[10].由于山地冰川地形复杂且消融较为强烈,获取高相干影像较为困难,因此很少采用雷达差分干涉测量[11-12].基于SAR数据的偏移量跟踪方法受天气影响小,但长时间冰川消融导致较大表面差异,较适合短时间尺度的冰川运动速度提取[5,13].而光学影像互相关方法虽受天气影响,但历史资料丰富,已被广泛应用于年尺度的冰川运动速度研究中[14-15]. ...
Research on extraction of alpine glacier surface movement by SAR remote sensing
1
2013
... 冰川运动速度的提取方法主要包括实地测量和遥感监测[4-5].实地测量是在冰面上布设花杆,通过花杆的位置变化测量冰川运动速度.尽管实地测量能获得精度高、连续性好的数据,但由于山地环境恶劣和成本的限制,无法进行长周期、大范围的观测[6-7].遥感监测具有获取速度快、监测范围广的优势,可弥补实地测量的不足[8-9].基于遥感影像的冰川运动速度提取方法主要有雷达差分干涉测量、SAR偏移量跟踪和光学影像互相关[10].由于山地冰川地形复杂且消融较为强烈,获取高相干影像较为困难,因此很少采用雷达差分干涉测量[11-12].基于SAR数据的偏移量跟踪方法受天气影响小,但长时间冰川消融导致较大表面差异,较适合短时间尺度的冰川运动速度提取[5,13].而光学影像互相关方法虽受天气影响,但历史资料丰富,已被广泛应用于年尺度的冰川运动速度研究中[14-15]. ...
山地冰川表面运动雷达遥感监测方法研究
1
2013
... 冰川运动速度的提取方法主要包括实地测量和遥感监测[4-5].实地测量是在冰面上布设花杆,通过花杆的位置变化测量冰川运动速度.尽管实地测量能获得精度高、连续性好的数据,但由于山地环境恶劣和成本的限制,无法进行长周期、大范围的观测[6-7].遥感监测具有获取速度快、监测范围广的优势,可弥补实地测量的不足[8-9].基于遥感影像的冰川运动速度提取方法主要有雷达差分干涉测量、SAR偏移量跟踪和光学影像互相关[10].由于山地冰川地形复杂且消融较为强烈,获取高相干影像较为困难,因此很少采用雷达差分干涉测量[11-12].基于SAR数据的偏移量跟踪方法受天气影响小,但长时间冰川消融导致较大表面差异,较适合短时间尺度的冰川运动速度提取[5,13].而光学影像互相关方法虽受天气影响,但历史资料丰富,已被广泛应用于年尺度的冰川运动速度研究中[14-15]. ...
Application of DInSAR and offset tracking technology in velocity monitoring of mountain glaciers
1
2018
... 冰川运动速度的提取方法主要包括实地测量和遥感监测[4-5].实地测量是在冰面上布设花杆,通过花杆的位置变化测量冰川运动速度.尽管实地测量能获得精度高、连续性好的数据,但由于山地环境恶劣和成本的限制,无法进行长周期、大范围的观测[6-7].遥感监测具有获取速度快、监测范围广的优势,可弥补实地测量的不足[8-9].基于遥感影像的冰川运动速度提取方法主要有雷达差分干涉测量、SAR偏移量跟踪和光学影像互相关[10].由于山地冰川地形复杂且消融较为强烈,获取高相干影像较为困难,因此很少采用雷达差分干涉测量[11-12].基于SAR数据的偏移量跟踪方法受天气影响小,但长时间冰川消融导致较大表面差异,较适合短时间尺度的冰川运动速度提取[5,13].而光学影像互相关方法虽受天气影响,但历史资料丰富,已被广泛应用于年尺度的冰川运动速度研究中[14-15]. ...
DInSAR和偏移量跟踪技术在山地冰川流速监测中的应用
1
2018
... 冰川运动速度的提取方法主要包括实地测量和遥感监测[4-5].实地测量是在冰面上布设花杆,通过花杆的位置变化测量冰川运动速度.尽管实地测量能获得精度高、连续性好的数据,但由于山地环境恶劣和成本的限制,无法进行长周期、大范围的观测[6-7].遥感监测具有获取速度快、监测范围广的优势,可弥补实地测量的不足[8-9].基于遥感影像的冰川运动速度提取方法主要有雷达差分干涉测量、SAR偏移量跟踪和光学影像互相关[10].由于山地冰川地形复杂且消融较为强烈,获取高相干影像较为困难,因此很少采用雷达差分干涉测量[11-12].基于SAR数据的偏移量跟踪方法受天气影响小,但长时间冰川消融导致较大表面差异,较适合短时间尺度的冰川运动速度提取[5,13].而光学影像互相关方法虽受天气影响,但历史资料丰富,已被广泛应用于年尺度的冰川运动速度研究中[14-15]. ...
Surface motion of mountain glaciers derived from satellite optical imagery
1
2005
... 冰川运动速度的提取方法主要包括实地测量和遥感监测[4-5].实地测量是在冰面上布设花杆,通过花杆的位置变化测量冰川运动速度.尽管实地测量能获得精度高、连续性好的数据,但由于山地环境恶劣和成本的限制,无法进行长周期、大范围的观测[6-7].遥感监测具有获取速度快、监测范围广的优势,可弥补实地测量的不足[8-9].基于遥感影像的冰川运动速度提取方法主要有雷达差分干涉测量、SAR偏移量跟踪和光学影像互相关[10].由于山地冰川地形复杂且消融较为强烈,获取高相干影像较为困难,因此很少采用雷达差分干涉测量[11-12].基于SAR数据的偏移量跟踪方法受天气影响小,但长时间冰川消融导致较大表面差异,较适合短时间尺度的冰川运动速度提取[5,13].而光学影像互相关方法虽受天气影响,但历史资料丰富,已被广泛应用于年尺度的冰川运动速度研究中[14-15]. ...
First surface velocity maps for glaciers of Monte Tronador, North Patagonian Andes, derived from sequential Pléiades satellite images
1
2015
... 冰川运动速度的提取方法主要包括实地测量和遥感监测[4-5].实地测量是在冰面上布设花杆,通过花杆的位置变化测量冰川运动速度.尽管实地测量能获得精度高、连续性好的数据,但由于山地环境恶劣和成本的限制,无法进行长周期、大范围的观测[6-7].遥感监测具有获取速度快、监测范围广的优势,可弥补实地测量的不足[8-9].基于遥感影像的冰川运动速度提取方法主要有雷达差分干涉测量、SAR偏移量跟踪和光学影像互相关[10].由于山地冰川地形复杂且消融较为强烈,获取高相干影像较为困难,因此很少采用雷达差分干涉测量[11-12].基于SAR数据的偏移量跟踪方法受天气影响小,但长时间冰川消融导致较大表面差异,较适合短时间尺度的冰川运动速度提取[5,13].而光学影像互相关方法虽受天气影响,但历史资料丰富,已被广泛应用于年尺度的冰川运动速度研究中[14-15]. ...
Research on the DEM-assisted offset tracking technique applied to glaciers movement monitoring
1
2018
... 随着遥感数据时空分辨率的不断提高,基于遥感数据提取冰川运动速度已成为当前研究的热点[16-18].部分学者利用遥感数据对大区域尺度的冰川运动特征进行分析,比如Sam等[19]基于GoLIVE数据分析了喜马拉雅山冰川运动特征;Dehecq等[20]基于Landsat等数据分析了亚洲高山区冰川运动变化特征.也有部分研究者针对单条冰川进行时空变化特征分析,比如Das等[21]对米亚冰川1992—2019年的运动速度时空分布特征及影响因素进行分析;周中正等[22]基于Sentinel-1A影像分析了2016年岗纳楼冰川表面运动速度变化. ...
DEM辅助偏移量跟踪技术的山地冰川运动监测研究
1
2018
... 随着遥感数据时空分辨率的不断提高,基于遥感数据提取冰川运动速度已成为当前研究的热点[16-18].部分学者利用遥感数据对大区域尺度的冰川运动特征进行分析,比如Sam等[19]基于GoLIVE数据分析了喜马拉雅山冰川运动特征;Dehecq等[20]基于Landsat等数据分析了亚洲高山区冰川运动变化特征.也有部分研究者针对单条冰川进行时空变化特征分析,比如Das等[21]对米亚冰川1992—2019年的运动速度时空分布特征及影响因素进行分析;周中正等[22]基于Sentinel-1A影像分析了2016年岗纳楼冰川表面运动速度变化. ...
Dynamic characteristics analysis of Gonggeer Mountain Glacier based on synthetic aperture radar and DEM
0
2014
基于合成孔径雷达技术及DEM的公格尔山冰川动力特征分析
0
2014
The flow state of South Inylchek Glacier in the Tianshan Mountains in 2016: extraction and analysis based on Landsat-8 OLI image
1
2017
... 随着遥感数据时空分辨率的不断提高,基于遥感数据提取冰川运动速度已成为当前研究的热点[16-18].部分学者利用遥感数据对大区域尺度的冰川运动特征进行分析,比如Sam等[19]基于GoLIVE数据分析了喜马拉雅山冰川运动特征;Dehecq等[20]基于Landsat等数据分析了亚洲高山区冰川运动变化特征.也有部分研究者针对单条冰川进行时空变化特征分析,比如Das等[21]对米亚冰川1992—2019年的运动速度时空分布特征及影响因素进行分析;周中正等[22]基于Sentinel-1A影像分析了2016年岗纳楼冰川表面运动速度变化. ...
基于Landsat-8 OLI影像的天山南伊内里切克冰川2016年冰川表面运动状态提取与分析
1
2017
... 随着遥感数据时空分辨率的不断提高,基于遥感数据提取冰川运动速度已成为当前研究的热点[16-18].部分学者利用遥感数据对大区域尺度的冰川运动特征进行分析,比如Sam等[19]基于GoLIVE数据分析了喜马拉雅山冰川运动特征;Dehecq等[20]基于Landsat等数据分析了亚洲高山区冰川运动变化特征.也有部分研究者针对单条冰川进行时空变化特征分析,比如Das等[21]对米亚冰川1992—2019年的运动速度时空分布特征及影响因素进行分析;周中正等[22]基于Sentinel-1A影像分析了2016年岗纳楼冰川表面运动速度变化. ...
Heterogeneity in topographic control on velocities of Western Himalayan glaciers
1
2018
... 随着遥感数据时空分辨率的不断提高,基于遥感数据提取冰川运动速度已成为当前研究的热点[16-18].部分学者利用遥感数据对大区域尺度的冰川运动特征进行分析,比如Sam等[19]基于GoLIVE数据分析了喜马拉雅山冰川运动特征;Dehecq等[20]基于Landsat等数据分析了亚洲高山区冰川运动变化特征.也有部分研究者针对单条冰川进行时空变化特征分析,比如Das等[21]对米亚冰川1992—2019年的运动速度时空分布特征及影响因素进行分析;周中正等[22]基于Sentinel-1A影像分析了2016年岗纳楼冰川表面运动速度变化. ...
Twenty-first century glacier slowdown driven by mass loss in High Mountain Asia
1
2019
... 随着遥感数据时空分辨率的不断提高,基于遥感数据提取冰川运动速度已成为当前研究的热点[16-18].部分学者利用遥感数据对大区域尺度的冰川运动特征进行分析,比如Sam等[19]基于GoLIVE数据分析了喜马拉雅山冰川运动特征;Dehecq等[20]基于Landsat等数据分析了亚洲高山区冰川运动变化特征.也有部分研究者针对单条冰川进行时空变化特征分析,比如Das等[21]对米亚冰川1992—2019年的运动速度时空分布特征及影响因素进行分析;周中正等[22]基于Sentinel-1A影像分析了2016年岗纳楼冰川表面运动速度变化. ...
Flow velocities of the debris-covered Miyar Glacier, western Himalaya, India
2
2021
... 随着遥感数据时空分辨率的不断提高,基于遥感数据提取冰川运动速度已成为当前研究的热点[16-18].部分学者利用遥感数据对大区域尺度的冰川运动特征进行分析,比如Sam等[19]基于GoLIVE数据分析了喜马拉雅山冰川运动特征;Dehecq等[20]基于Landsat等数据分析了亚洲高山区冰川运动变化特征.也有部分研究者针对单条冰川进行时空变化特征分析,比如Das等[21]对米亚冰川1992—2019年的运动速度时空分布特征及影响因素进行分析;周中正等[22]基于Sentinel-1A影像分析了2016年岗纳楼冰川表面运动速度变化. ...
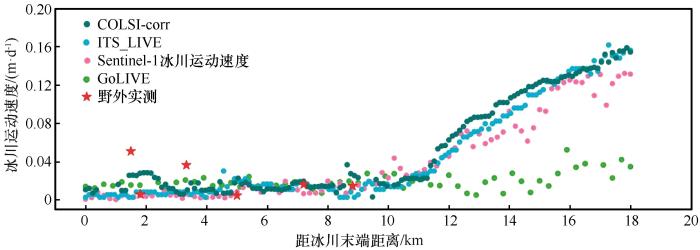
... 提取冰川运动速度的流程主要包括两部分,获取冰川的位移量以及运动速度的计算.本研究使用COSI-Corr(Co-registration of Optically Sensed Images and Correlation)软件包来获取位移信息,该软件包是加州理工学院基于IDL(Interactive Data Language)语言开发的,最初被应用于检测同震形变[30],后被广泛用于处理Landsat、ASTER、SPOT和Quickbird卫星影像.通过COSI-Corr软件对影像进行配准和互相关,其结果精度可达到亚像元级别.在积雪区域,该方法仍能获取精度较高的位移信息,已被证实是基于光学影像监测冰川运动速度的可靠方法[21,33-34]. ...
Extraction and analysis of temporal and spatial variation characteristics of surface velocity of Gangnalou Glacier
1
2022
... 随着遥感数据时空分辨率的不断提高,基于遥感数据提取冰川运动速度已成为当前研究的热点[16-18].部分学者利用遥感数据对大区域尺度的冰川运动特征进行分析,比如Sam等[19]基于GoLIVE数据分析了喜马拉雅山冰川运动特征;Dehecq等[20]基于Landsat等数据分析了亚洲高山区冰川运动变化特征.也有部分研究者针对单条冰川进行时空变化特征分析,比如Das等[21]对米亚冰川1992—2019年的运动速度时空分布特征及影响因素进行分析;周中正等[22]基于Sentinel-1A影像分析了2016年岗纳楼冰川表面运动速度变化. ...
岗纳楼冰川表面流速时空变化特征提取及分析
1
2022
... 随着遥感数据时空分辨率的不断提高,基于遥感数据提取冰川运动速度已成为当前研究的热点[16-18].部分学者利用遥感数据对大区域尺度的冰川运动特征进行分析,比如Sam等[19]基于GoLIVE数据分析了喜马拉雅山冰川运动特征;Dehecq等[20]基于Landsat等数据分析了亚洲高山区冰川运动变化特征.也有部分研究者针对单条冰川进行时空变化特征分析,比如Das等[21]对米亚冰川1992—2019年的运动速度时空分布特征及影响因素进行分析;周中正等[22]基于Sentinel-1A影像分析了2016年岗纳楼冰川表面运动速度变化. ...
Change of the surface velocity of Koxkar Baxi glacier interpreted from remote sensing data, Tianshan Mountain
1
2011
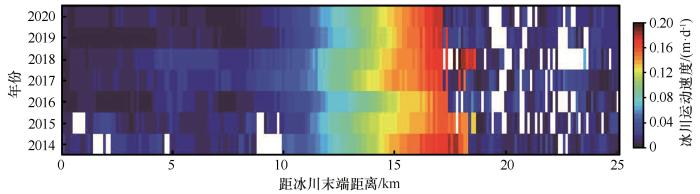
... 科其喀尔巴西冰川表面分布有大量表碛,对其运动速度进行研究,有助于了解表碛覆盖型冰川对气候变化的复杂响应.以往的研究更侧重于冰川运动速度的空间分布以及区域性变化[23-24],对于冰川运动速度年内特征及年际变化特征的认识仍然不足.因此,本研究利用Landsat 8影像提取2014—2020年科其喀尔巴西冰川的运动速度,分析其年内波动特征和年际变化特征,为冰川动力学模型及物质平衡变化提供基础支撑. ...
天山托木尔峰科其喀尔巴西冰川表面运动速度特征分析
1
2011
... 科其喀尔巴西冰川表面分布有大量表碛,对其运动速度进行研究,有助于了解表碛覆盖型冰川对气候变化的复杂响应.以往的研究更侧重于冰川运动速度的空间分布以及区域性变化[23-24],对于冰川运动速度年内特征及年际变化特征的认识仍然不足.因此,本研究利用Landsat 8影像提取2014—2020年科其喀尔巴西冰川的运动速度,分析其年内波动特征和年际变化特征,为冰川动力学模型及物质平衡变化提供基础支撑. ...
Analysis of the flow features in the ablation zone of the Koxkar Glacier on south slopes of the Tianshan Mountains
1
2014
... 科其喀尔巴西冰川表面分布有大量表碛,对其运动速度进行研究,有助于了解表碛覆盖型冰川对气候变化的复杂响应.以往的研究更侧重于冰川运动速度的空间分布以及区域性变化[23-24],对于冰川运动速度年内特征及年际变化特征的认识仍然不足.因此,本研究利用Landsat 8影像提取2014—2020年科其喀尔巴西冰川的运动速度,分析其年内波动特征和年际变化特征,为冰川动力学模型及物质平衡变化提供基础支撑. ...
天山南坡科其喀尔冰川消融区运动特征分析
1
2014
... 科其喀尔巴西冰川表面分布有大量表碛,对其运动速度进行研究,有助于了解表碛覆盖型冰川对气候变化的复杂响应.以往的研究更侧重于冰川运动速度的空间分布以及区域性变化[23-24],对于冰川运动速度年内特征及年际变化特征的认识仍然不足.因此,本研究利用Landsat 8影像提取2014—2020年科其喀尔巴西冰川的运动速度,分析其年内波动特征和年际变化特征,为冰川动力学模型及物质平衡变化提供基础支撑. ...
2
1987
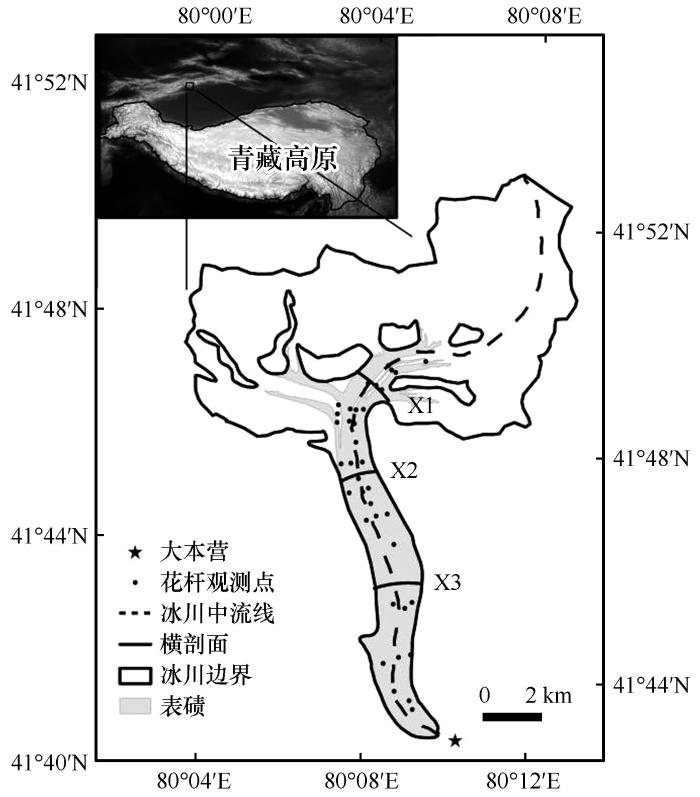
... 科其喀尔巴西冰川(冰川编号:5Y674A0005),位于新疆温宿县,属亚大陆型冰川.冰川表面高程范围为3 020~6 342 m,冰川总长约25.1 km,面积83.56 km2,冰储量15.79 km3,物质平衡线海拔高度为4 350 m[25].该冰川消融期较长[26],从4月中下旬开始消融,9月中下旬消融结束.冰川区受潮湿气流影响[27],降水丰富,5—9月降水量约占全年降水量的75%.据冰川编目资料显示[25],该冰川消融区分布有大量表碛,表碛面积为17.5 km2,占整个冰川面积的21%,其表碛厚度随海拔降低逐渐增加,在冰川末端厚度达到200 cm[28]. ...
... [25],该冰川消融区分布有大量表碛,表碛面积为17.5 km2,占整个冰川面积的21%,其表碛厚度随海拔降低逐渐增加,在冰川末端厚度达到200 cm[28]. ...
2
1987
... 科其喀尔巴西冰川(冰川编号:5Y674A0005),位于新疆温宿县,属亚大陆型冰川.冰川表面高程范围为3 020~6 342 m,冰川总长约25.1 km,面积83.56 km2,冰储量15.79 km3,物质平衡线海拔高度为4 350 m[25].该冰川消融期较长[26],从4月中下旬开始消融,9月中下旬消融结束.冰川区受潮湿气流影响[27],降水丰富,5—9月降水量约占全年降水量的75%.据冰川编目资料显示[25],该冰川消融区分布有大量表碛,表碛面积为17.5 km2,占整个冰川面积的21%,其表碛厚度随海拔降低逐渐增加,在冰川末端厚度达到200 cm[28]. ...
... [25],该冰川消融区分布有大量表碛,表碛面积为17.5 km2,占整个冰川面积的21%,其表碛厚度随海拔降低逐渐增加,在冰川末端厚度达到200 cm[28]. ...
Ablation estimation on the Keqicarbaxi Glacier on the south slopes of the Tianshan Mountains
1
2009
... 科其喀尔巴西冰川(冰川编号:5Y674A0005),位于新疆温宿县,属亚大陆型冰川.冰川表面高程范围为3 020~6 342 m,冰川总长约25.1 km,面积83.56 km2,冰储量15.79 km3,物质平衡线海拔高度为4 350 m[25].该冰川消融期较长[26],从4月中下旬开始消融,9月中下旬消融结束.冰川区受潮湿气流影响[27],降水丰富,5—9月降水量约占全年降水量的75%.据冰川编目资料显示[25],该冰川消融区分布有大量表碛,表碛面积为17.5 km2,占整个冰川面积的21%,其表碛厚度随海拔降低逐渐增加,在冰川末端厚度达到200 cm[28]. ...
天山南坡科其喀尔巴西冰川消融估算
1
2009
... 科其喀尔巴西冰川(冰川编号:5Y674A0005),位于新疆温宿县,属亚大陆型冰川.冰川表面高程范围为3 020~6 342 m,冰川总长约25.1 km,面积83.56 km2,冰储量15.79 km3,物质平衡线海拔高度为4 350 m[25].该冰川消融期较长[26],从4月中下旬开始消融,9月中下旬消融结束.冰川区受潮湿气流影响[27],降水丰富,5—9月降水量约占全年降水量的75%.据冰川编目资料显示[25],该冰川消融区分布有大量表碛,表碛面积为17.5 km2,占整个冰川面积的21%,其表碛厚度随海拔降低逐渐增加,在冰川末端厚度达到200 cm[28]. ...
Snow surface energy balance over the ablation period on the Keqicar Baxi Glacier in the Tianshan Mountain
1
2007
... 科其喀尔巴西冰川(冰川编号:5Y674A0005),位于新疆温宿县,属亚大陆型冰川.冰川表面高程范围为3 020~6 342 m,冰川总长约25.1 km,面积83.56 km2,冰储量15.79 km3,物质平衡线海拔高度为4 350 m[25].该冰川消融期较长[26],从4月中下旬开始消融,9月中下旬消融结束.冰川区受潮湿气流影响[27],降水丰富,5—9月降水量约占全年降水量的75%.据冰川编目资料显示[25],该冰川消融区分布有大量表碛,表碛面积为17.5 km2,占整个冰川面积的21%,其表碛厚度随海拔降低逐渐增加,在冰川末端厚度达到200 cm[28]. ...
天山南坡科契卡尔巴西冰川消融期雪面能量平衡研究
1
2007
... 科其喀尔巴西冰川(冰川编号:5Y674A0005),位于新疆温宿县,属亚大陆型冰川.冰川表面高程范围为3 020~6 342 m,冰川总长约25.1 km,面积83.56 km2,冰储量15.79 km3,物质平衡线海拔高度为4 350 m[25].该冰川消融期较长[26],从4月中下旬开始消融,9月中下旬消融结束.冰川区受潮湿气流影响[27],降水丰富,5—9月降水量约占全年降水量的75%.据冰川编目资料显示[25],该冰川消融区分布有大量表碛,表碛面积为17.5 km2,占整个冰川面积的21%,其表碛厚度随海拔降低逐渐增加,在冰川末端厚度达到200 cm[28]. ...
Variation of Keqikaer Glacier terminus in Tomur Peak during last 30 years
1
2006
... 科其喀尔巴西冰川(冰川编号:5Y674A0005),位于新疆温宿县,属亚大陆型冰川.冰川表面高程范围为3 020~6 342 m,冰川总长约25.1 km,面积83.56 km2,冰储量15.79 km3,物质平衡线海拔高度为4 350 m[25].该冰川消融期较长[26],从4月中下旬开始消融,9月中下旬消融结束.冰川区受潮湿气流影响[27],降水丰富,5—9月降水量约占全年降水量的75%.据冰川编目资料显示[25],该冰川消融区分布有大量表碛,表碛面积为17.5 km2,占整个冰川面积的21%,其表碛厚度随海拔降低逐渐增加,在冰川末端厚度达到200 cm[28]. ...
近30 a来托木尔峰南麓科其喀尔冰川冰舌区变化
1
2006
... 科其喀尔巴西冰川(冰川编号:5Y674A0005),位于新疆温宿县,属亚大陆型冰川.冰川表面高程范围为3 020~6 342 m,冰川总长约25.1 km,面积83.56 km2,冰储量15.79 km3,物质平衡线海拔高度为4 350 m[25].该冰川消融期较长[26],从4月中下旬开始消融,9月中下旬消融结束.冰川区受潮湿气流影响[27],降水丰富,5—9月降水量约占全年降水量的75%.据冰川编目资料显示[25],该冰川消融区分布有大量表碛,表碛面积为17.5 km2,占整个冰川面积的21%,其表碛厚度随海拔降低逐渐增加,在冰川末端厚度达到200 cm[28]. ...
Analysis and comparison of SRTM1 DEM and ASTER GDEM V2 Data
1
2017
... ASTER GDEM(ASTER Globe Digital Elevational Model)由美国NASA和日本METI共同研制并面向全球免费发布.该产品基于ASTER近红外影像数据生成,其水平空间分辨率为30 m[29],数据覆盖了全球99%的陆地表面(83° N~83° S).本研究使用的是第三版数据(ASTER GDEM V3),主要用于获取研究区高程信息.该产品的发布网站为NASA EARTH DATA(https://search.earthdata.nasa.gov/search). ...
SRTM1 DEM与ASTER GDEM V2数据的对比分析
1
2017
... ASTER GDEM(ASTER Globe Digital Elevational Model)由美国NASA和日本METI共同研制并面向全球免费发布.该产品基于ASTER近红外影像数据生成,其水平空间分辨率为30 m[29],数据覆盖了全球99%的陆地表面(83° N~83° S).本研究使用的是第三版数据(ASTER GDEM V3),主要用于获取研究区高程信息.该产品的发布网站为NASA EARTH DATA(https://search.earthdata.nasa.gov/search). ...
ITS_LIVE: a new NASA MEaSUReS initiative to track the movement of the world’s ice
2
2018
... ITS_LIVE(The inter-mission Time Series of Land Ice Velocity and Elevation)数据集[30]提取自Landsat 4、5、7、8卫星影像,涵盖了所有面积大于5 km2的陆地冰区,时间跨度为1985—2020年.该数据有120 m和240 m两种分辨率,本文使用由光学卫星图像对生成的120 m分辨率的速度数据(该数据获取网站为https://its-live.jpl.nasa.gov/). ...
... 提取冰川运动速度的流程主要包括两部分,获取冰川的位移量以及运动速度的计算.本研究使用COSI-Corr(Co-registration of Optically Sensed Images and Correlation)软件包来获取位移信息,该软件包是加州理工学院基于IDL(Interactive Data Language)语言开发的,最初被应用于检测同震形变[30],后被广泛用于处理Landsat、ASTER、SPOT和Quickbird卫星影像.通过COSI-Corr软件对影像进行配准和互相关,其结果精度可达到亚像元级别.在积雪区域,该方法仍能获取精度较高的位移信息,已被证实是基于光学影像监测冰川运动速度的可靠方法[21,33-34]. ...
Rapid large-area mapping of ice flow using Landsat 8
1
2016
... GoLIVE(Global Land Ice Velocity Extraction from Landsat 8)数据集[31]是将Landsat 8影像在空间域中进行归一化互相关,进而提取的冰川运动速度,经过误差调整后的数据精度可达到亚像素级别.该数据集覆盖了82° N~82° S之间的所有陆地冰川,空间分辨率为300 m,并提供多种时间跨度的数据(16 d、32 d、48 d、64 d、80 d和96 d).本文利用多个时间跨度为32 d的数据进行计算,获取年尺度冰川运动速度(该数据集获取网站为https://nsidc.org/data/). ...
Global time series and temporal mosaics of glacier surface velocities derived from Sentinel-1 data
1
2021
... Sentinel-1冰川运动速度数据集[32]是通过强度偏移跟踪技术,从Sentinel-1 SAR影像中提取的冰川运动速度,该数据集涵盖了极地冰盖以外的12个主要冰川区域,并提供分辨率为200 m的月度和年度速度数据.该数据集可从埃尔朗根-纽伦堡大学冰川入口网站获取(http://retreat.geographie.uni-erlangen.de.). ...
Co-registration of optically sensed images and correlation (COSI-Corr): an operational methodology for ground deformation measurements
1
2007
... 提取冰川运动速度的流程主要包括两部分,获取冰川的位移量以及运动速度的计算.本研究使用COSI-Corr(Co-registration of Optically Sensed Images and Correlation)软件包来获取位移信息,该软件包是加州理工学院基于IDL(Interactive Data Language)语言开发的,最初被应用于检测同震形变[30],后被广泛用于处理Landsat、ASTER、SPOT和Quickbird卫星影像.通过COSI-Corr软件对影像进行配准和互相关,其结果精度可达到亚像元级别.在积雪区域,该方法仍能获取精度较高的位移信息,已被证实是基于光学影像监测冰川运动速度的可靠方法[21,33-34]. ...
Glacier-surface velocities in alpine terrain from optical satellite imagery: accuracy improvement and quality assessment
1
2008
... 提取冰川运动速度的流程主要包括两部分,获取冰川的位移量以及运动速度的计算.本研究使用COSI-Corr(Co-registration of Optically Sensed Images and Correlation)软件包来获取位移信息,该软件包是加州理工学院基于IDL(Interactive Data Language)语言开发的,最初被应用于检测同震形变[30],后被广泛用于处理Landsat、ASTER、SPOT和Quickbird卫星影像.通过COSI-Corr软件对影像进行配准和互相关,其结果精度可达到亚像元级别.在积雪区域,该方法仍能获取精度较高的位移信息,已被证实是基于光学影像监测冰川运动速度的可靠方法[21,33-34]. ...
Spatiotemporal variability of velocity and influence of glacier thickness using Landsat imagery: Hunza River Basin, Karakoram Range
1
2021
... 本研究使用的Landsat 8 L1T产品是经过几何精校正的数据,各景数据间的匹配精度较高,无需再次配准,可直接用于位移信息的提取.将参考影像和搜索影像进行傅里叶变换后,通过设置合适大小的窗口和步长,滑动计算两景影像上的最大相关系数,进而获得整个区域在影像成像期间的相对位移[10].该方法相关参数设置如下,参考窗口设为128,搜索窗口设为32,步长设为8.此过程生成3个图层:东西向位移(EW)、南北向位移(NS)、信噪比(SNR).信噪比为从0到1的数值,值越大表示计算出的位移量越可信[2,35].为保证结果的准确性,选择SNR≥0.9的部分.受云和阴影的影响,部分值不能准确反映冰川表面的位移信息,对其进行剔除后,即可得到冰川表面位移量. ...
Evaluation of existing image matching methods for deriving glacier surface displacements globally from optical satellite imagery
1
2012
... 假设无冰区没有运动,那么可将基于遥感图像提取的无冰区运动速度看作误差值[36].误差评估公式为: ...
Multi-decadal mass loss of glaciers in the Everest area (Nepal Himalaya) derived from stereo imagery
1
2011
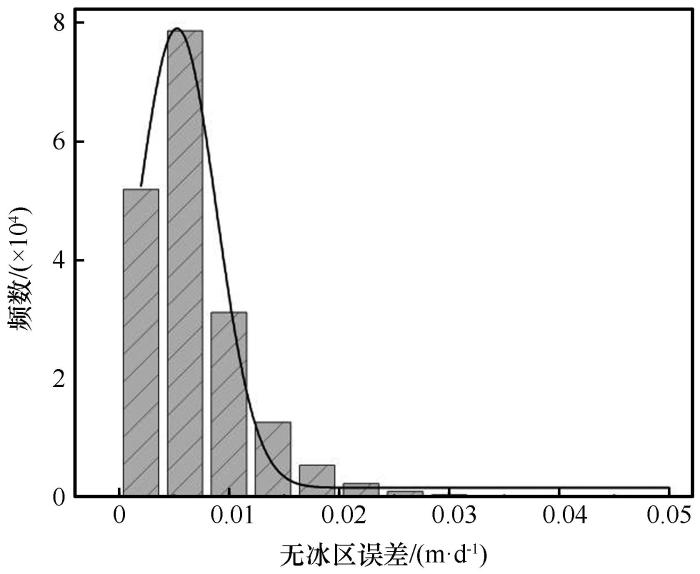
... 式中:Ntotal为无冰区像元的总数;R为像元分辨率;D为去除空间自相关距离,本研究使用Bolch等[37]采用的保守估计,取空间去相关距离为像元分辨率的20倍.由此可得冰川运动速度误差为0.007 m·d-1,远小于冰川的实际运动速率.无冰区的误差分布直方图如图2所示. ...
Characteristic of glaciers’ movement along Karakoram Highway
1
2019
... 由于实测数据有限,基于遥感方法的冰川运动速度误差很难评估[10,38-39].一般假设无冰区在研究时间内保持稳定且未发生运动,那么无冰川区域的测量值可以代表冰川运动速度的误差.结果表明,冰川运动速度误差值为0.007 m·d-1,误差结果整体呈正态分布(图2). ...
中巴公路沿线冰川运动特征
1
2019
... 由于实测数据有限,基于遥感方法的冰川运动速度误差很难评估[10,38-39].一般假设无冰区在研究时间内保持稳定且未发生运动,那么无冰川区域的测量值可以代表冰川运动速度的误差.结果表明,冰川运动速度误差值为0.007 m·d-1,误差结果整体呈正态分布(图2). ...
Reanalysis of multi-temporal aerial images of Storglaci?ren, Sweden (1959–99)–Part 1: determination of length, area, and volume changes
1
2010
... 由于实测数据有限,基于遥感方法的冰川运动速度误差很难评估[10,38-39].一般假设无冰区在研究时间内保持稳定且未发生运动,那么无冰川区域的测量值可以代表冰川运动速度的误差.结果表明,冰川运动速度误差值为0.007 m·d-1,误差结果整体呈正态分布(图2). ...
Glacier variations at Xinqingfeng and Malan Ice Caps in the Inner Tibetan Plateau Since 1970
1
2020
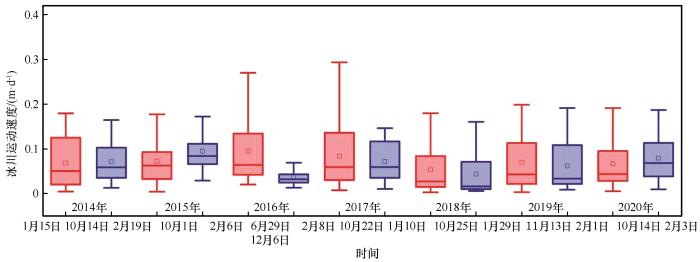
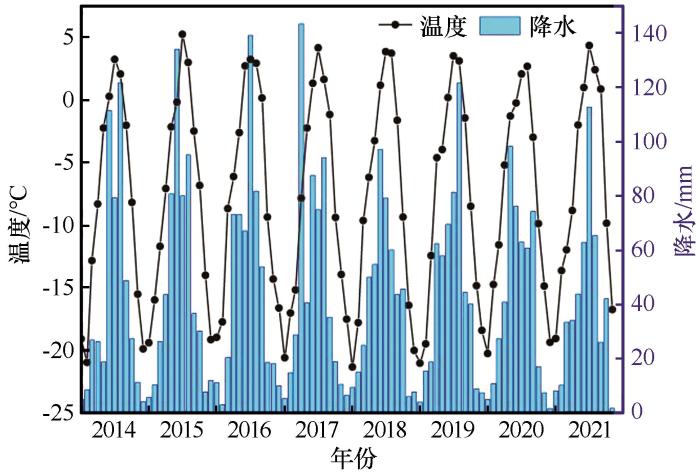
... 科其喀尔巴西冰川运动速度呈现显著的季节变化,该变化趋势与气温和降水变化趋势一致(图9).冰川运动是冰的变形、底部滑动和底部岩屑层运动等共同作用的结果,与冰川物质平衡、冰温、冰川的水力特征等密切相关[40-41].冰川运动速度的季节性变化通常与表面融化引起的底部润滑有关[42],冰川在暖季虽会因消融变薄,但暖季(5—9月)冰温高,冰川表面消融强烈,大量冰川融水通过冰川裂隙流入冰川底部,减少冰川底部摩擦力,进而冰川运动速度增大[43-44].降雨和融雪产生的水也可能与地表融水叠加,导致更大的融水输入,促使冰川底部滑动,从而影响冰川速度[45-46].此外,在底部滑动开始时,冰川与底部基岩之间的摩擦产生了大量的热量,为冰川底部润滑提供了额外的融水[47],进一步削弱了冰川的抗滑力,导致冰川速度增加. ...
1
2017
... 科其喀尔巴西冰川运动速度呈现显著的季节变化,该变化趋势与气温和降水变化趋势一致(图9).冰川运动是冰的变形、底部滑动和底部岩屑层运动等共同作用的结果,与冰川物质平衡、冰温、冰川的水力特征等密切相关[40-41].冰川运动速度的季节性变化通常与表面融化引起的底部润滑有关[42],冰川在暖季虽会因消融变薄,但暖季(5—9月)冰温高,冰川表面消融强烈,大量冰川融水通过冰川裂隙流入冰川底部,减少冰川底部摩擦力,进而冰川运动速度增大[43-44].降雨和融雪产生的水也可能与地表融水叠加,导致更大的融水输入,促使冰川底部滑动,从而影响冰川速度[45-46].此外,在底部滑动开始时,冰川与底部基岩之间的摩擦产生了大量的热量,为冰川底部润滑提供了额外的融水[47],进一步削弱了冰川的抗滑力,导致冰川速度增加. ...
Seasonal and interannual variabilities in terminus position, glacier velocity, and surface elevation at Helheim and Kangerlussuaq Glaciers from 2008 to 2016
2
2017
... 科其喀尔巴西冰川运动速度呈现显著的季节变化,该变化趋势与气温和降水变化趋势一致(图9).冰川运动是冰的变形、底部滑动和底部岩屑层运动等共同作用的结果,与冰川物质平衡、冰温、冰川的水力特征等密切相关[40-41].冰川运动速度的季节性变化通常与表面融化引起的底部润滑有关[42],冰川在暖季虽会因消融变薄,但暖季(5—9月)冰温高,冰川表面消融强烈,大量冰川融水通过冰川裂隙流入冰川底部,减少冰川底部摩擦力,进而冰川运动速度增大[43-44].降雨和融雪产生的水也可能与地表融水叠加,导致更大的融水输入,促使冰川底部滑动,从而影响冰川速度[45-46].此外,在底部滑动开始时,冰川与底部基岩之间的摩擦产生了大量的热量,为冰川底部润滑提供了额外的融水[47],进一步削弱了冰川的抗滑力,导致冰川速度增加. ...
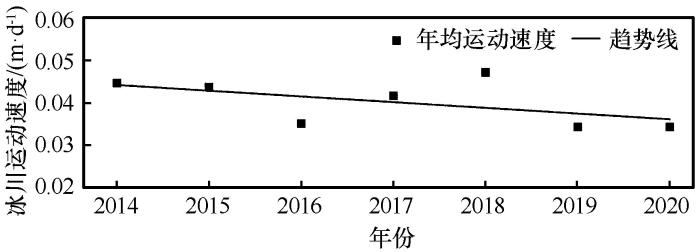
... 科其喀尔巴西冰川年际运动速度呈现微弱下降趋势(图7),该现象可归因于冰川厚度减薄.近几十年来全球气候变暖导致冰川呈现负物质平衡状态,进而造成冰川运动呈现减速趋势.联合国政府间气候变化专门委员会(IPCC)第六次评估报告显示,近几十年全球平均升温速度为(0.2±0.1) ℃·(10a)-1,山地冰川区域升温速率达到(0.3±0.2) ℃·(10a)-1[48],而气温是控制冰川物质损失的主要因素.Brun等[49]对亚洲高山区冰川物质平衡的研究结果表明,2000—2016年间天山山区年平均物质平衡为(-0.28±0.20) m w.e⋅a-1,累计物质平衡始终为负,这与本研究中冰川年际运动特征呈减小趋势的结论相一致.此外,液态降水也是加速冰川融化的重要驱动因素,当携带热量的雨滴落在冰体时,雨滴可能会侵蚀冰体[42,50],导致冰川进一步消融.气温和液态降水是导致冰川物质平衡改变的重要因素,当它们共同促进冰川物质亏损时,就会使得冰川运动速度减慢. ...
Kinematic investigations on the Furggwanghorn rock glacier, Switzerland
1
2018
... 科其喀尔巴西冰川运动速度呈现显著的季节变化,该变化趋势与气温和降水变化趋势一致(图9).冰川运动是冰的变形、底部滑动和底部岩屑层运动等共同作用的结果,与冰川物质平衡、冰温、冰川的水力特征等密切相关[40-41].冰川运动速度的季节性变化通常与表面融化引起的底部润滑有关[42],冰川在暖季虽会因消融变薄,但暖季(5—9月)冰温高,冰川表面消融强烈,大量冰川融水通过冰川裂隙流入冰川底部,减少冰川底部摩擦力,进而冰川运动速度增大[43-44].降雨和融雪产生的水也可能与地表融水叠加,导致更大的融水输入,促使冰川底部滑动,从而影响冰川速度[45-46].此外,在底部滑动开始时,冰川与底部基岩之间的摩擦产生了大量的热量,为冰川底部润滑提供了额外的融水[47],进一步削弱了冰川的抗滑力,导致冰川速度增加. ...
Water controls the seasonal rhythm of rock glacier flow
1
2019
... 科其喀尔巴西冰川运动速度呈现显著的季节变化,该变化趋势与气温和降水变化趋势一致(图9).冰川运动是冰的变形、底部滑动和底部岩屑层运动等共同作用的结果,与冰川物质平衡、冰温、冰川的水力特征等密切相关[40-41].冰川运动速度的季节性变化通常与表面融化引起的底部润滑有关[42],冰川在暖季虽会因消融变薄,但暖季(5—9月)冰温高,冰川表面消融强烈,大量冰川融水通过冰川裂隙流入冰川底部,减少冰川底部摩擦力,进而冰川运动速度增大[43-44].降雨和融雪产生的水也可能与地表融水叠加,导致更大的融水输入,促使冰川底部滑动,从而影响冰川速度[45-46].此外,在底部滑动开始时,冰川与底部基岩之间的摩擦产生了大量的热量,为冰川底部润滑提供了额外的融水[47],进一步削弱了冰川的抗滑力,导致冰川速度增加. ...
Factors controlling velocity variations at short-term, seasonal and multiyear time scales, Ritigraben rock glacier, Western Swiss Alps
1
2017
... 科其喀尔巴西冰川运动速度呈现显著的季节变化,该变化趋势与气温和降水变化趋势一致(图9).冰川运动是冰的变形、底部滑动和底部岩屑层运动等共同作用的结果,与冰川物质平衡、冰温、冰川的水力特征等密切相关[40-41].冰川运动速度的季节性变化通常与表面融化引起的底部润滑有关[42],冰川在暖季虽会因消融变薄,但暖季(5—9月)冰温高,冰川表面消融强烈,大量冰川融水通过冰川裂隙流入冰川底部,减少冰川底部摩擦力,进而冰川运动速度增大[43-44].降雨和融雪产生的水也可能与地表融水叠加,导致更大的融水输入,促使冰川底部滑动,从而影响冰川速度[45-46].此外,在底部滑动开始时,冰川与底部基岩之间的摩擦产生了大量的热量,为冰川底部润滑提供了额外的融水[47],进一步削弱了冰川的抗滑力,导致冰川速度增加. ...
A two-dimensional, higher-order, enthalpy-based thermomechanical ice flow model for mountain glaciers and its benchmark experiments
1
2020
... 科其喀尔巴西冰川运动速度呈现显著的季节变化,该变化趋势与气温和降水变化趋势一致(图9).冰川运动是冰的变形、底部滑动和底部岩屑层运动等共同作用的结果,与冰川物质平衡、冰温、冰川的水力特征等密切相关[40-41].冰川运动速度的季节性变化通常与表面融化引起的底部润滑有关[42],冰川在暖季虽会因消融变薄,但暖季(5—9月)冰温高,冰川表面消融强烈,大量冰川融水通过冰川裂隙流入冰川底部,减少冰川底部摩擦力,进而冰川运动速度增大[43-44].降雨和融雪产生的水也可能与地表融水叠加,导致更大的融水输入,促使冰川底部滑动,从而影响冰川速度[45-46].此外,在底部滑动开始时,冰川与底部基岩之间的摩擦产生了大量的热量,为冰川底部润滑提供了额外的融水[47],进一步削弱了冰川的抗滑力,导致冰川速度增加. ...
Seasonal dynamic thinning at Helheim Glacier
1
2015
... 科其喀尔巴西冰川运动速度呈现显著的季节变化,该变化趋势与气温和降水变化趋势一致(图9).冰川运动是冰的变形、底部滑动和底部岩屑层运动等共同作用的结果,与冰川物质平衡、冰温、冰川的水力特征等密切相关[40-41].冰川运动速度的季节性变化通常与表面融化引起的底部润滑有关[42],冰川在暖季虽会因消融变薄,但暖季(5—9月)冰温高,冰川表面消融强烈,大量冰川融水通过冰川裂隙流入冰川底部,减少冰川底部摩擦力,进而冰川运动速度增大[43-44].降雨和融雪产生的水也可能与地表融水叠加,导致更大的融水输入,促使冰川底部滑动,从而影响冰川速度[45-46].此外,在底部滑动开始时,冰川与底部基岩之间的摩擦产生了大量的热量,为冰川底部润滑提供了额外的融水[47],进一步削弱了冰川的抗滑力,导致冰川速度增加. ...
1
2019
... 科其喀尔巴西冰川年际运动速度呈现微弱下降趋势(图7),该现象可归因于冰川厚度减薄.近几十年来全球气候变暖导致冰川呈现负物质平衡状态,进而造成冰川运动呈现减速趋势.联合国政府间气候变化专门委员会(IPCC)第六次评估报告显示,近几十年全球平均升温速度为(0.2±0.1) ℃·(10a)-1,山地冰川区域升温速率达到(0.3±0.2) ℃·(10a)-1[48],而气温是控制冰川物质损失的主要因素.Brun等[49]对亚洲高山区冰川物质平衡的研究结果表明,2000—2016年间天山山区年平均物质平衡为(-0.28±0.20) m w.e⋅a-1,累计物质平衡始终为负,这与本研究中冰川年际运动特征呈减小趋势的结论相一致.此外,液态降水也是加速冰川融化的重要驱动因素,当携带热量的雨滴落在冰体时,雨滴可能会侵蚀冰体[42,50],导致冰川进一步消融.气温和液态降水是导致冰川物质平衡改变的重要因素,当它们共同促进冰川物质亏损时,就会使得冰川运动速度减慢. ...
A spatially resolved estimate of High Mountain Asia glacier mass balances from 2000 to 2016
1
2017
... 科其喀尔巴西冰川年际运动速度呈现微弱下降趋势(图7),该现象可归因于冰川厚度减薄.近几十年来全球气候变暖导致冰川呈现负物质平衡状态,进而造成冰川运动呈现减速趋势.联合国政府间气候变化专门委员会(IPCC)第六次评估报告显示,近几十年全球平均升温速度为(0.2±0.1) ℃·(10a)-1,山地冰川区域升温速率达到(0.3±0.2) ℃·(10a)-1[48],而气温是控制冰川物质损失的主要因素.Brun等[49]对亚洲高山区冰川物质平衡的研究结果表明,2000—2016年间天山山区年平均物质平衡为(-0.28±0.20) m w.e⋅a-1,累计物质平衡始终为负,这与本研究中冰川年际运动特征呈减小趋势的结论相一致.此外,液态降水也是加速冰川融化的重要驱动因素,当携带热量的雨滴落在冰体时,雨滴可能会侵蚀冰体[42,50],导致冰川进一步消融.气温和液态降水是导致冰川物质平衡改变的重要因素,当它们共同促进冰川物质亏损时,就会使得冰川运动速度减慢. ...
Short-term velocity variations at three rock glaciers and their relationship with meteorological conditions
1
2016
... 科其喀尔巴西冰川年际运动速度呈现微弱下降趋势(图7),该现象可归因于冰川厚度减薄.近几十年来全球气候变暖导致冰川呈现负物质平衡状态,进而造成冰川运动呈现减速趋势.联合国政府间气候变化专门委员会(IPCC)第六次评估报告显示,近几十年全球平均升温速度为(0.2±0.1) ℃·(10a)-1,山地冰川区域升温速率达到(0.3±0.2) ℃·(10a)-1[48],而气温是控制冰川物质损失的主要因素.Brun等[49]对亚洲高山区冰川物质平衡的研究结果表明,2000—2016年间天山山区年平均物质平衡为(-0.28±0.20) m w.e⋅a-1,累计物质平衡始终为负,这与本研究中冰川年际运动特征呈减小趋势的结论相一致.此外,液态降水也是加速冰川融化的重要驱动因素,当携带热量的雨滴落在冰体时,雨滴可能会侵蚀冰体[42,50],导致冰川进一步消融.气温和液态降水是导致冰川物质平衡改变的重要因素,当它们共同促进冰川物质亏损时,就会使得冰川运动速度减慢. ...


 甘公网安备 62010202000676号