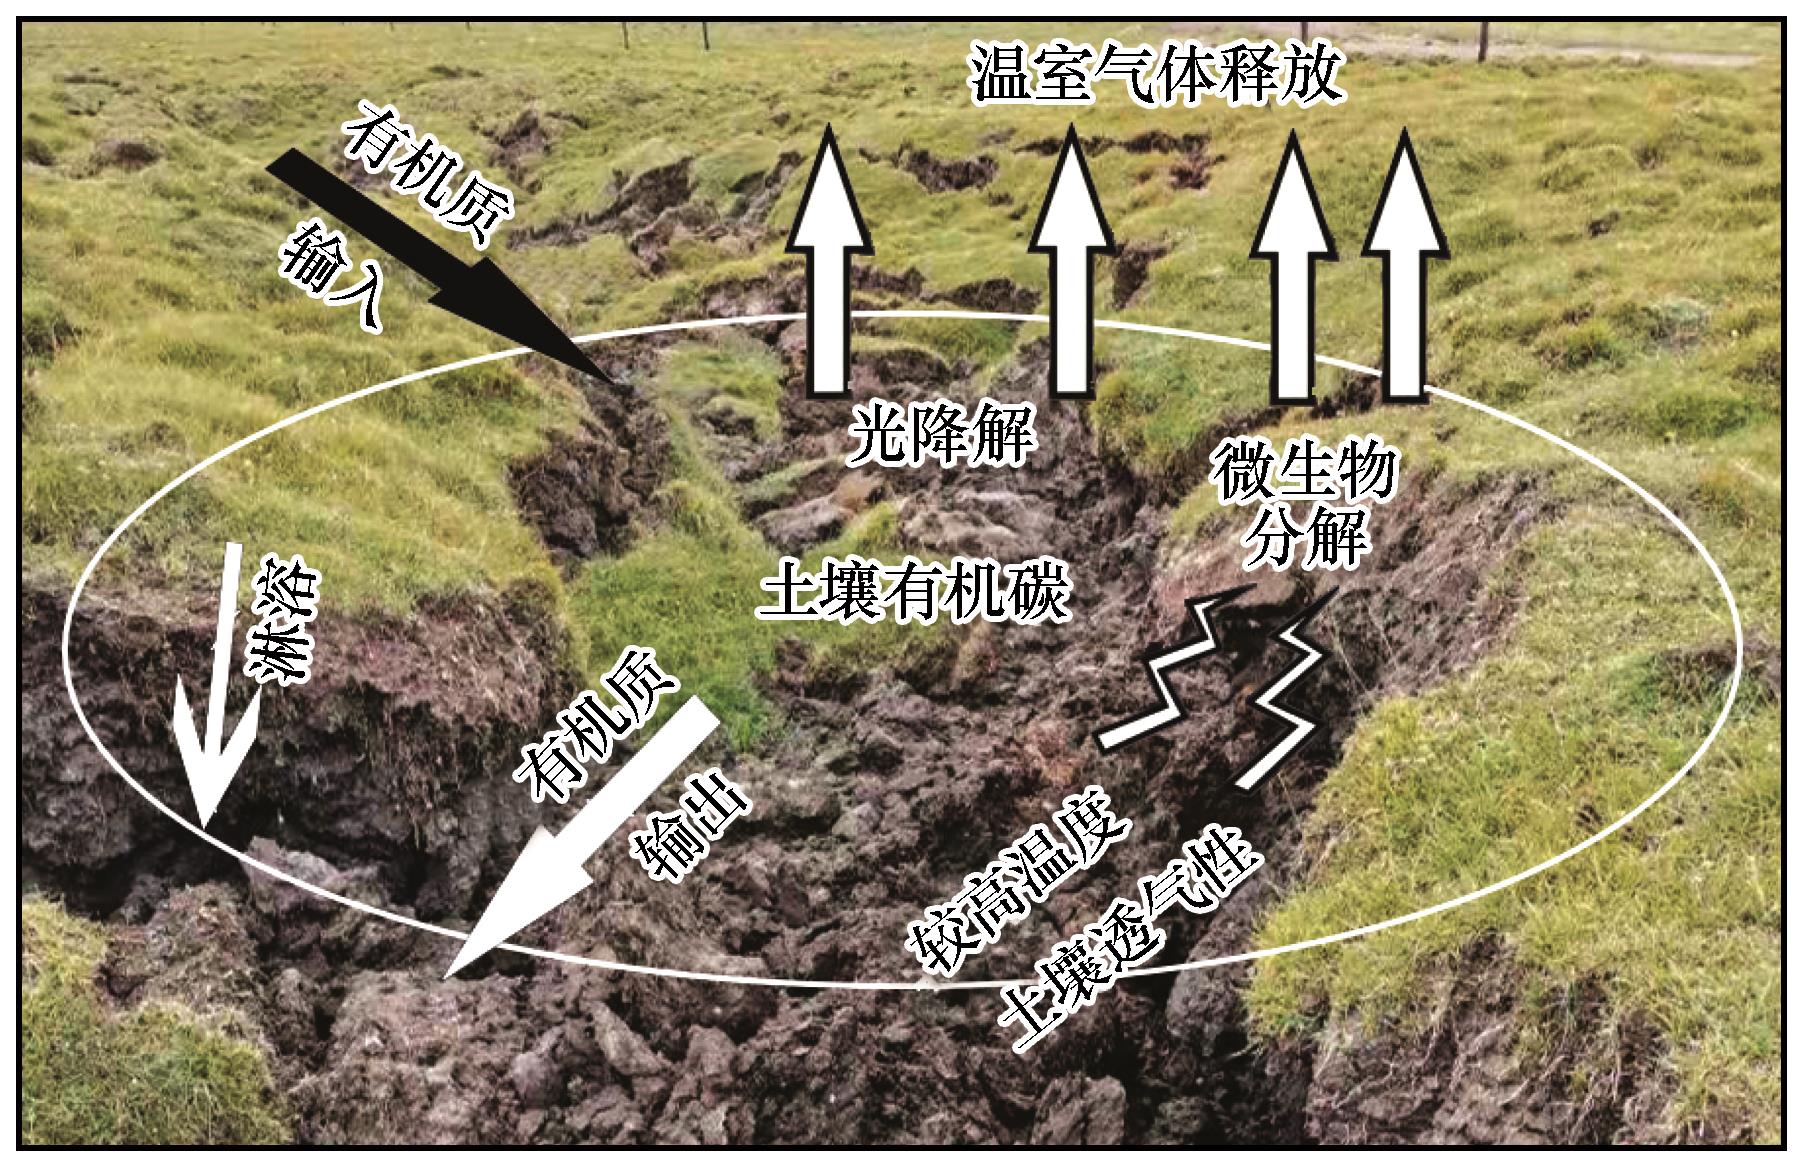
Fig.4 A schematic of thaw slumps influencing the ecosystem carbon cycle[47]
The black arrows represent the input of dissolved organic matter,and the white arrows represent the vertical carbon distribution process and the greenhouse gas emissions
Other figure/table from this article