×
模态框(Modal)标题
在这里添加一些文本
Close
Close
Submit
Cancel
Confirm
×
模态框(Modal)标题
×
ISSN 1000-0240
CN 62-1072/P
RSS
|
Email Alert
Toggle navigation
Home
About Journal
Editorial Board
Authors
Publication Ethics
Journal Online
Current Issue
Online First
Archive
Most Read
Most Download
Most Cited
Subscription
Advertisement
Contact Us
中文
Figure/Table detail
Studies of thermokarst and its effects on ecosystem carbon cycle in the Third Polar regions and the Arctic
Lin JIA, Chengyan FAN, Mei MU, Xu CHEN, Wen ZHONG, Jianguo SHANG, Feng ZHANG, Lili LI, Xiaoqing PENG, Cuicui MU, Tingjun ZHANG
Journal of Glaciology and Geocryology
, 2020, 42(
1
): 157-169. DOI:
10.7522/j.issn.1000-0240.2020.0006
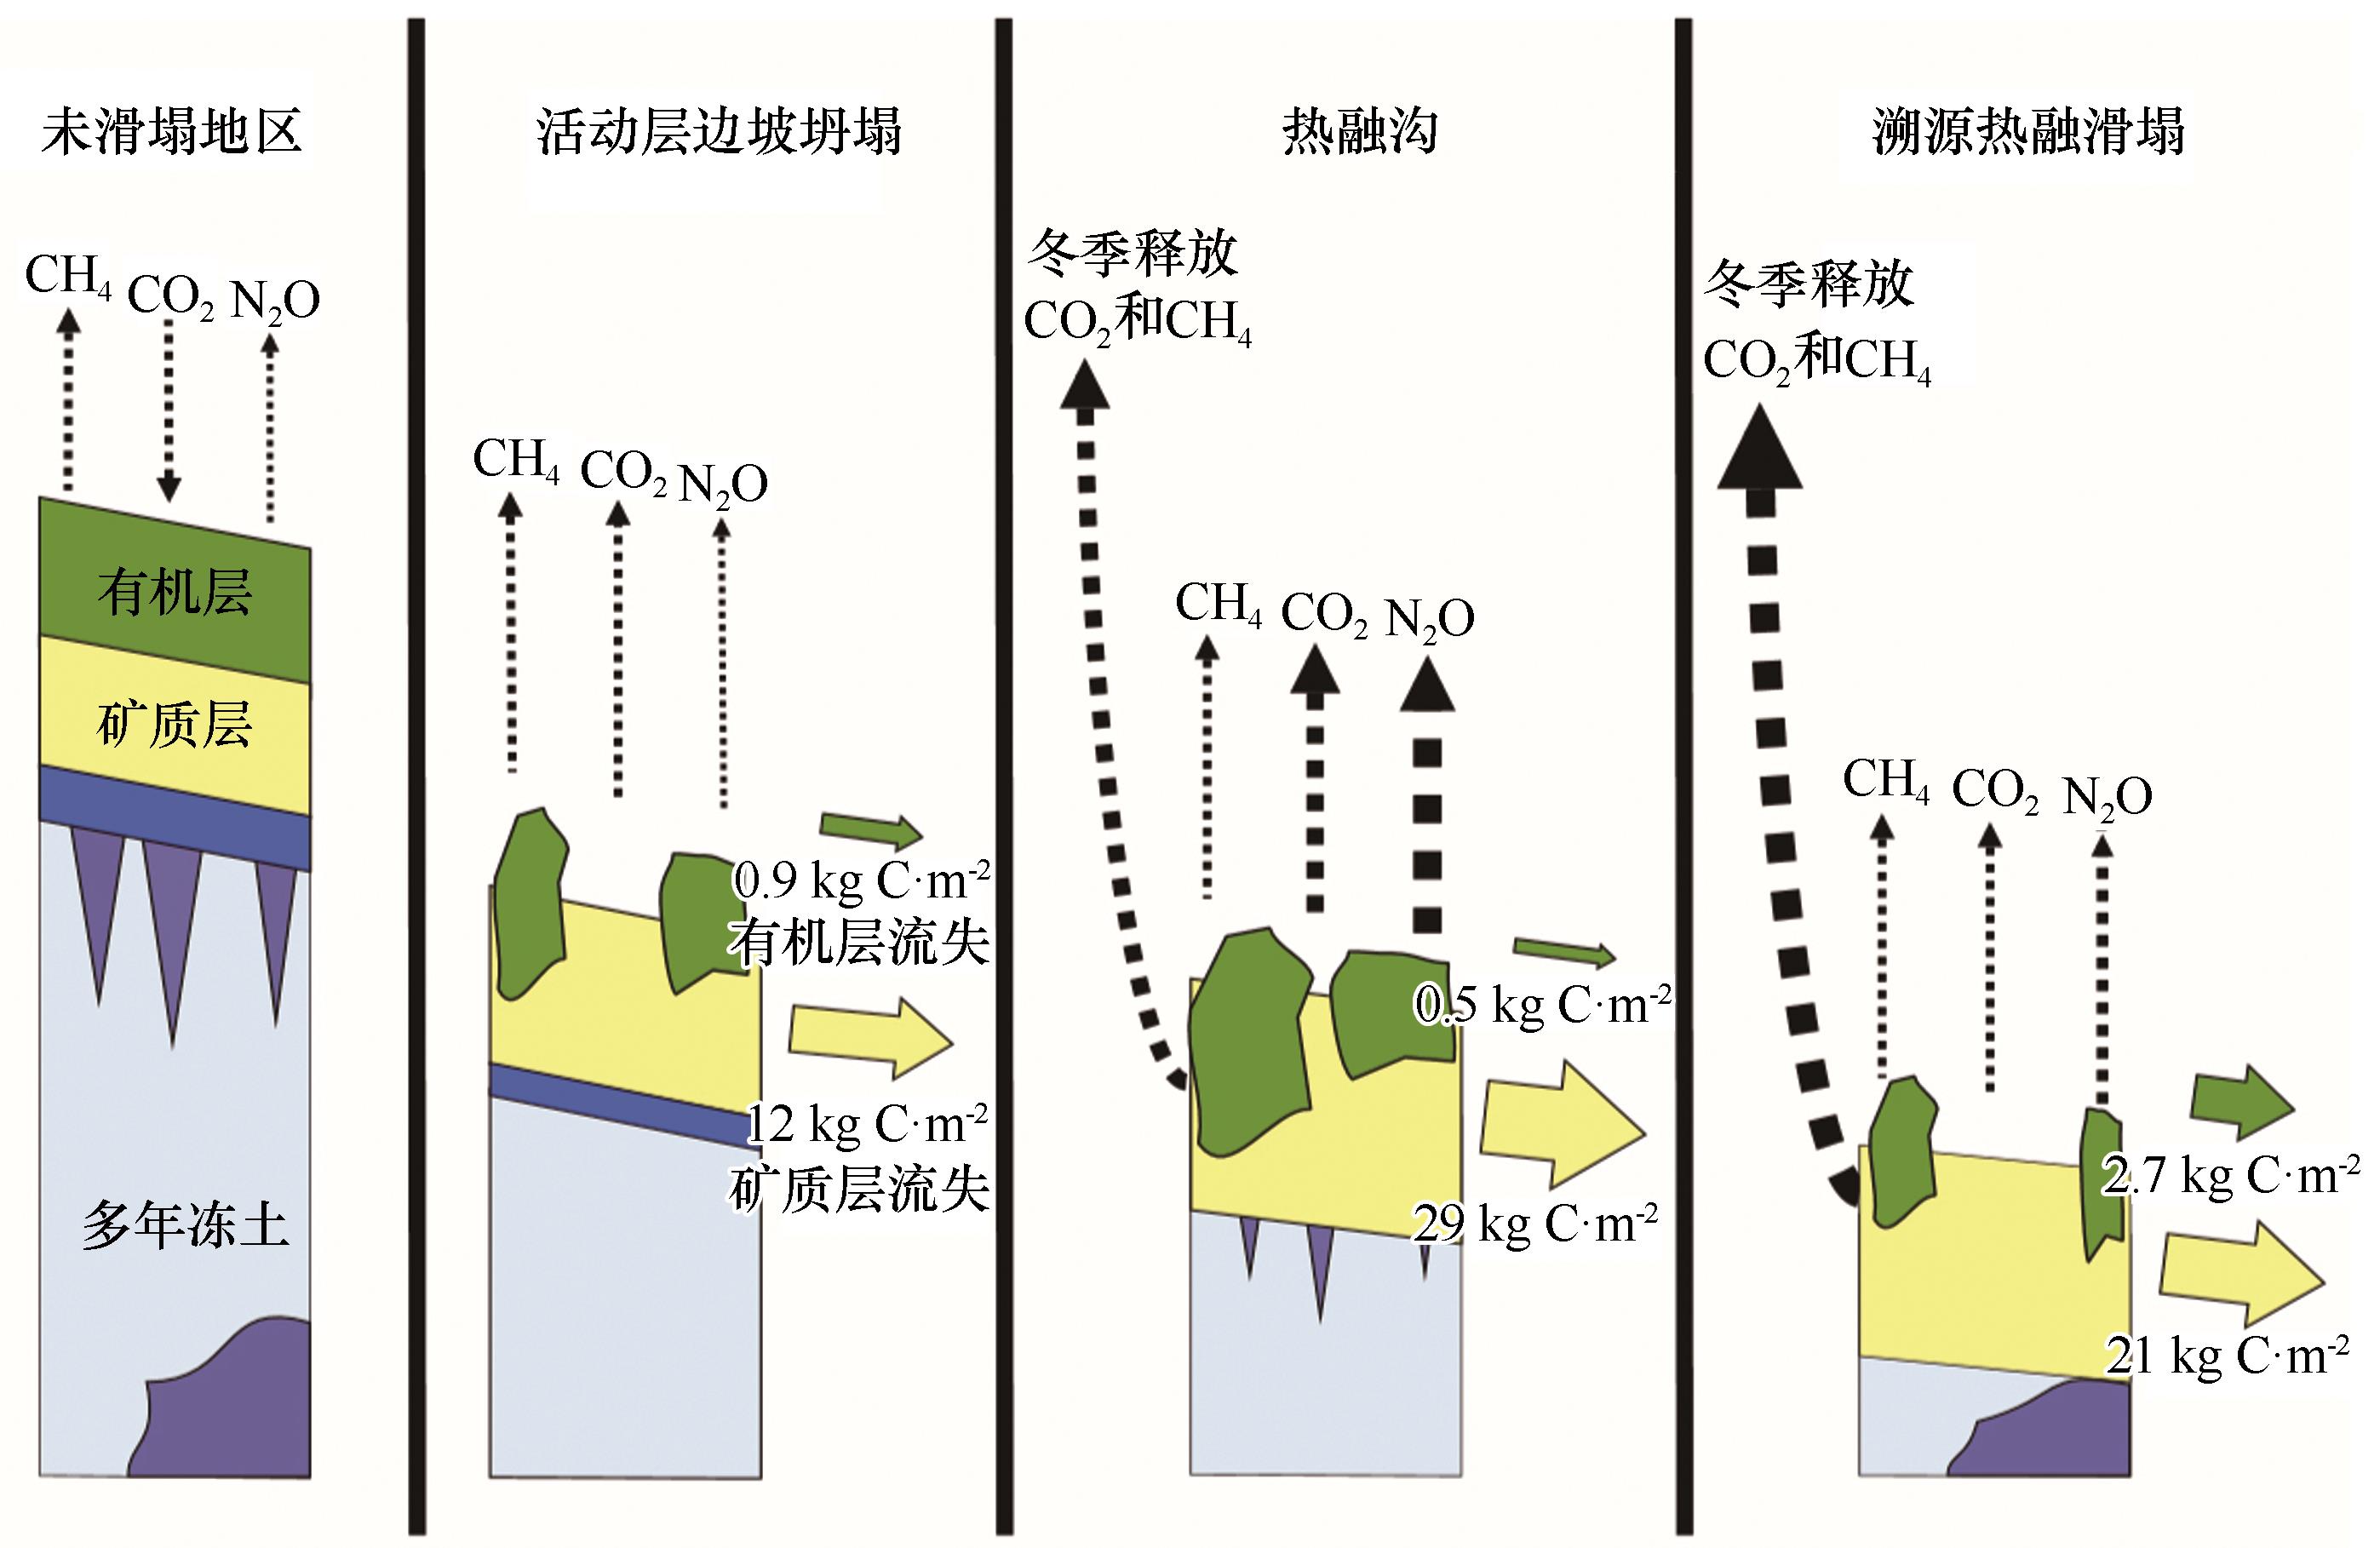
Fig.6
Conceptual model of the effects of the three types of most common hillslope thermokarst landscapes on carbon and nitrogen cycling and flux
[
16
]
Other figure/table from this article
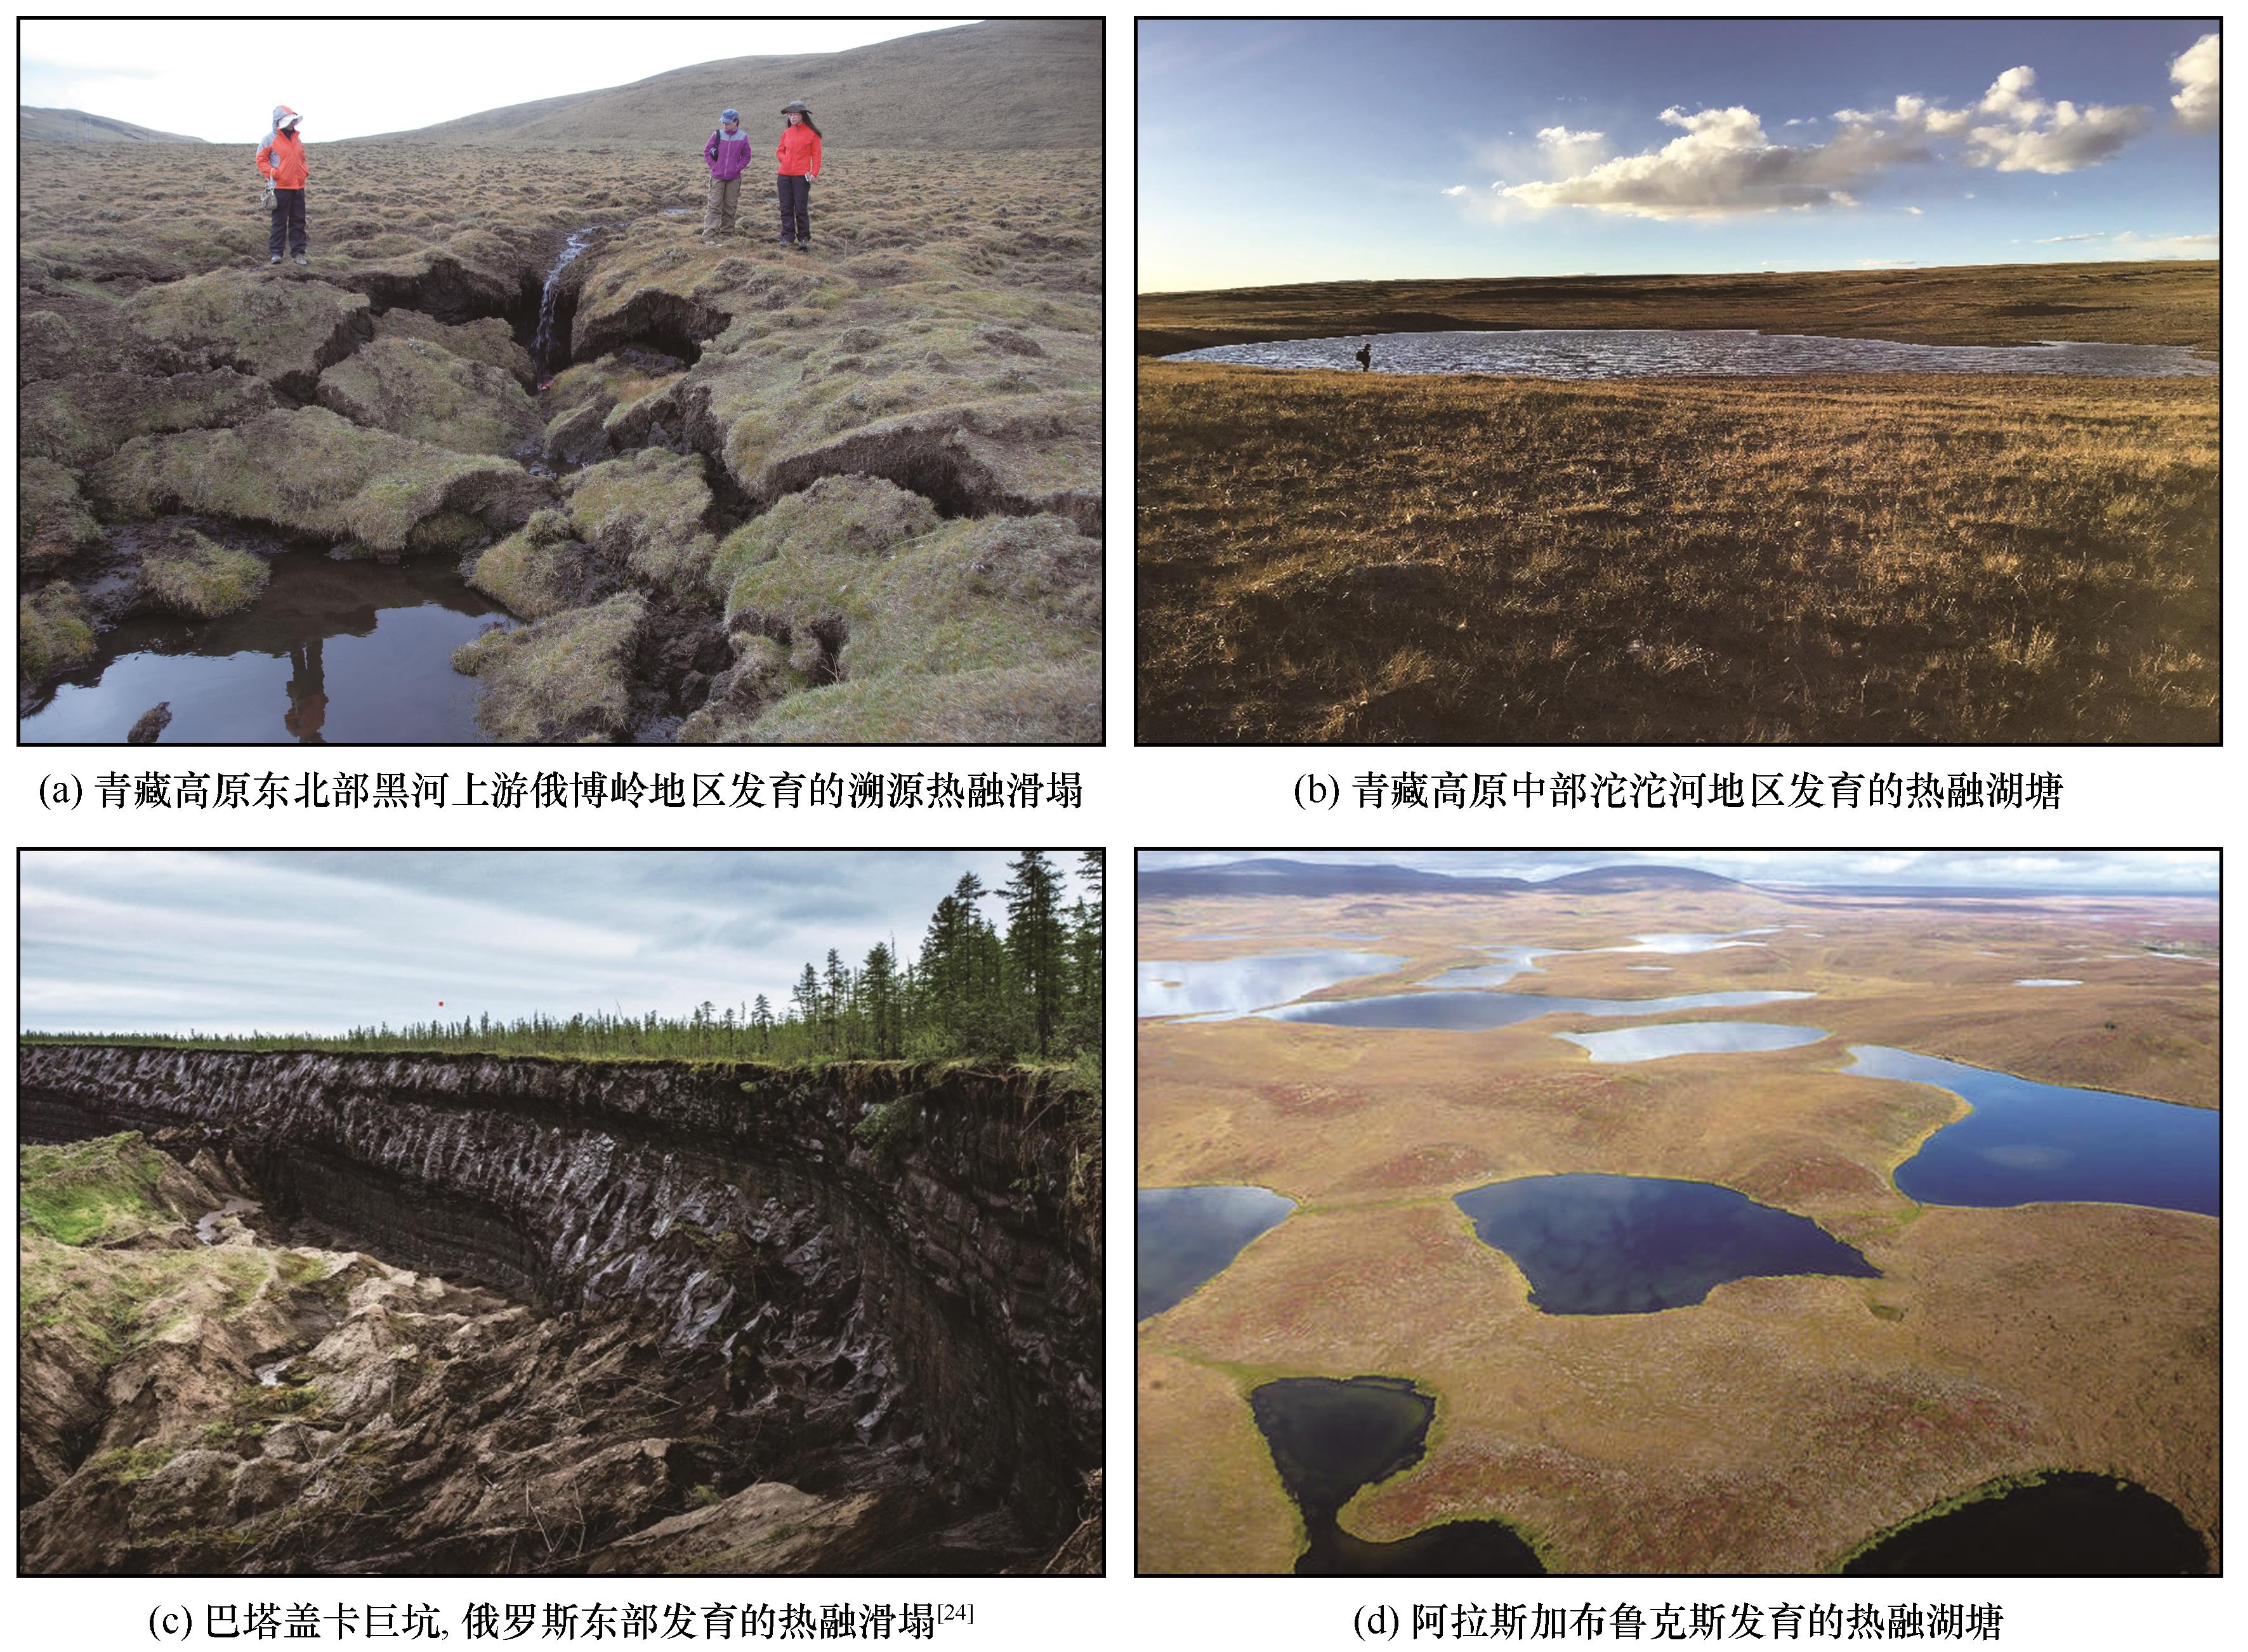
Fig.1
Typical thermokarst landforms
Table 1
Typical thermokarst landscape classifications and definitions
Fig.2
Mechanisms of soil carbon loss affected by thermokarst in the permafrost regions
[
30
]
The active layer thickness in Zone 1 increases uniformly in space,while Zone 2 belongs to the spatial heterogeneous permafrost degradation caused by the differences of ground ice content
Table 2
The dynamic change of types of thermokarst collapse on the Qinghai-Tibet Plateau
[
25
,
34
,
38
]
Fig.3
The development of thaw slump on the Eboling mountains of the Qilian Mountains on the northern Qinghai-Tibet Plateau from 1997 to 2015 (based on 2009 satellite imagery). The widest part of the slump widened by 24 m from 1997 to 2009, and widened by 30 m from 2009 to 2015; the source of the slump retreated 23 m from 1997 to 2009, and from 2009 to 2015 going back 29 m
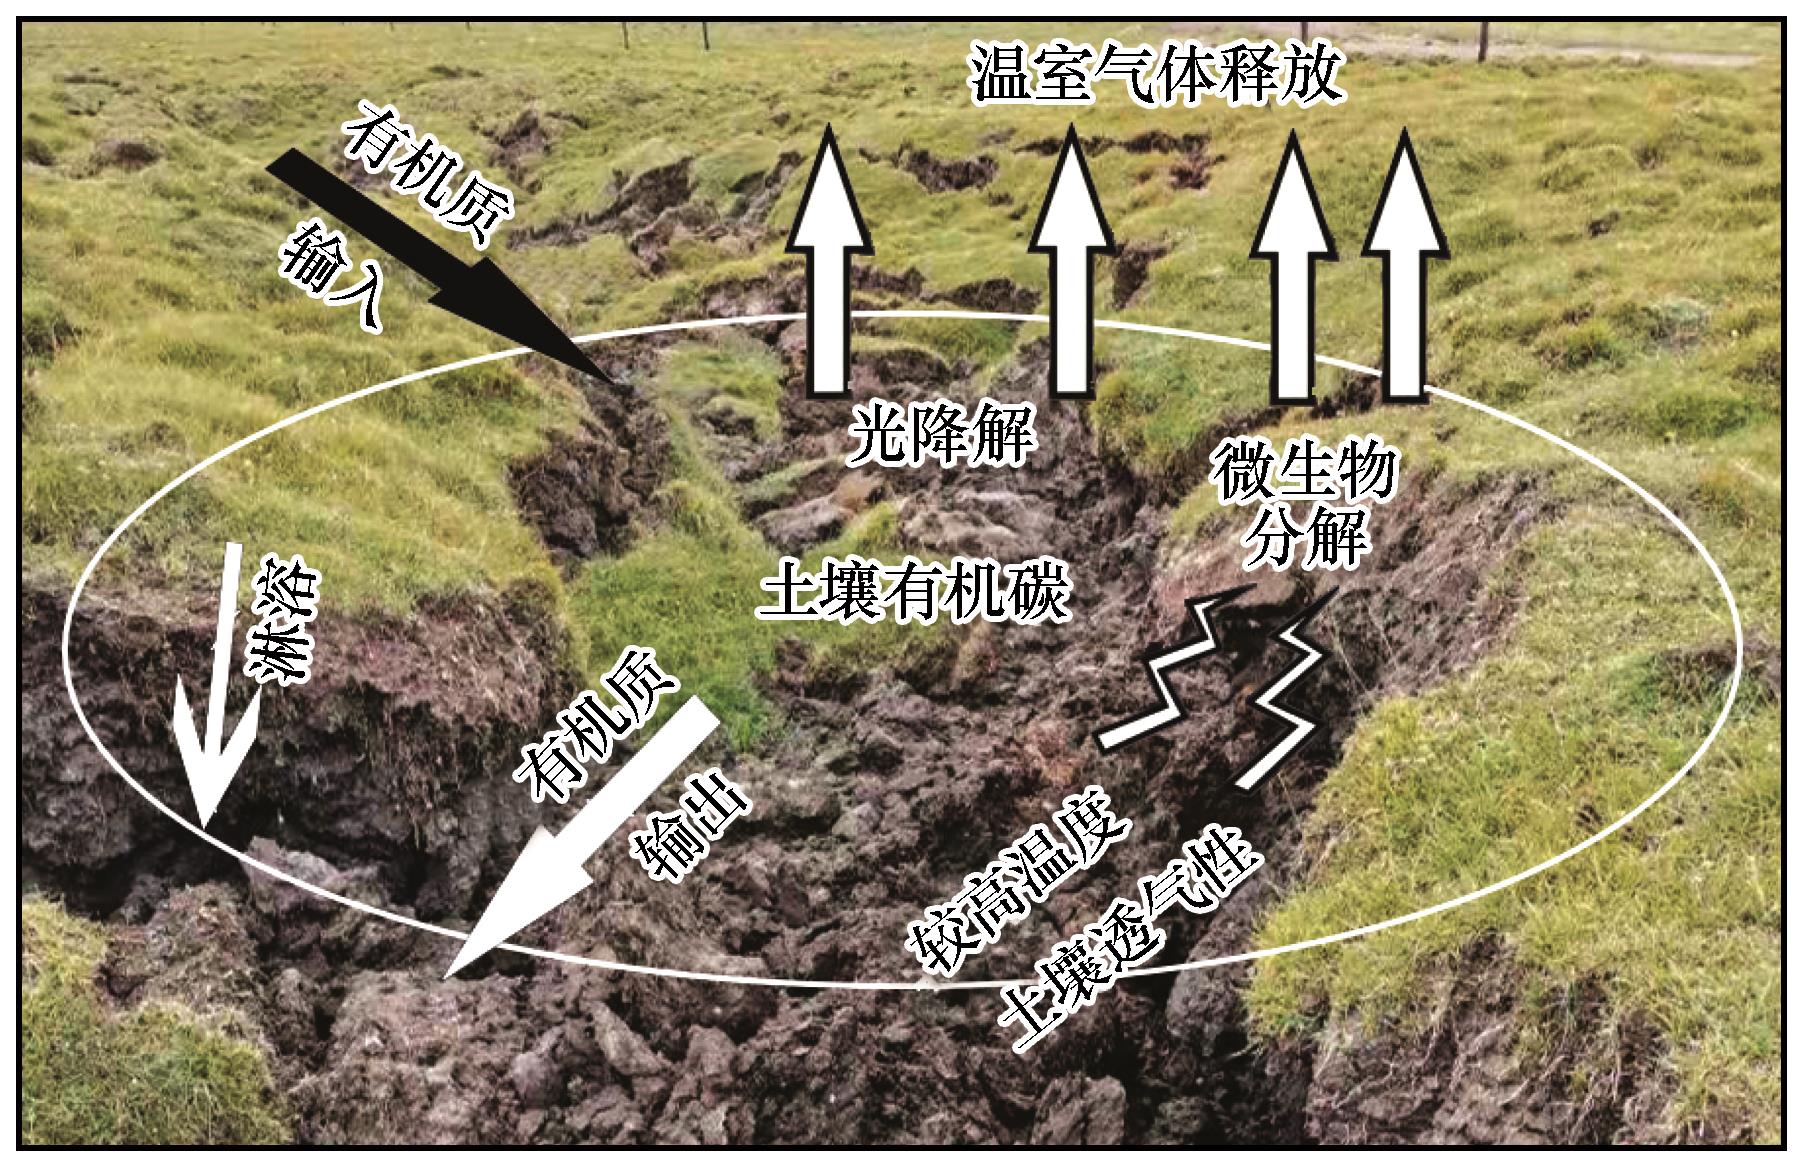
Fig.4
A schematic of thaw slumps influencing the ecosystem carbon cycle
[
47
]
The black arrows represent the input of dissolved organic matter,and the white arrows represent the vertical carbon distribution process and the greenhouse gas emissions
Fig.5
Impacts of permafrost degradation on soil moisture, dissolved organic carbon and the release of greenhouse gases (CO
2
, CH
4
and N
2
O), and the arrows indicate the direction and potential of ecosystem greenhouse gas exchange during the growing seasons
[
45
]
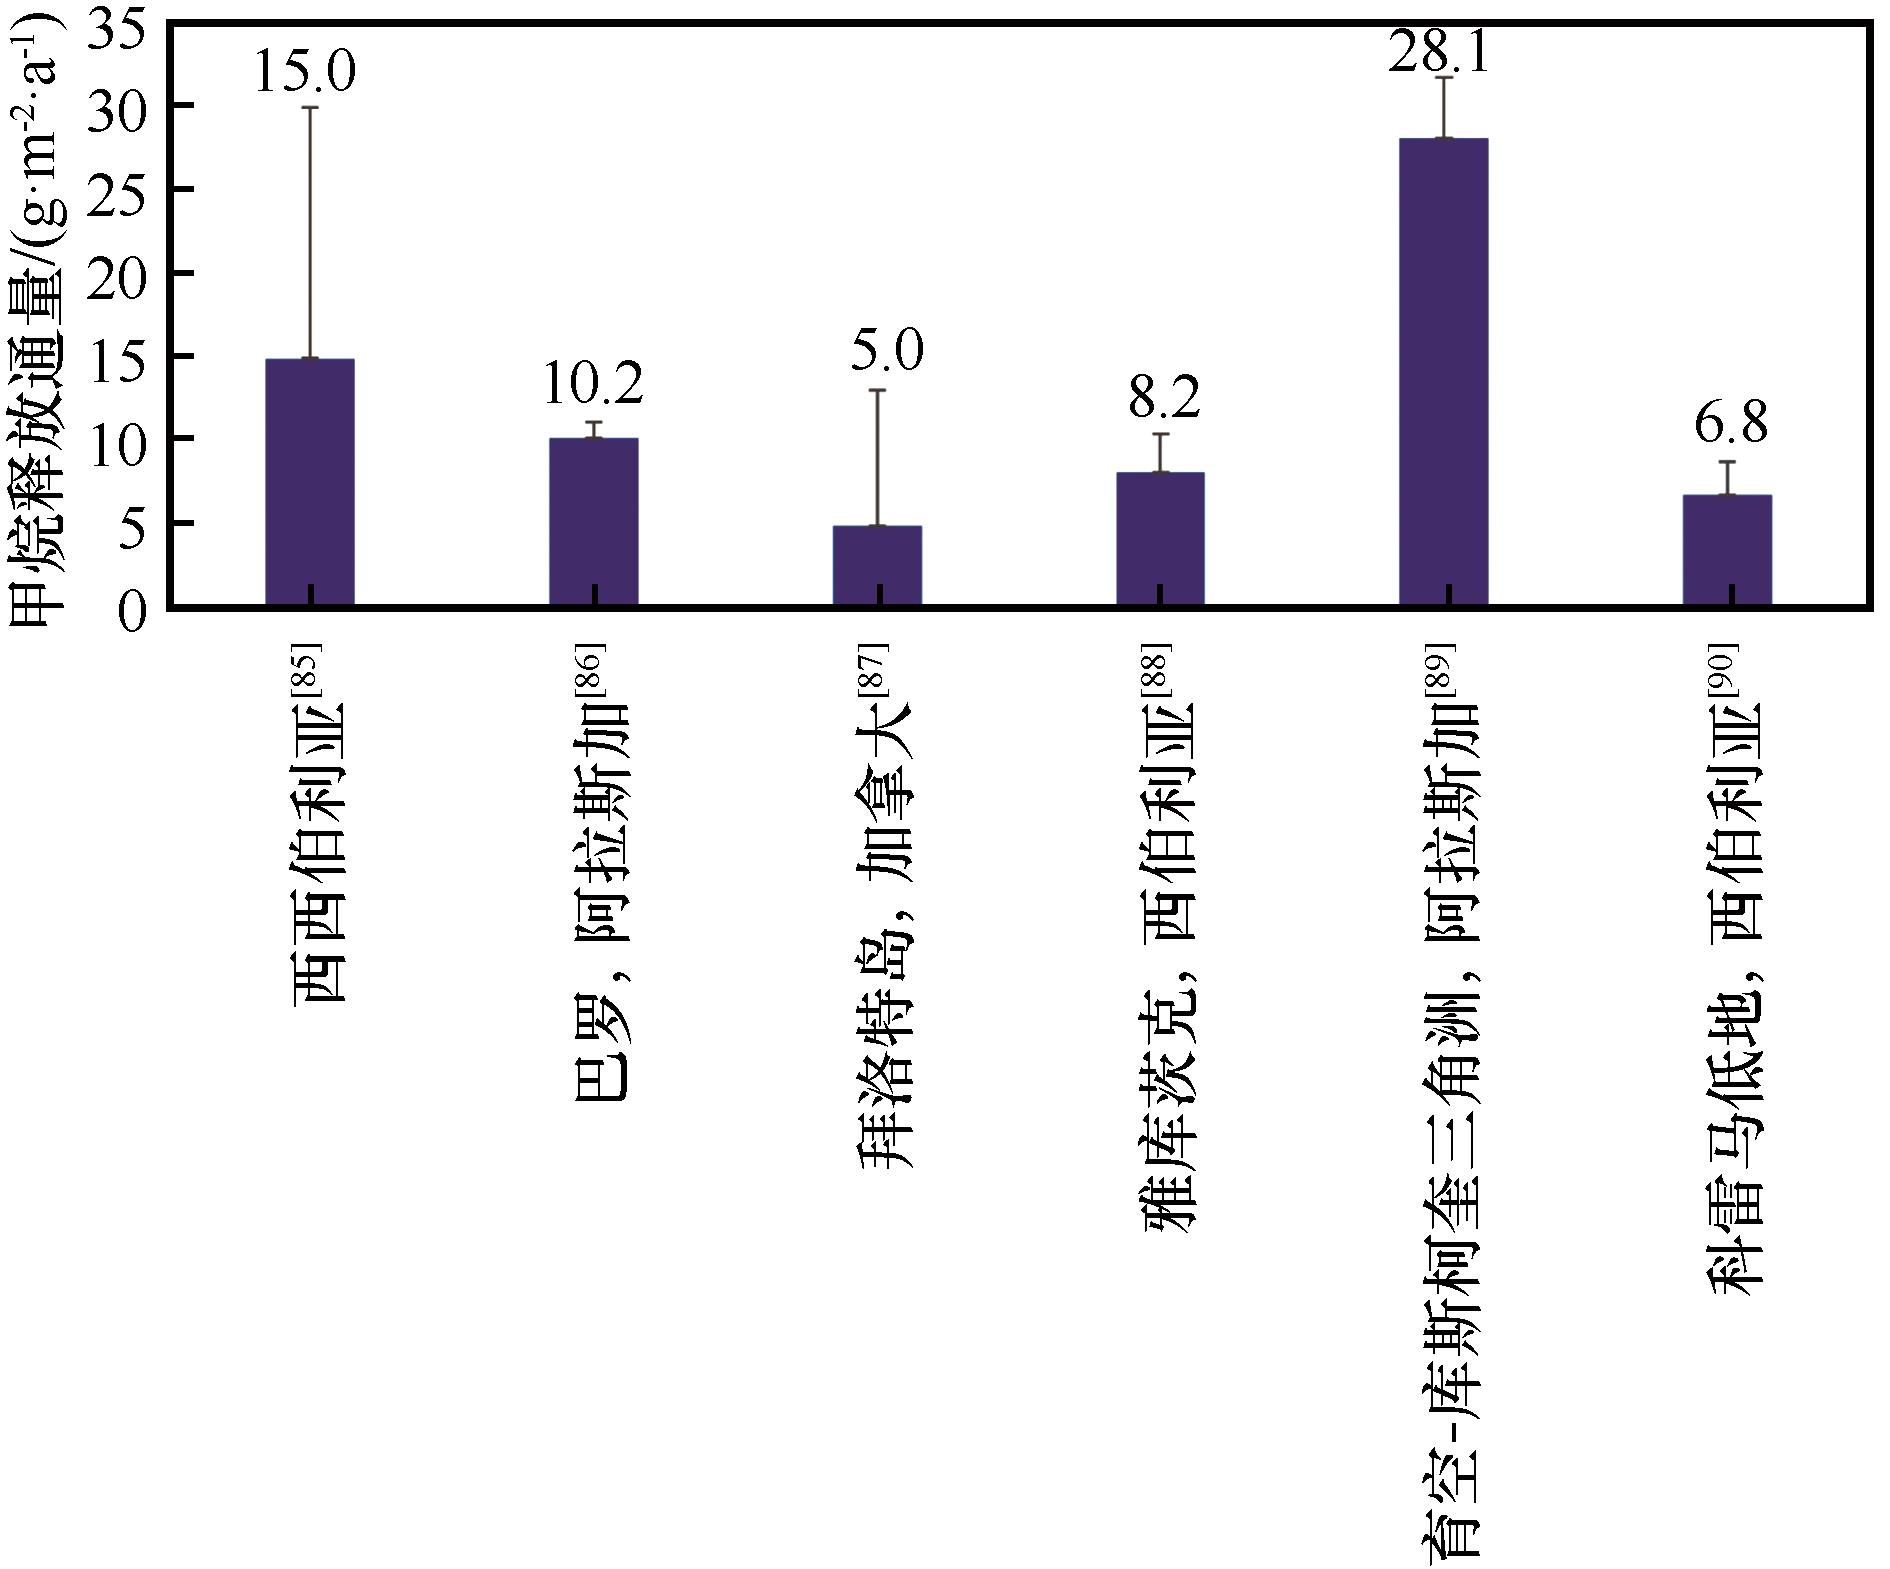
Fig.7
Comparisons of methane release fluxes from thermokarst lakes in the Arctic regions
[
85
-
90
]